
|
|||||
|
 | |
| |
| |
| |
| |
| |
|
Gene: KITLG |
Gene summary for KITLG |
| Gene information | Species | Human | Gene symbol | KITLG | Gene ID | 4254 |
| Gene name | KIT ligand | |
| Gene Alias | DCUA | |
| Cytomap | 12q21.32 | |
| Gene Type | protein-coding | GO ID | GO:0000003 | UniProtAcc | A0A024RBC0 |
Top |
Malignant transformation analysis |
| Identification of the aberrant gene expression in precancerous and cancerous lesions by comparing the gene expression of stem-like cells in diseased tissues with normal stem cells |
| Entrez ID | Symbol | Replicates | Species | Organ | Tissue | Adj P-value | Log2FC | Malignancy |
| 4254 | KITLG | LZE7T | Human | Esophagus | ESCC | 5.98e-05 | 6.79e-01 | 0.0667 |
| 4254 | KITLG | LZE8T | Human | Esophagus | ESCC | 2.75e-03 | 3.52e-01 | 0.067 |
| 4254 | KITLG | P1T-E | Human | Esophagus | ESCC | 3.49e-09 | 3.56e-01 | 0.0875 |
| 4254 | KITLG | P2T-E | Human | Esophagus | ESCC | 3.01e-10 | 1.99e-01 | 0.1177 |
| 4254 | KITLG | P4T-E | Human | Esophagus | ESCC | 2.23e-12 | 1.19e-01 | 0.1323 |
| 4254 | KITLG | P5T-E | Human | Esophagus | ESCC | 4.64e-10 | 1.30e-01 | 0.1327 |
| 4254 | KITLG | P8T-E | Human | Esophagus | ESCC | 6.94e-12 | 1.45e-01 | 0.0889 |
| 4254 | KITLG | P9T-E | Human | Esophagus | ESCC | 2.25e-04 | 7.32e-02 | 0.1131 |
| 4254 | KITLG | P10T-E | Human | Esophagus | ESCC | 1.03e-09 | 9.43e-02 | 0.116 |
| 4254 | KITLG | P12T-E | Human | Esophagus | ESCC | 3.46e-06 | 3.34e-02 | 0.1122 |
| 4254 | KITLG | P15T-E | Human | Esophagus | ESCC | 1.83e-08 | 2.41e-01 | 0.1149 |
| 4254 | KITLG | P16T-E | Human | Esophagus | ESCC | 2.81e-07 | 3.33e-02 | 0.1153 |
| 4254 | KITLG | P20T-E | Human | Esophagus | ESCC | 2.12e-05 | 2.94e-02 | 0.1124 |
| 4254 | KITLG | P21T-E | Human | Esophagus | ESCC | 6.52e-05 | 9.94e-02 | 0.1617 |
| 4254 | KITLG | P22T-E | Human | Esophagus | ESCC | 6.15e-12 | 2.72e-02 | 0.1236 |
| 4254 | KITLG | P23T-E | Human | Esophagus | ESCC | 1.10e-17 | 6.09e-01 | 0.108 |
| 4254 | KITLG | P24T-E | Human | Esophagus | ESCC | 4.51e-04 | -2.84e-02 | 0.1287 |
| 4254 | KITLG | P26T-E | Human | Esophagus | ESCC | 1.13e-08 | 1.53e-01 | 0.1276 |
| 4254 | KITLG | P27T-E | Human | Esophagus | ESCC | 7.44e-05 | 1.46e-01 | 0.1055 |
| 4254 | KITLG | P31T-E | Human | Esophagus | ESCC | 7.95e-07 | 5.87e-02 | 0.1251 |
| Page: 1 2 3 4 |
| Tissue | Expression Dynamics | Abbreviation |
| Esophagus |  | ESCC: Esophageal squamous cell carcinoma |
| HGIN: High-grade intraepithelial neoplasias | ||
| LGIN: Low-grade intraepithelial neoplasias | ||
| Lung | 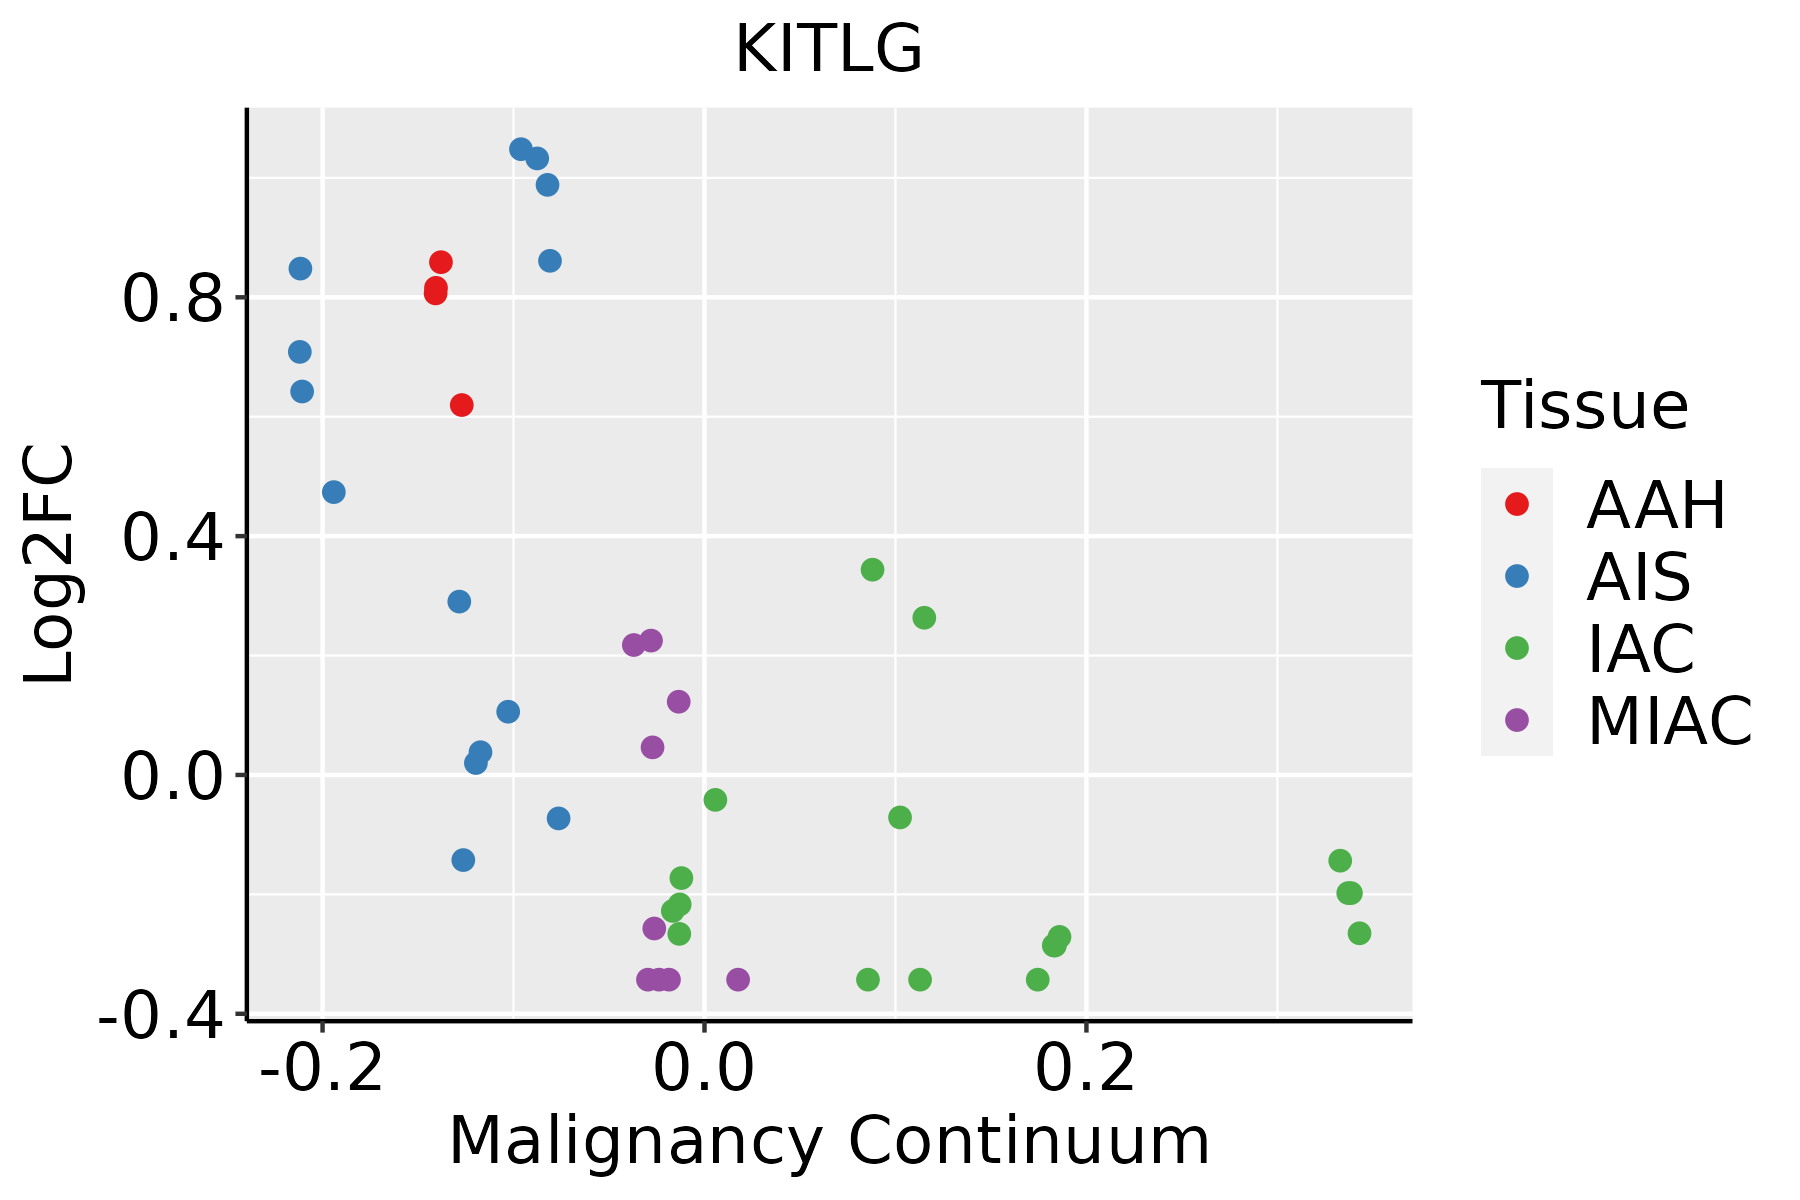 | AAH: Atypical adenomatous hyperplasia |
| AIS: Adenocarcinoma in situ | ||
| IAC: Invasive lung adenocarcinoma | ||
| MIA: Minimally invasive adenocarcinoma | ||
| Prostate | 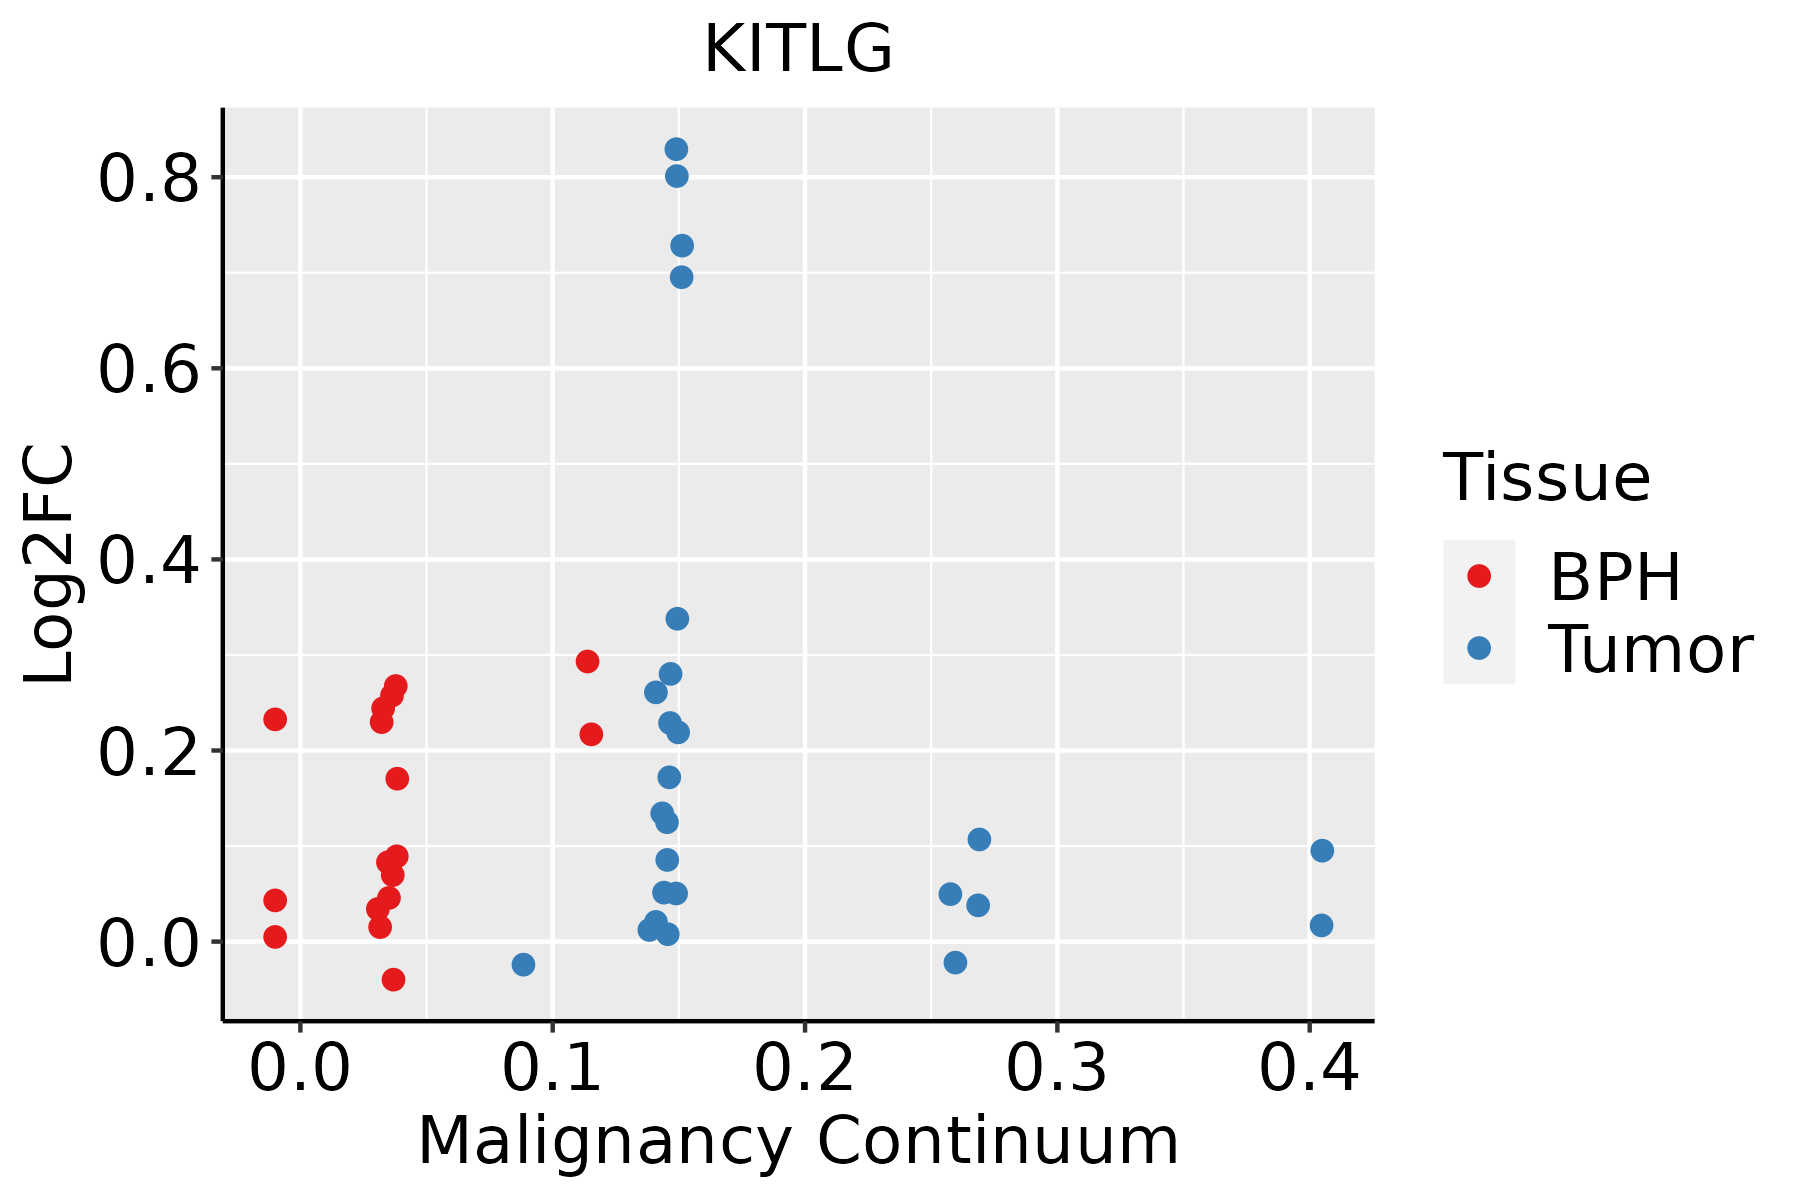 | BPH: Benign Prostatic Hyperplasia |
| Thyroid | 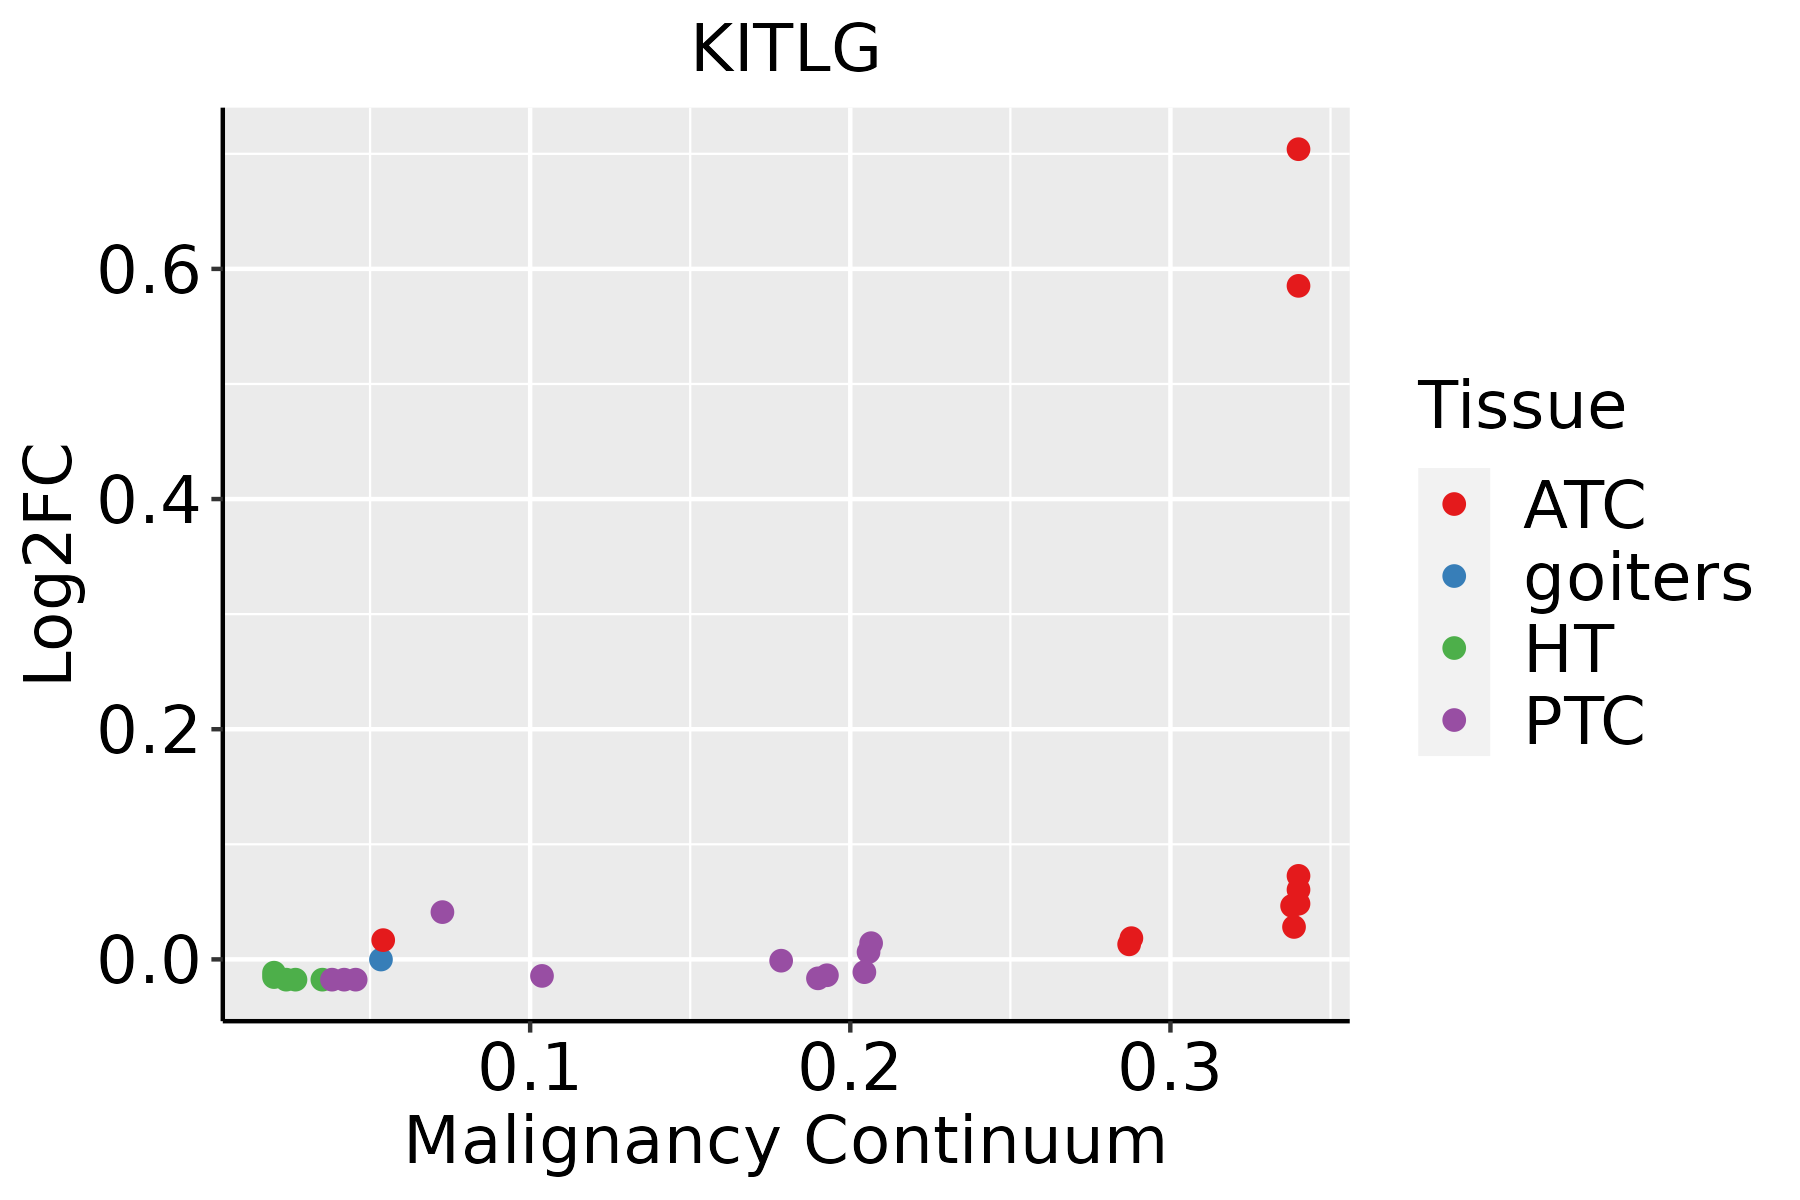 | ATC: Anaplastic thyroid cancer |
| HT: Hashimoto's thyroiditis | ||
| PTC: Papillary thyroid cancer |
| ∗log2FC in expression of this searched gene in stem-like cells from each diseased tissue sample relative to stem-like cells in normal samples in each tissue plotted against the malignancy continuum. Samples are colored based on if they are from different disease stage. |
Top |
Malignant transformation related pathway analysis |
| Find out the enriched GO biological processes and KEGG pathways involved in transition from healthy to precancer to cancer |
| Tissue | Disease Stage | Enriched GO biological Processes |
| Colorectum | AD |  |
| Colorectum | SER |  |
| Colorectum | MSS |  |
| Colorectum | MSI-H |  |
| Colorectum | FAP |  |
| ∗Top 15 enriched GO BP terms are showed in the bar plot of each disease state in each tissue. Each row represents a significant GO biological process which is colored according to the -log10(p.adjust). |
| Page: 1 2 3 4 5 6 7 8 9 |
| GO ID | Tissue | Disease Stage | Description | Gene Ratio | Bg Ratio | pvalue | p.adjust | Count |
| GO:0097191111 | Esophagus | ESCC | extrinsic apoptotic signaling pathway | 159/8552 | 219/18723 | 4.12e-16 | 2.94e-14 | 159 |
| GO:007190016 | Esophagus | ESCC | regulation of protein serine/threonine kinase activity | 227/8552 | 359/18723 | 1.12e-11 | 4.10e-10 | 227 |
| GO:0030099111 | Esophagus | ESCC | myeloid cell differentiation | 232/8552 | 381/18723 | 1.22e-09 | 2.90e-08 | 232 |
| GO:000726510 | Esophagus | ESCC | Ras protein signal transduction | 201/8552 | 337/18723 | 1.44e-07 | 2.30e-06 | 201 |
| GO:0002262111 | Esophagus | ESCC | myeloid cell homeostasis | 104/8552 | 157/18723 | 1.49e-07 | 2.36e-06 | 104 |
| GO:0061458110 | Esophagus | ESCC | reproductive system development | 247/8552 | 427/18723 | 2.24e-07 | 3.42e-06 | 247 |
| GO:004860818 | Esophagus | ESCC | reproductive structure development | 245/8552 | 424/18723 | 2.82e-07 | 4.14e-06 | 245 |
| GO:0048872111 | Esophagus | ESCC | homeostasis of number of cells | 163/8552 | 272/18723 | 1.40e-06 | 1.69e-05 | 163 |
| GO:00719029 | Esophagus | ESCC | positive regulation of protein serine/threonine kinase activity | 124/8552 | 200/18723 | 2.27e-06 | 2.61e-05 | 124 |
| GO:000257317 | Esophagus | ESCC | myeloid leukocyte differentiation | 128/8552 | 208/18723 | 2.75e-06 | 3.15e-05 | 128 |
| GO:00380347 | Esophagus | ESCC | signal transduction in absence of ligand | 48/8552 | 65/18723 | 3.63e-06 | 3.97e-05 | 48 |
| GO:00971927 | Esophagus | ESCC | extrinsic apoptotic signaling pathway in absence of ligand | 48/8552 | 65/18723 | 3.63e-06 | 3.97e-05 | 48 |
| GO:004586018 | Esophagus | ESCC | positive regulation of protein kinase activity | 219/8552 | 386/18723 | 6.91e-06 | 6.97e-05 | 219 |
| GO:003367420 | Esophagus | ESCC | positive regulation of kinase activity | 260/8552 | 467/18723 | 7.26e-06 | 7.22e-05 | 260 |
| GO:00488638 | Esophagus | ESCC | stem cell differentiation | 122/8552 | 206/18723 | 5.95e-05 | 4.59e-04 | 122 |
| GO:1903706110 | Esophagus | ESCC | regulation of hemopoiesis | 201/8552 | 367/18723 | 2.60e-04 | 1.58e-03 | 201 |
| GO:19021076 | Esophagus | ESCC | positive regulation of leukocyte differentiation | 93/8552 | 157/18723 | 4.20e-04 | 2.39e-03 | 93 |
| GO:19037086 | Esophagus | ESCC | positive regulation of hemopoiesis | 93/8552 | 157/18723 | 4.20e-04 | 2.39e-03 | 93 |
| GO:004563918 | Esophagus | ESCC | positive regulation of myeloid cell differentiation | 64/8552 | 103/18723 | 5.54e-04 | 3.03e-03 | 64 |
| GO:00487628 | Esophagus | ESCC | mesenchymal cell differentiation | 133/8552 | 236/18723 | 5.94e-04 | 3.22e-03 | 133 |
| Page: 1 2 3 4 5 6 7 8 9 10 |
| Pathway ID | Tissue | Disease Stage | Description | Gene Ratio | Bg Ratio | pvalue | p.adjust | qvalue | Count |
| hsa041517 | Esophagus | ESCC | PI3K-Akt signaling pathway | 197/4205 | 354/8465 | 1.24e-02 | 2.83e-02 | 1.45e-02 | 197 |
| hsa0415114 | Esophagus | ESCC | PI3K-Akt signaling pathway | 197/4205 | 354/8465 | 1.24e-02 | 2.83e-02 | 1.45e-02 | 197 |
| hsa0401021 | Lung | AIS | MAPK signaling pathway | 57/961 | 302/8465 | 6.41e-05 | 9.43e-04 | 6.03e-04 | 57 |
| hsa0401521 | Lung | AIS | Rap1 signaling pathway | 41/961 | 210/8465 | 3.23e-04 | 3.38e-03 | 2.16e-03 | 41 |
| hsa0415121 | Lung | AIS | PI3K-Akt signaling pathway | 57/961 | 354/8465 | 3.72e-03 | 2.00e-02 | 1.28e-02 | 57 |
| hsa0401031 | Lung | AIS | MAPK signaling pathway | 57/961 | 302/8465 | 6.41e-05 | 9.43e-04 | 6.03e-04 | 57 |
| hsa0401531 | Lung | AIS | Rap1 signaling pathway | 41/961 | 210/8465 | 3.23e-04 | 3.38e-03 | 2.16e-03 | 41 |
| hsa0415131 | Lung | AIS | PI3K-Akt signaling pathway | 57/961 | 354/8465 | 3.72e-03 | 2.00e-02 | 1.28e-02 | 57 |
| hsa040104 | Lung | AAH | MAPK signaling pathway | 27/348 | 302/8465 | 1.13e-04 | 6.32e-03 | 5.08e-03 | 27 |
| hsa0401541 | Lung | AAH | Rap1 signaling pathway | 20/348 | 210/8465 | 3.89e-04 | 1.35e-02 | 1.09e-02 | 20 |
| hsa040105 | Lung | AAH | MAPK signaling pathway | 27/348 | 302/8465 | 1.13e-04 | 6.32e-03 | 5.08e-03 | 27 |
| hsa0401551 | Lung | AAH | Rap1 signaling pathway | 20/348 | 210/8465 | 3.89e-04 | 1.35e-02 | 1.09e-02 | 20 |
| hsa0401010 | Prostate | BPH | MAPK signaling pathway | 87/1718 | 302/8465 | 2.05e-04 | 1.13e-03 | 6.98e-04 | 87 |
| hsa0401516 | Prostate | BPH | Rap1 signaling pathway | 61/1718 | 210/8465 | 1.40e-03 | 5.85e-03 | 3.62e-03 | 61 |
| hsa0401013 | Prostate | BPH | MAPK signaling pathway | 87/1718 | 302/8465 | 2.05e-04 | 1.13e-03 | 6.98e-04 | 87 |
| hsa0401517 | Prostate | BPH | Rap1 signaling pathway | 61/1718 | 210/8465 | 1.40e-03 | 5.85e-03 | 3.62e-03 | 61 |
| hsa0415122 | Prostate | Tumor | PI3K-Akt signaling pathway | 105/1791 | 354/8465 | 7.42e-05 | 5.30e-04 | 3.28e-04 | 105 |
| hsa0401022 | Prostate | Tumor | MAPK signaling pathway | 87/1791 | 302/8465 | 8.46e-04 | 3.94e-03 | 2.45e-03 | 87 |
| hsa0401523 | Prostate | Tumor | Rap1 signaling pathway | 60/1791 | 210/8465 | 6.16e-03 | 2.12e-02 | 1.32e-02 | 60 |
| hsa0415132 | Prostate | Tumor | PI3K-Akt signaling pathway | 105/1791 | 354/8465 | 7.42e-05 | 5.30e-04 | 3.28e-04 | 105 |
| Page: 1 2 |
Top |
Cell-cell communication analysis |
| Identification of potential cell-cell interactions between two cell types and their ligand-receptor pairs for different disease states |
| Ligand | Receptor | LRpair | Pathway | Tissue | Disease Stage |
| KITLG | KIT | KITL_KIT | KIT | Breast | Healthy |
| KITLG | KIT | KITL_KIT | KIT | Cervix | CC |
| KITLG | KIT | KITL_KIT | KIT | Cervix | Healthy |
| KITLG | KIT | KITL_KIT | KIT | Cervix | Precancer |
| KITLG | KIT | KITL_KIT | KIT | CRC | Healthy |
| KITLG | KIT | KITL_KIT | KIT | Endometrium | AEH |
| KITLG | KIT | KITL_KIT | KIT | Endometrium | EEC |
| KITLG | KIT | KITL_KIT | KIT | Esophagus | ESCC |
| KITLG | KIT | KITL_KIT | KIT | HNSCC | OSCC |
| KITLG | KIT | KITL_KIT | KIT | HNSCC | Precancer |
| KITLG | KIT | KITL_KIT | KIT | Lung | AAH |
| KITLG | KIT | KITL_KIT | KIT | Lung | AIS |
| KITLG | KIT | KITL_KIT | KIT | Lung | IAC |
| KITLG | KIT | KITL_KIT | KIT | Lung | MIAC |
| KITLG | KIT | KITL_KIT | KIT | Lung | Precancer |
| KITLG | KIT | KITL_KIT | KIT | Skin | ADJ |
| KITLG | KIT | KITL_KIT | KIT | Skin | AK |
| KITLG | KIT | KITL_KIT | KIT | Skin | cSCC |
| Page: 1 |
Top |
Single-cell gene regulatory network inference analysis |
| Find out the significant the regulons (TFs) and the target genes of each regulon across cell types for different disease states |
| TF | Cell Type | Tissue | Disease Stage | Target Gene | RSS | Regulon Activity |
| ∗The dot plots of a searched regulon are shown for all cell subpopulations in each disease state of each tissue based on the regulon specific score inferred using pySCENIC and by calculating the average expression. |
| Page: 1 |
Top |
Somatic mutation of malignant transformation related genes |
| Annotation of somatic variants for genes involved in malignant transformation |
| Hugo Symbol | Variant Class | Variant Classification | dbSNP RS | HGVSc | HGVSp | HGVSp Short | SWISSPROT | BIOTYPE | SIFT | PolyPhen | Tumor Sample Barcode | Tissue | Histology | Sex | Age | Stage | Therapy Types | Drugs | Outcome |
| KITLG | SNV | Missense_Mutation | rs772482728 | c.25C>T | p.Leu9Phe | p.L9F | P21583 | protein_coding | deleterious(0.03) | benign(0.003) | TCGA-A1-A0SF-01 | Breast | breast invasive carcinoma | Female | <65 | I/II | Chemotherapy | tc | SD |
| KITLG | SNV | Missense_Mutation | c.77N>G | p.Glu26Gly | p.E26G | P21583 | protein_coding | tolerated(0.26) | benign(0.061) | TCGA-A8-A06Z-01 | Breast | breast invasive carcinoma | Female | >=65 | I/II | Unknown | Unknown | SD | |
| KITLG | SNV | Missense_Mutation | c.793N>C | p.Glu265Gln | p.E265Q | P21583 | protein_coding | tolerated(0.81) | benign(0.043) | TCGA-AC-A23H-01 | Breast | breast invasive carcinoma | Female | >=65 | I/II | Unknown | Unknown | PD | |
| KITLG | SNV | Missense_Mutation | rs373413384 | c.511N>T | p.Pro171Ser | p.P171S | P21583 | protein_coding | deleterious(0.01) | probably_damaging(0.999) | TCGA-C8-A12O-01 | Breast | breast invasive carcinoma | Female | <65 | I/II | Unknown | Unknown | SD |
| KITLG | SNV | Missense_Mutation | novel | c.437G>C | p.Arg146Thr | p.R146T | P21583 | protein_coding | tolerated(0.2) | possibly_damaging(0.48) | TCGA-VS-A94Z-01 | Cervix | cervical & endocervical cancer | Female | <65 | I/II | Chemotherapy | cisplatin | CR |
| KITLG | SNV | Missense_Mutation | c.469N>A | p.Ala157Thr | p.A157T | P21583 | protein_coding | tolerated(1) | benign(0) | TCGA-AA-A00N-01 | Colorectum | colon adenocarcinoma | Male | >=65 | I/II | Unknown | Unknown | PD | |
| KITLG | deletion | Frame_Shift_Del | c.375delN | p.Lys125AsnfsTer31 | p.K125Nfs*31 | P21583 | protein_coding | TCGA-A6-5661-01 | Colorectum | colon adenocarcinoma | Female | >=65 | I/II | Unknown | Unknown | SD | |||
| KITLG | deletion | Frame_Shift_Del | c.375delN | p.Lys125AsnfsTer31 | p.K125Nfs*31 | P21583 | protein_coding | TCGA-A6-6653-01 | Colorectum | colon adenocarcinoma | Male | >=65 | I/II | Unknown | Unknown | SD | |||
| KITLG | insertion | Frame_Shift_Ins | novel | c.623dupC | p.Gly209TrpfsTer41 | p.G209Wfs*41 | P21583 | protein_coding | TCGA-AA-3947-01 | Colorectum | colon adenocarcinoma | Female | <65 | I/II | Unknown | Unknown | SD | ||
| KITLG | SNV | Missense_Mutation | novel | c.178G>A | p.Gly60Arg | p.G60R | P21583 | protein_coding | tolerated(0.09) | probably_damaging(0.994) | TCGA-AJ-A3OK-01 | Endometrium | uterine corpus endometrioid carcinoma | Female | >=65 | I/II | Chemotherapy | carboplatin | CR |
| Page: 1 2 3 4 |
Top |
Related drugs of malignant transformation related genes |
| Identification of chemicals and drugs interact with genes involved in malignant transfromation |
| (DGIdb 4.0) |
| Entrez ID | Symbol | Category | Interaction Types | Drug Claim Name | Drug Name | PMIDs |
| Page: 1 |

Copyright 2023-Present -The University of Texas Health Science Center at Houston |