
|
|||||
|
 | |
| |
| |
| |
| |
| |
|
Gene: KIFC3 |
Gene summary for KIFC3 |
| Gene information | Species | Human | Gene symbol | KIFC3 | Gene ID | 3801 |
| Gene name | kinesin family member C3 | |
| Gene Alias | KIFC3 | |
| Cytomap | 16q21 | |
| Gene Type | protein-coding | GO ID | GO:0003008 | UniProtAcc | Q9BVG8 |
Top |
Malignant transformation analysis |
| Identification of the aberrant gene expression in precancerous and cancerous lesions by comparing the gene expression of stem-like cells in diseased tissues with normal stem cells |
| Entrez ID | Symbol | Replicates | Species | Organ | Tissue | Adj P-value | Log2FC | Malignancy |
| 3801 | KIFC3 | LZE6T | Human | Esophagus | ESCC | 4.08e-03 | 1.28e-01 | 0.0845 |
| 3801 | KIFC3 | P1T-E | Human | Esophagus | ESCC | 2.68e-11 | 8.70e-01 | 0.0875 |
| 3801 | KIFC3 | P2T-E | Human | Esophagus | ESCC | 9.14e-07 | 1.26e-01 | 0.1177 |
| 3801 | KIFC3 | P4T-E | Human | Esophagus | ESCC | 1.02e-05 | 2.45e-01 | 0.1323 |
| 3801 | KIFC3 | P5T-E | Human | Esophagus | ESCC | 2.51e-24 | 4.62e-01 | 0.1327 |
| 3801 | KIFC3 | P8T-E | Human | Esophagus | ESCC | 1.39e-12 | 2.73e-01 | 0.0889 |
| 3801 | KIFC3 | P9T-E | Human | Esophagus | ESCC | 3.66e-05 | 1.67e-01 | 0.1131 |
| 3801 | KIFC3 | P10T-E | Human | Esophagus | ESCC | 2.78e-06 | 8.45e-02 | 0.116 |
| 3801 | KIFC3 | P11T-E | Human | Esophagus | ESCC | 3.87e-23 | 7.60e-01 | 0.1426 |
| 3801 | KIFC3 | P12T-E | Human | Esophagus | ESCC | 1.37e-02 | 1.32e-01 | 0.1122 |
| 3801 | KIFC3 | P15T-E | Human | Esophagus | ESCC | 1.37e-03 | 2.03e-01 | 0.1149 |
| 3801 | KIFC3 | P16T-E | Human | Esophagus | ESCC | 6.84e-07 | 1.32e-01 | 0.1153 |
| 3801 | KIFC3 | P19T-E | Human | Esophagus | ESCC | 2.43e-11 | 8.07e-01 | 0.1662 |
| 3801 | KIFC3 | P20T-E | Human | Esophagus | ESCC | 2.06e-13 | 2.97e-01 | 0.1124 |
| 3801 | KIFC3 | P21T-E | Human | Esophagus | ESCC | 1.79e-23 | 4.85e-01 | 0.1617 |
| 3801 | KIFC3 | P22T-E | Human | Esophagus | ESCC | 3.85e-09 | 1.50e-01 | 0.1236 |
| 3801 | KIFC3 | P23T-E | Human | Esophagus | ESCC | 2.60e-08 | 2.89e-01 | 0.108 |
| 3801 | KIFC3 | P24T-E | Human | Esophagus | ESCC | 1.91e-10 | 3.33e-01 | 0.1287 |
| 3801 | KIFC3 | P26T-E | Human | Esophagus | ESCC | 6.96e-19 | 3.22e-01 | 0.1276 |
| 3801 | KIFC3 | P27T-E | Human | Esophagus | ESCC | 7.60e-04 | 6.93e-02 | 0.1055 |
| Page: 1 2 3 4 5 6 |
| Tissue | Expression Dynamics | Abbreviation |
| Esophagus | 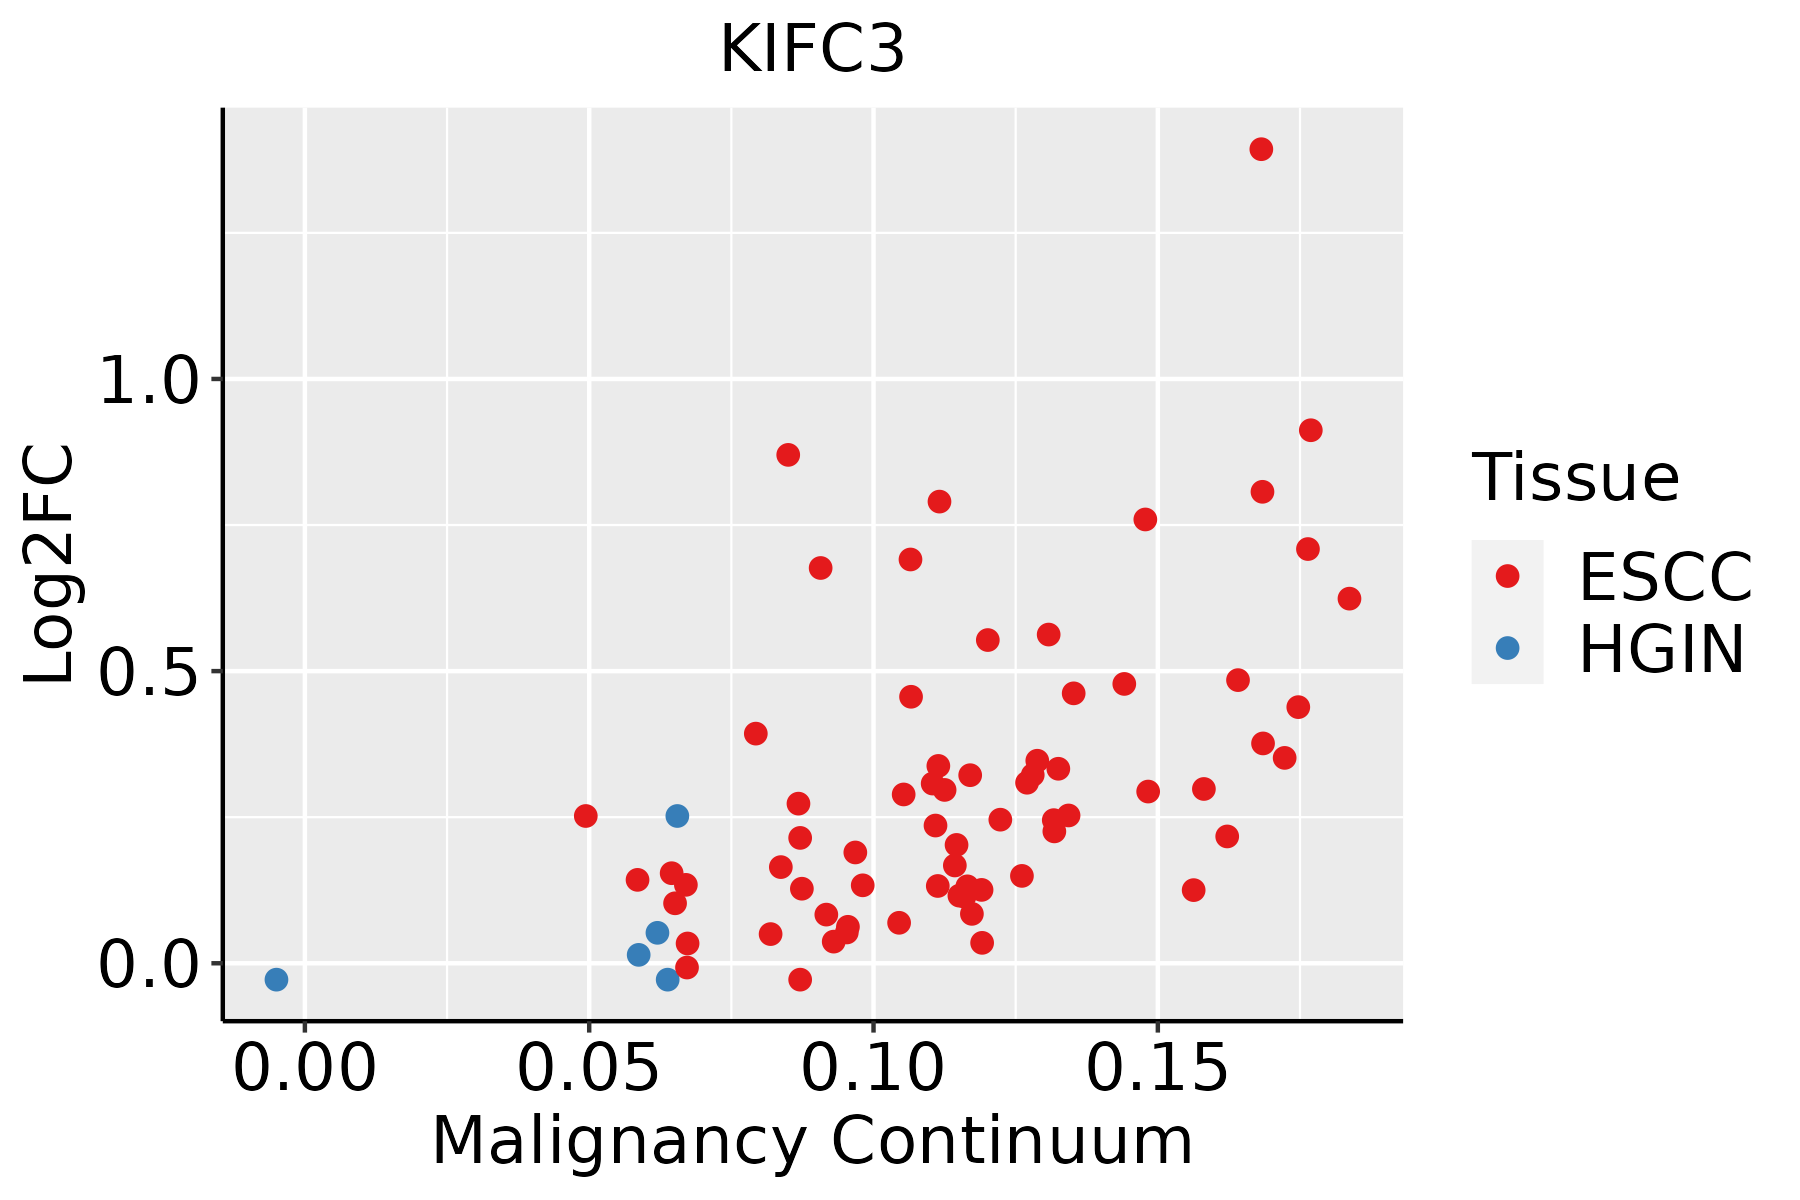 | ESCC: Esophageal squamous cell carcinoma |
| HGIN: High-grade intraepithelial neoplasias | ||
| LGIN: Low-grade intraepithelial neoplasias | ||
| Liver | 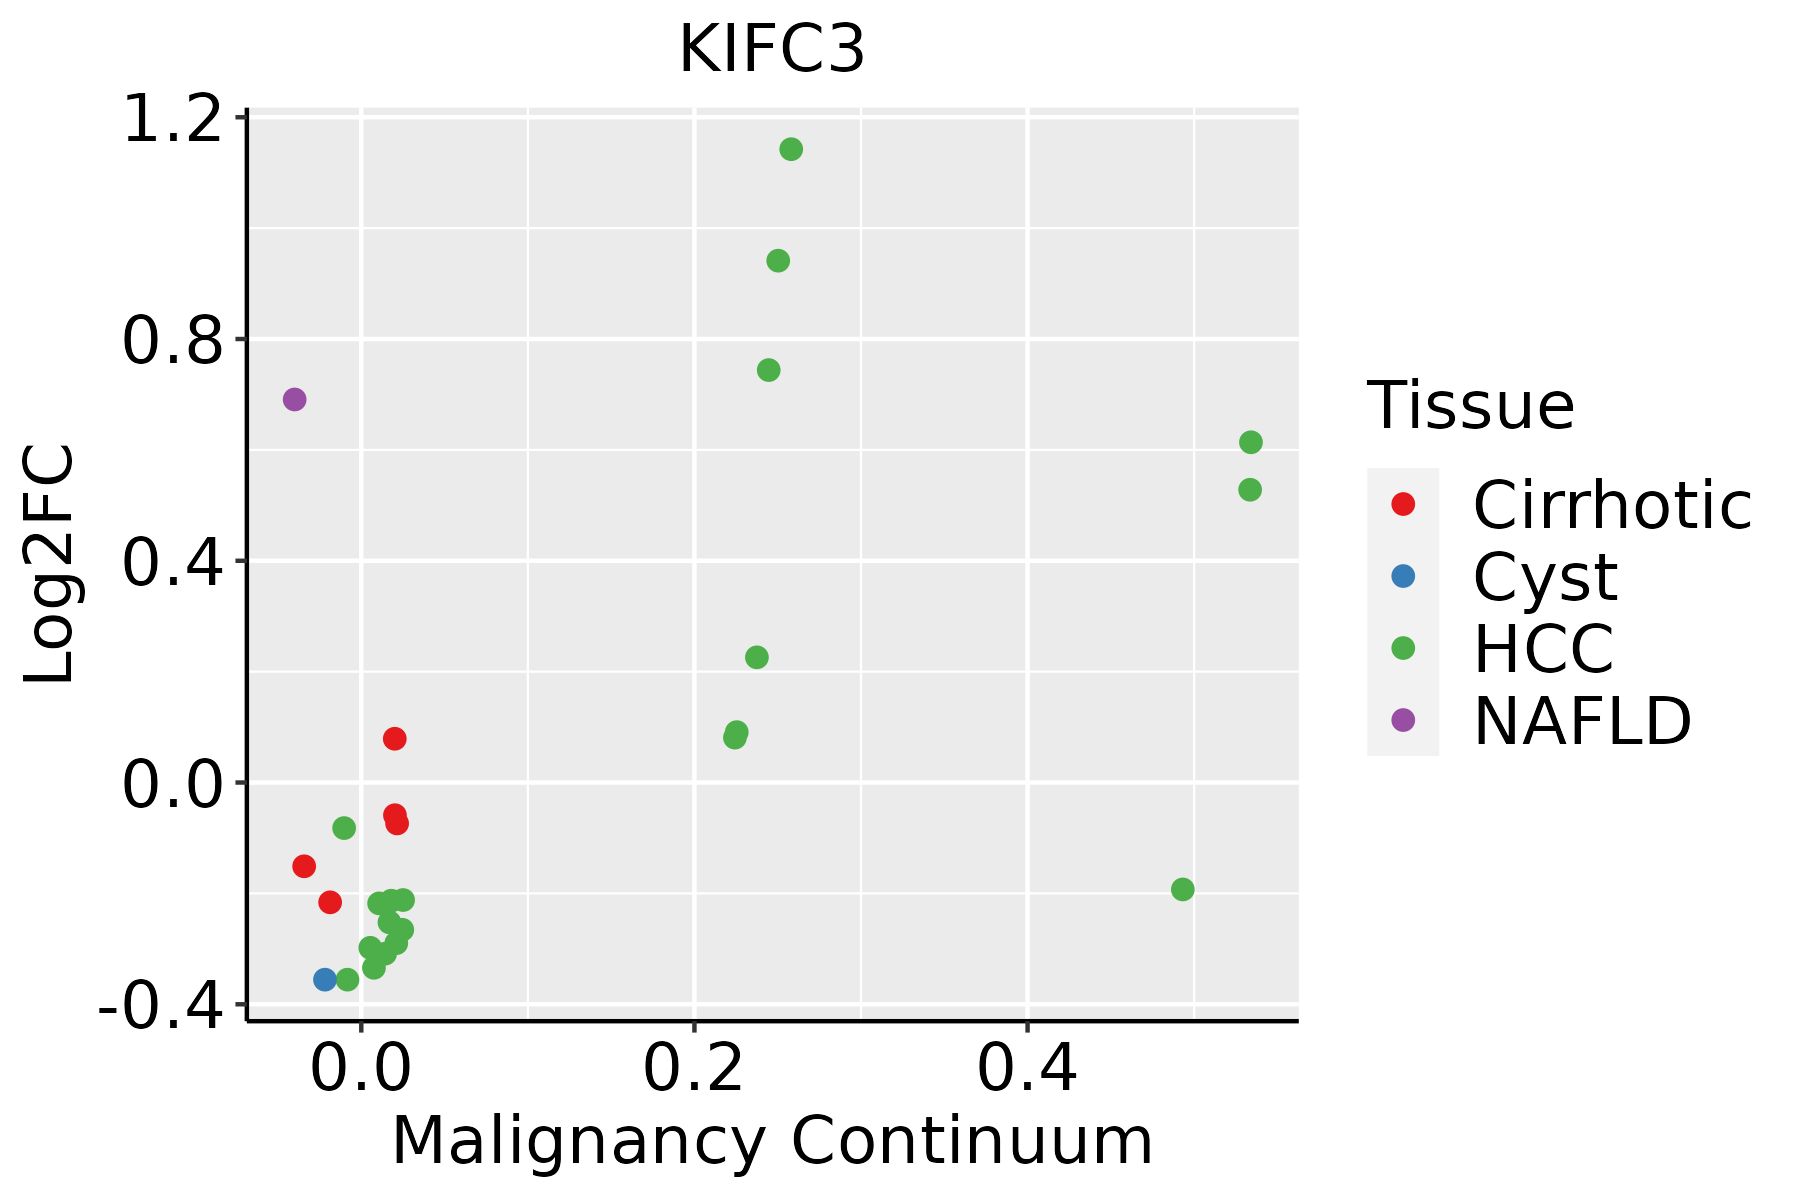 | HCC: Hepatocellular carcinoma |
| NAFLD: Non-alcoholic fatty liver disease | ||
| Lung |  | AAH: Atypical adenomatous hyperplasia |
| AIS: Adenocarcinoma in situ | ||
| IAC: Invasive lung adenocarcinoma | ||
| MIA: Minimally invasive adenocarcinoma | ||
| Oral Cavity |  | EOLP: Erosive Oral lichen planus |
| LP: leukoplakia | ||
| NEOLP: Non-erosive oral lichen planus | ||
| OSCC: Oral squamous cell carcinoma | ||
| Skin | 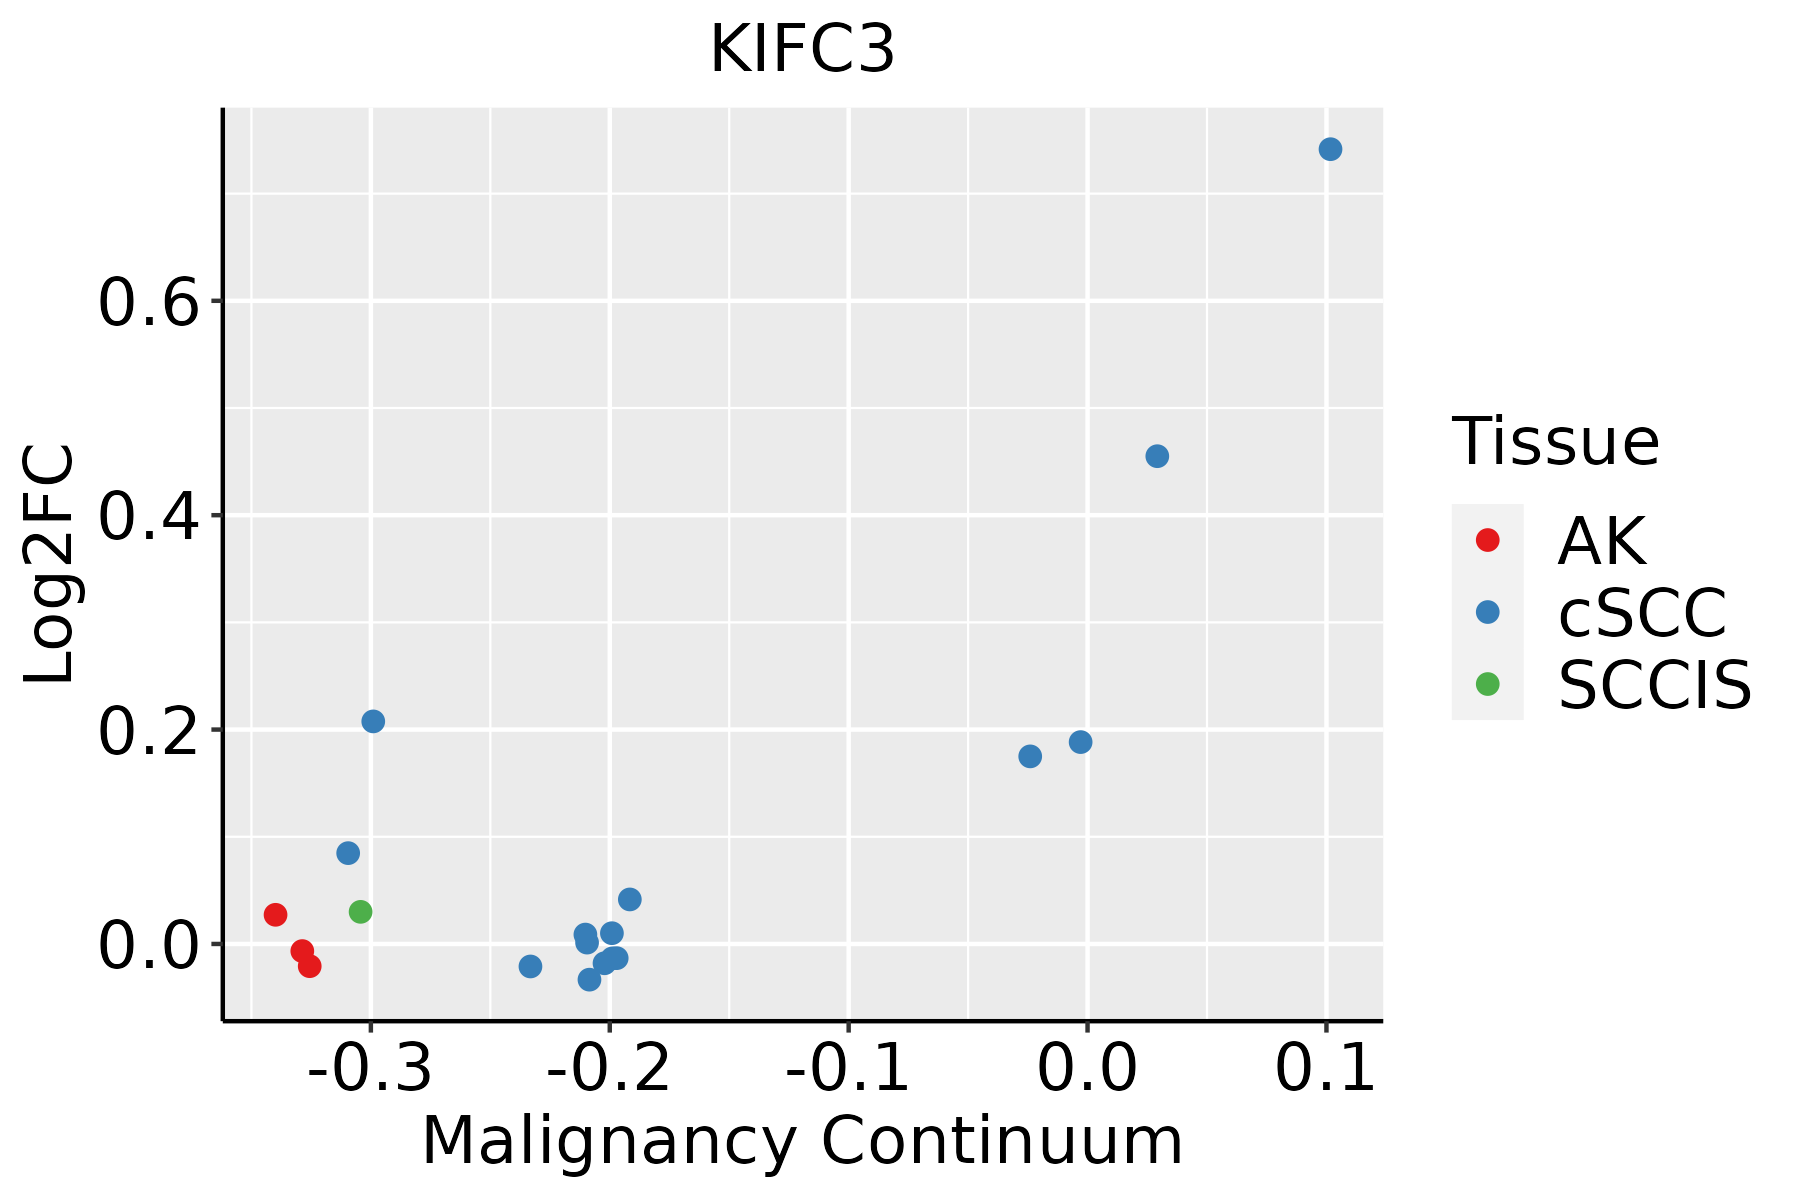 | AK: Actinic keratosis |
| cSCC: Cutaneous squamous cell carcinoma | ||
| SCCIS:squamous cell carcinoma in situ | ||
| Thyroid | 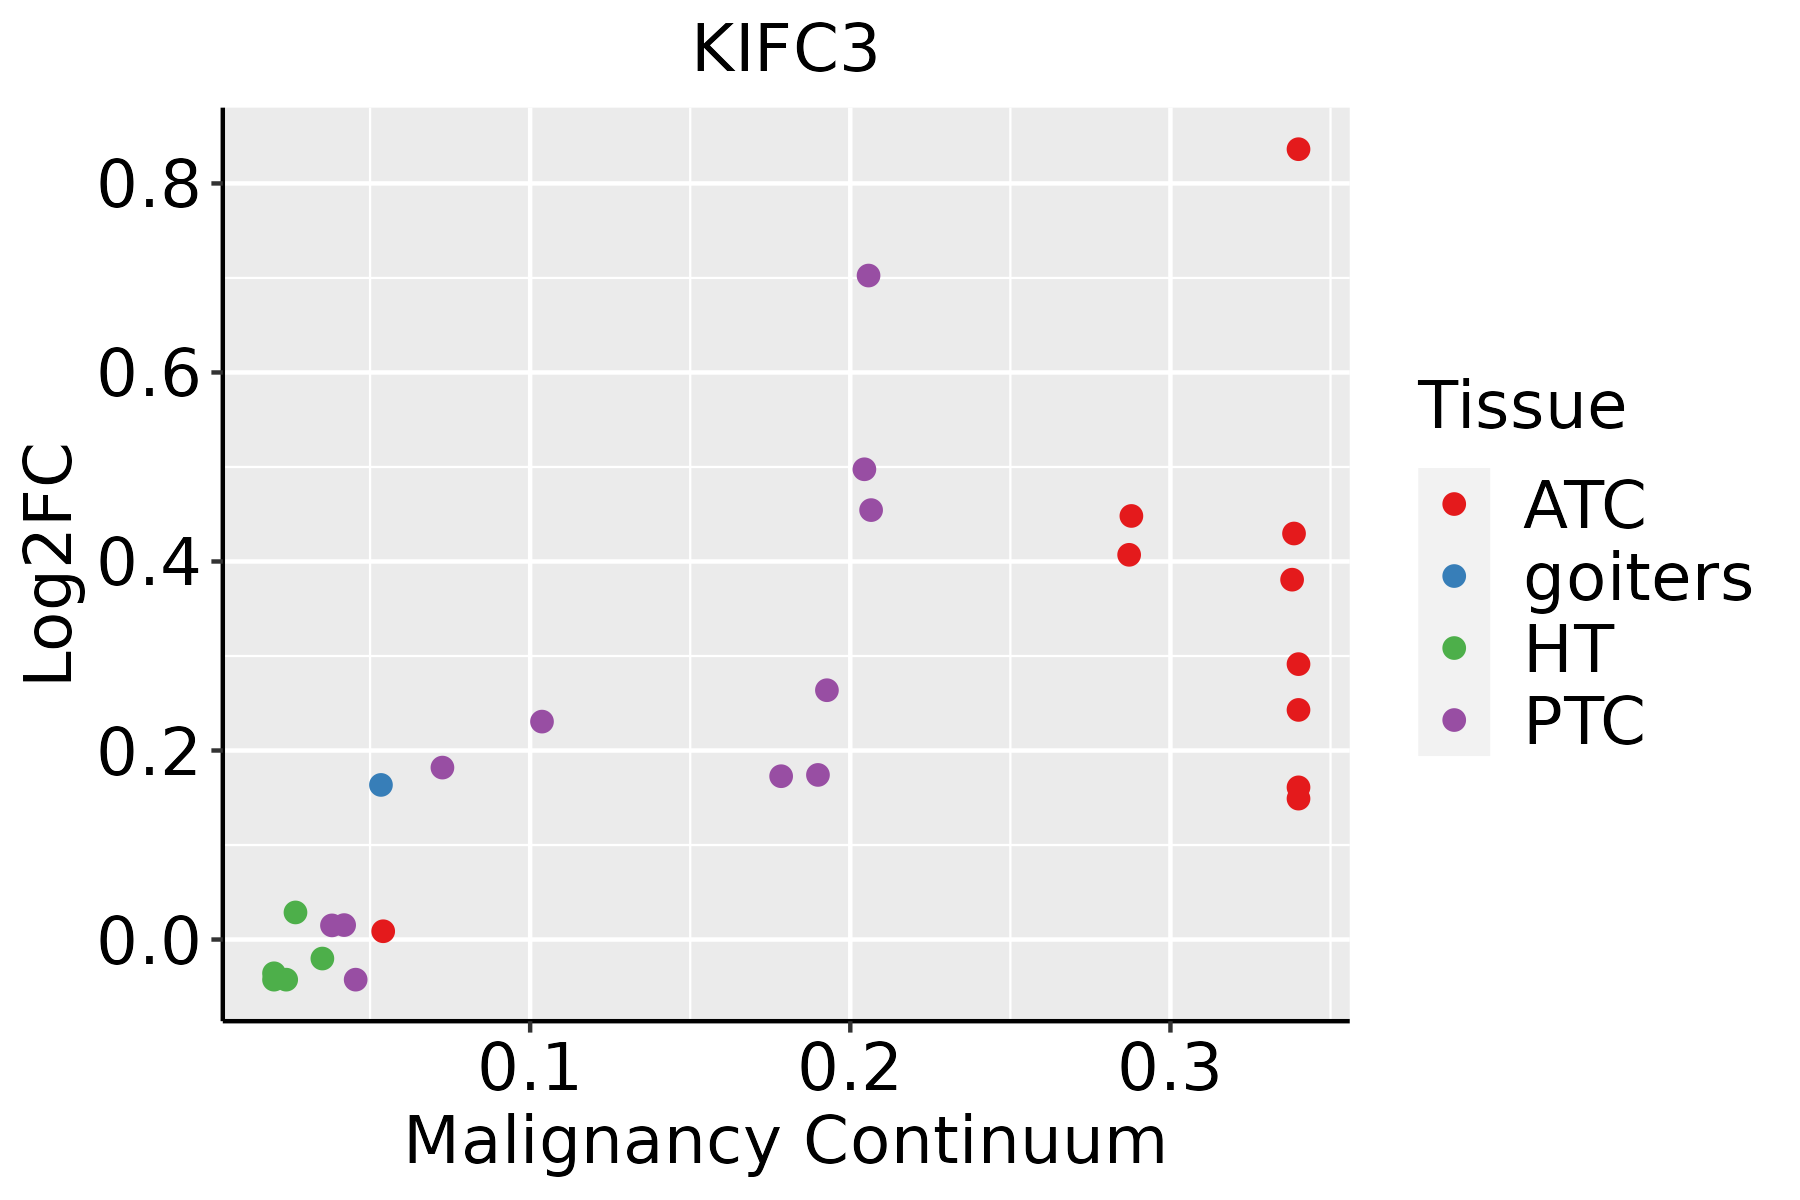 | ATC: Anaplastic thyroid cancer |
| HT: Hashimoto's thyroiditis | ||
| PTC: Papillary thyroid cancer |
| ∗log2FC in expression of this searched gene in stem-like cells from each diseased tissue sample relative to stem-like cells in normal samples in each tissue plotted against the malignancy continuum. Samples are colored based on if they are from different disease stage. |
Top |
Malignant transformation related pathway analysis |
| Find out the enriched GO biological processes and KEGG pathways involved in transition from healthy to precancer to cancer |
| Tissue | Disease Stage | Enriched GO biological Processes |
| Colorectum | AD |  |
| Colorectum | SER |  |
| Colorectum | MSS |  |
| Colorectum | MSI-H |  |
| Colorectum | FAP |  |
| ∗Top 15 enriched GO BP terms are showed in the bar plot of each disease state in each tissue. Each row represents a significant GO biological process which is colored according to the -log10(p.adjust). |
| Page: 1 2 3 4 5 6 7 8 9 |
| GO ID | Tissue | Disease Stage | Description | Gene Ratio | Bg Ratio | pvalue | p.adjust | Count |
| GO:00070308 | Esophagus | ESCC | Golgi organization | 101/8552 | 157/18723 | 1.78e-06 | 2.10e-05 | 101 |
| GO:004521620 | Esophagus | ESCC | cell-cell junction organization | 114/8552 | 200/18723 | 8.04e-04 | 4.16e-03 | 114 |
| GO:0007030 | Liver | NAFLD | Golgi organization | 36/1882 | 157/18723 | 1.76e-06 | 7.68e-05 | 36 |
| GO:00452167 | Liver | NAFLD | cell-cell junction organization | 32/1882 | 200/18723 | 5.53e-03 | 4.23e-02 | 32 |
| GO:00070301 | Liver | Cirrhotic | Golgi organization | 68/4634 | 157/18723 | 2.57e-07 | 6.41e-06 | 68 |
| GO:004521612 | Liver | Cirrhotic | cell-cell junction organization | 70/4634 | 200/18723 | 7.23e-04 | 5.36e-03 | 70 |
| GO:00343324 | Liver | Cirrhotic | adherens junction organization | 20/4634 | 49/18723 | 9.60e-03 | 4.35e-02 | 20 |
| GO:00070302 | Liver | HCC | Golgi organization | 99/7958 | 157/18723 | 1.54e-07 | 2.85e-06 | 99 |
| GO:004521622 | Liver | HCC | cell-cell junction organization | 107/7958 | 200/18723 | 1.06e-03 | 6.11e-03 | 107 |
| GO:003433211 | Liver | HCC | adherens junction organization | 30/7958 | 49/18723 | 6.31e-03 | 2.57e-02 | 30 |
| GO:00452168 | Lung | IAC | cell-cell junction organization | 43/2061 | 200/18723 | 1.21e-05 | 3.64e-04 | 43 |
| GO:00439545 | Lung | IAC | cellular component maintenance | 17/2061 | 61/18723 | 2.24e-04 | 3.89e-03 | 17 |
| GO:00070303 | Lung | IAC | Golgi organization | 32/2061 | 157/18723 | 4.13e-04 | 6.22e-03 | 32 |
| GO:00343325 | Lung | IAC | adherens junction organization | 13/2061 | 49/18723 | 1.95e-03 | 1.97e-02 | 13 |
| GO:00343315 | Lung | IAC | cell junction maintenance | 10/2061 | 35/18723 | 3.52e-03 | 2.98e-02 | 10 |
| GO:004521613 | Lung | AIS | cell-cell junction organization | 41/1849 | 200/18723 | 4.66e-06 | 2.31e-04 | 41 |
| GO:000703011 | Lung | AIS | Golgi organization | 30/1849 | 157/18723 | 3.09e-04 | 5.63e-03 | 30 |
| GO:004395411 | Lung | AIS | cellular component maintenance | 15/1849 | 61/18723 | 6.88e-04 | 1.02e-02 | 15 |
| GO:003433112 | Lung | AIS | cell junction maintenance | 9/1849 | 35/18723 | 5.76e-03 | 4.81e-02 | 9 |
| GO:004521623 | Lung | MIAC | cell-cell junction organization | 26/967 | 200/18723 | 1.38e-05 | 9.86e-04 | 26 |
| Page: 1 2 |
| Pathway ID | Tissue | Disease Stage | Description | Gene Ratio | Bg Ratio | pvalue | p.adjust | qvalue | Count |
| hsa04814 | Lung | MIAC | Motor proteins | 21/507 | 193/8465 | 5.64e-03 | 3.82e-02 | 2.76e-02 | 21 |
| hsa048141 | Lung | MIAC | Motor proteins | 21/507 | 193/8465 | 5.64e-03 | 3.82e-02 | 2.76e-02 | 21 |
| Page: 1 |
Top |
Cell-cell communication analysis |
| Identification of potential cell-cell interactions between two cell types and their ligand-receptor pairs for different disease states |
| Ligand | Receptor | LRpair | Pathway | Tissue | Disease Stage |
| Page: 1 |
Top |
Single-cell gene regulatory network inference analysis |
| Find out the significant the regulons (TFs) and the target genes of each regulon across cell types for different disease states |
| TF | Cell Type | Tissue | Disease Stage | Target Gene | RSS | Regulon Activity |
| ∗The dot plots of a searched regulon are shown for all cell subpopulations in each disease state of each tissue based on the regulon specific score inferred using pySCENIC and by calculating the average expression. |
| Page: 1 |
Top |
Somatic mutation of malignant transformation related genes |
| Annotation of somatic variants for genes involved in malignant transformation |
| Hugo Symbol | Variant Class | Variant Classification | dbSNP RS | HGVSc | HGVSp | HGVSp Short | SWISSPROT | BIOTYPE | SIFT | PolyPhen | Tumor Sample Barcode | Tissue | Histology | Sex | Age | Stage | Therapy Types | Drugs | Outcome |
| KIFC3 | SNV | Missense_Mutation | novel | c.676N>C | p.Glu226Gln | p.E226Q | Q9BVG8 | protein_coding | tolerated(0.22) | benign(0.186) | TCGA-AC-A5XS-01 | Breast | breast invasive carcinoma | Female | >=65 | I/II | Hormone Therapy | femara | SD |
| KIFC3 | SNV | Missense_Mutation | c.2389C>T | p.Arg797Cys | p.R797C | Q9BVG8 | protein_coding | deleterious(0) | probably_damaging(0.998) | TCGA-AN-A046-01 | Breast | breast invasive carcinoma | Female | >=65 | I/II | Unknown | Unknown | SD | |
| KIFC3 | SNV | Missense_Mutation | novel | c.896N>A | p.Ala299Asp | p.A299D | Q9BVG8 | protein_coding | tolerated(0.1) | benign(0.029) | TCGA-C8-A274-01 | Breast | breast invasive carcinoma | Female | <65 | I/II | Hormone Therapy | tamoxiphen | SD |
| KIFC3 | SNV | Missense_Mutation | c.1964G>A | p.Arg655His | p.R655H | Q9BVG8 | protein_coding | deleterious(0) | probably_damaging(0.983) | TCGA-D8-A1XK-01 | Breast | breast invasive carcinoma | Female | <65 | I/II | Chemotherapy | doxorubicine+cyclophosphamide | SD | |
| KIFC3 | SNV | Missense_Mutation | rs782343536 | c.2330C>T | p.Thr777Met | p.T777M | Q9BVG8 | protein_coding | deleterious(0) | probably_damaging(1) | TCGA-E2-A154-01 | Breast | breast invasive carcinoma | Female | >=65 | I/II | Hormone Therapy | arimidex | SD |
| KIFC3 | insertion | Frame_Shift_Ins | novel | c.449_450insTACTGAGCCTTTTCCTGGTCTGGCC | p.Gly151ThrfsTer24 | p.G151Tfs*24 | Q9BVG8 | protein_coding | TCGA-A2-A0CQ-01 | Breast | breast invasive carcinoma | Female | <65 | I/II | Chemotherapy | adriamycin | SD | ||
| KIFC3 | insertion | Frame_Shift_Ins | novel | c.1021dupT | p.Ser341PhefsTer26 | p.S341Ffs*26 | Q9BVG8 | protein_coding | TCGA-BH-A1FN-01 | Breast | breast invasive carcinoma | Female | <65 | I/II | Unknown | Unknown | PD | ||
| KIFC3 | deletion | Frame_Shift_Del | novel | c.2182delG | p.Asp728ThrfsTer83 | p.D728Tfs*83 | Q9BVG8 | protein_coding | TCGA-EW-A2FV-01 | Breast | breast invasive carcinoma | Female | <65 | III/IV | Chemotherapy | docetaxel | SD | ||
| KIFC3 | SNV | Missense_Mutation | rs782764063 | c.547C>T | p.Arg183Cys | p.R183C | Q9BVG8 | protein_coding | tolerated(0.05) | benign(0) | TCGA-2W-A8YY-01 | Cervix | cervical & endocervical cancer | Female | <65 | I/II | Chemotherapy | cisplatin | CR |
| KIFC3 | SNV | Missense_Mutation | c.944T>G | p.Leu315Arg | p.L315R | Q9BVG8 | protein_coding | deleterious(0.02) | possibly_damaging(0.869) | TCGA-A6-3809-01 | Colorectum | colon adenocarcinoma | Female | >=65 | I/II | Unknown | Unknown | SD |
| Page: 1 2 3 4 5 6 7 8 |
Top |
Related drugs of malignant transformation related genes |
| Identification of chemicals and drugs interact with genes involved in malignant transfromation |
| (DGIdb 4.0) |
| Entrez ID | Symbol | Category | Interaction Types | Drug Claim Name | Drug Name | PMIDs |
| Page: 1 |

Copyright 2023-Present -The University of Texas Health Science Center at Houston |