
|
|||||
|
 | |
| |
| |
| |
| |
| |
|
Gene: KIFC2 |
Gene summary for KIFC2 |
| Gene information | Species | Human | Gene symbol | KIFC2 | Gene ID | 90990 |
| Gene name | kinesin family member C2 | |
| Gene Alias | KIFC2 | |
| Cytomap | 8q24.3 | |
| Gene Type | protein-coding | GO ID | GO:0000226 | UniProtAcc | Q96AC6 |
Top |
Malignant transformation analysis |
| Identification of the aberrant gene expression in precancerous and cancerous lesions by comparing the gene expression of stem-like cells in diseased tissues with normal stem cells |
| Entrez ID | Symbol | Replicates | Species | Organ | Tissue | Adj P-value | Log2FC | Malignancy |
| 90990 | KIFC2 | LZE4T | Human | Esophagus | ESCC | 1.38e-03 | 1.07e-01 | 0.0811 |
| 90990 | KIFC2 | LZE24T | Human | Esophagus | ESCC | 1.27e-05 | 2.37e-01 | 0.0596 |
| 90990 | KIFC2 | P4T-E | Human | Esophagus | ESCC | 2.20e-02 | 7.36e-02 | 0.1323 |
| 90990 | KIFC2 | P5T-E | Human | Esophagus | ESCC | 8.52e-08 | 1.46e-01 | 0.1327 |
| 90990 | KIFC2 | P8T-E | Human | Esophagus | ESCC | 1.21e-02 | 1.00e-01 | 0.0889 |
| 90990 | KIFC2 | P9T-E | Human | Esophagus | ESCC | 2.94e-11 | 2.12e-01 | 0.1131 |
| 90990 | KIFC2 | P10T-E | Human | Esophagus | ESCC | 1.03e-11 | 1.33e-01 | 0.116 |
| 90990 | KIFC2 | P12T-E | Human | Esophagus | ESCC | 1.42e-22 | 4.01e-01 | 0.1122 |
| 90990 | KIFC2 | P15T-E | Human | Esophagus | ESCC | 1.01e-10 | 3.01e-01 | 0.1149 |
| 90990 | KIFC2 | P16T-E | Human | Esophagus | ESCC | 1.73e-04 | 1.04e-01 | 0.1153 |
| 90990 | KIFC2 | P20T-E | Human | Esophagus | ESCC | 1.79e-09 | 2.09e-01 | 0.1124 |
| 90990 | KIFC2 | P21T-E | Human | Esophagus | ESCC | 1.59e-07 | 1.67e-01 | 0.1617 |
| 90990 | KIFC2 | P22T-E | Human | Esophagus | ESCC | 2.99e-03 | 7.59e-02 | 0.1236 |
| 90990 | KIFC2 | P23T-E | Human | Esophagus | ESCC | 4.59e-05 | 1.14e-01 | 0.108 |
| 90990 | KIFC2 | P26T-E | Human | Esophagus | ESCC | 1.84e-34 | 6.10e-01 | 0.1276 |
| 90990 | KIFC2 | P27T-E | Human | Esophagus | ESCC | 1.13e-09 | 1.80e-01 | 0.1055 |
| 90990 | KIFC2 | P28T-E | Human | Esophagus | ESCC | 2.29e-27 | 4.91e-01 | 0.1149 |
| 90990 | KIFC2 | P30T-E | Human | Esophagus | ESCC | 2.43e-05 | 2.33e-01 | 0.137 |
| 90990 | KIFC2 | P31T-E | Human | Esophagus | ESCC | 5.39e-06 | 8.69e-02 | 0.1251 |
| 90990 | KIFC2 | P36T-E | Human | Esophagus | ESCC | 5.77e-04 | 1.04e-01 | 0.1187 |
| Page: 1 2 3 4 |
| Tissue | Expression Dynamics | Abbreviation |
| Esophagus |  | ESCC: Esophageal squamous cell carcinoma |
| HGIN: High-grade intraepithelial neoplasias | ||
| LGIN: Low-grade intraepithelial neoplasias | ||
| Liver | 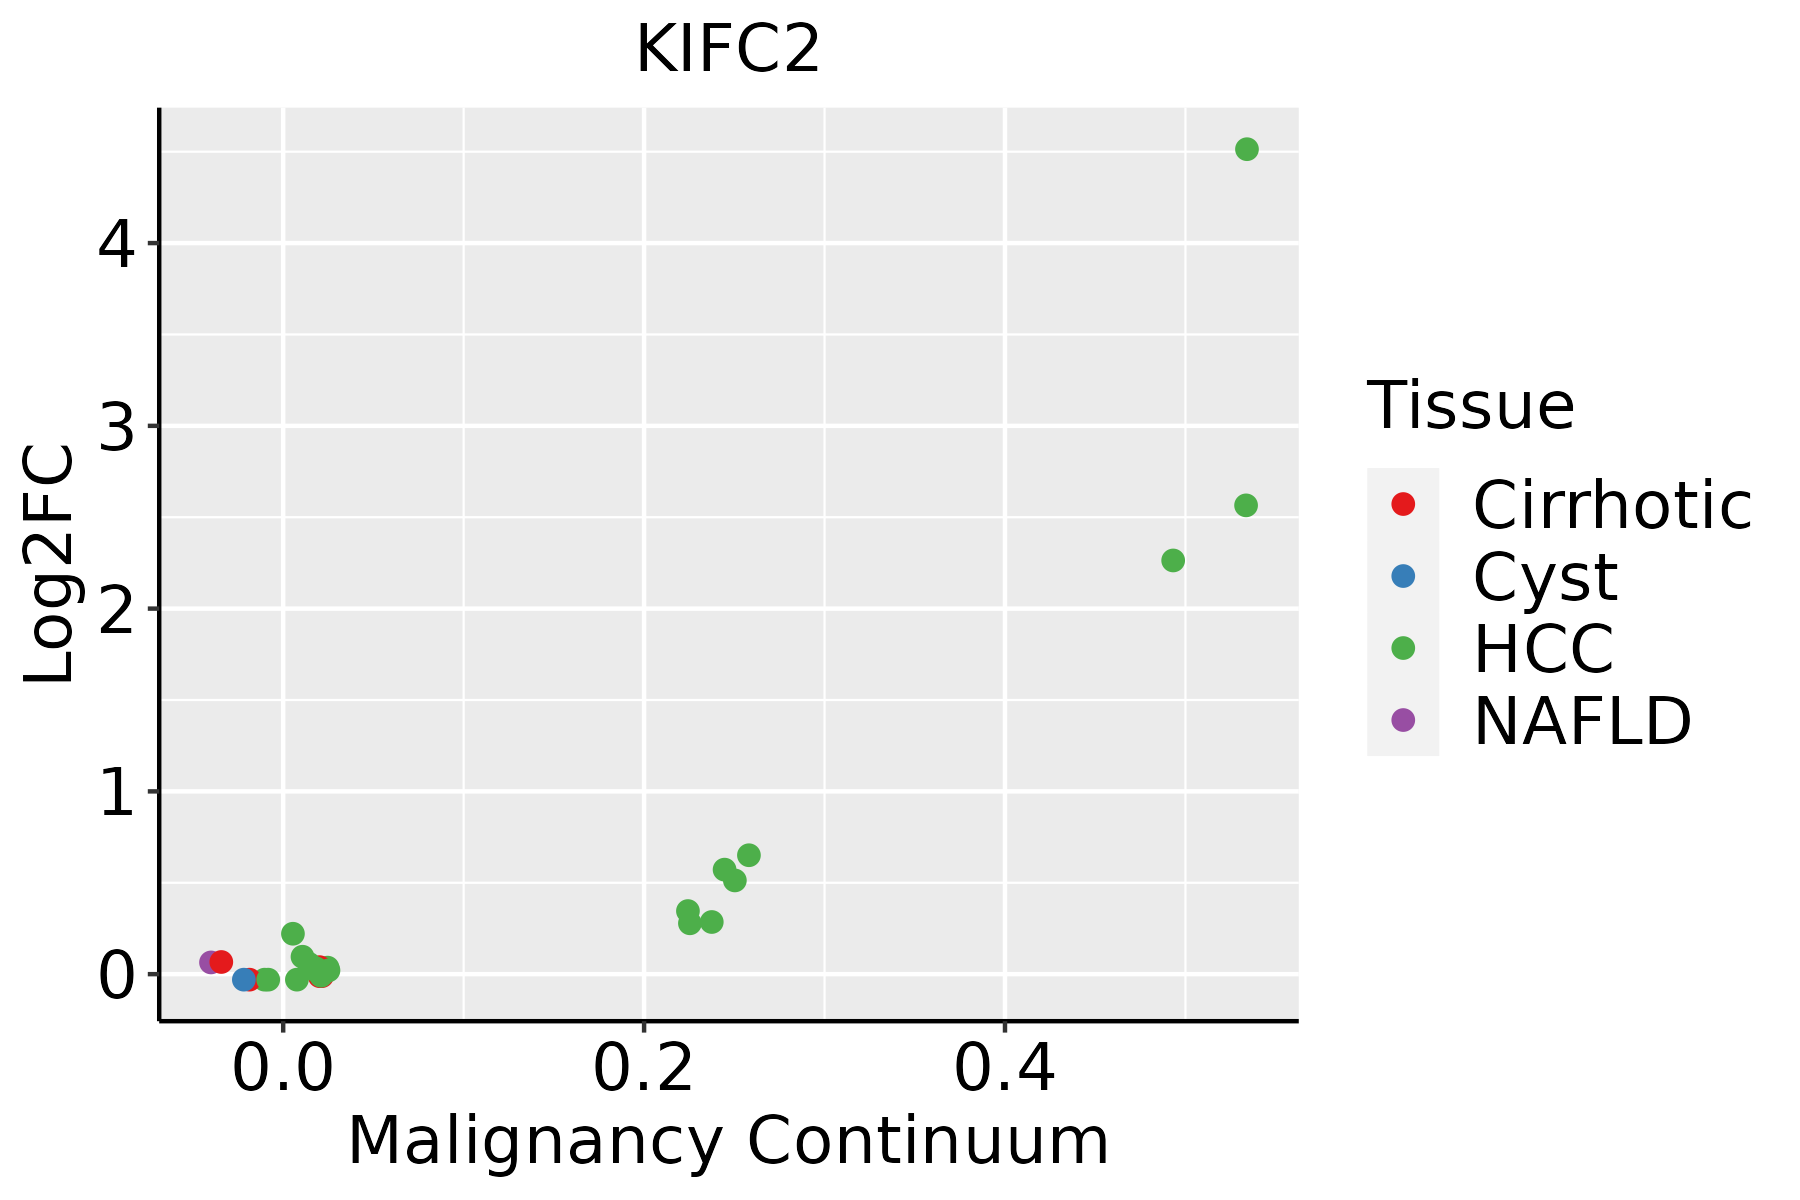 | HCC: Hepatocellular carcinoma |
| NAFLD: Non-alcoholic fatty liver disease | ||
| Oral Cavity |  | EOLP: Erosive Oral lichen planus |
| LP: leukoplakia | ||
| NEOLP: Non-erosive oral lichen planus | ||
| OSCC: Oral squamous cell carcinoma |
| ∗log2FC in expression of this searched gene in stem-like cells from each diseased tissue sample relative to stem-like cells in normal samples in each tissue plotted against the malignancy continuum. Samples are colored based on if they are from different disease stage. |
Top |
Malignant transformation related pathway analysis |
| Find out the enriched GO biological processes and KEGG pathways involved in transition from healthy to precancer to cancer |
| Tissue | Disease Stage | Enriched GO biological Processes |
| Colorectum | AD |  |
| Colorectum | SER |  |
| Colorectum | MSS |  |
| Colorectum | MSI-H |  |
| Colorectum | FAP |  |
| ∗Top 15 enriched GO BP terms are showed in the bar plot of each disease state in each tissue. Each row represents a significant GO biological process which is colored according to the -log10(p.adjust). |
| Page: 1 2 3 4 5 6 7 8 9 |
| GO ID | Tissue | Disease Stage | Description | Gene Ratio | Bg Ratio | pvalue | p.adjust | Count |
| GO:014001414 | Esophagus | ESCC | mitotic nuclear division | 218/8552 | 287/18723 | 6.17e-26 | 1.78e-23 | 218 |
| GO:190285015 | Esophagus | ESCC | microtubule cytoskeleton organization involved in mitosis | 116/8552 | 147/18723 | 1.25e-16 | 9.91e-15 | 116 |
| GO:000705214 | Esophagus | ESCC | mitotic spindle organization | 97/8552 | 120/18723 | 2.17e-15 | 1.33e-13 | 97 |
| GO:000705114 | Esophagus | ESCC | spindle organization | 134/8552 | 184/18723 | 5.70e-14 | 2.87e-12 | 134 |
| GO:00482853 | Esophagus | ESCC | organelle fission | 301/8552 | 488/18723 | 4.64e-13 | 2.12e-11 | 301 |
| GO:00002802 | Esophagus | ESCC | nuclear division | 270/8552 | 439/18723 | 1.17e-11 | 4.24e-10 | 270 |
| GO:00512256 | Esophagus | ESCC | spindle assembly | 85/8552 | 117/18723 | 2.72e-09 | 5.98e-08 | 85 |
| GO:009030715 | Esophagus | ESCC | mitotic spindle assembly | 52/8552 | 65/18723 | 1.41e-08 | 2.77e-07 | 52 |
| GO:014001411 | Liver | HCC | mitotic nuclear division | 174/7958 | 287/18723 | 3.74e-10 | 1.23e-08 | 174 |
| GO:000705111 | Liver | HCC | spindle organization | 116/7958 | 184/18723 | 1.40e-08 | 3.40e-07 | 116 |
| GO:000705211 | Liver | HCC | mitotic spindle organization | 80/7958 | 120/18723 | 7.43e-08 | 1.50e-06 | 80 |
| GO:190285011 | Liver | HCC | microtubule cytoskeleton organization involved in mitosis | 93/7958 | 147/18723 | 2.91e-07 | 5.09e-06 | 93 |
| GO:005122511 | Liver | HCC | spindle assembly | 75/7958 | 117/18723 | 1.92e-06 | 2.67e-05 | 75 |
| GO:0048285 | Liver | HCC | organelle fission | 254/7958 | 488/18723 | 1.07e-05 | 1.23e-04 | 254 |
| GO:009030711 | Liver | HCC | mitotic spindle assembly | 42/7958 | 65/18723 | 2.63e-04 | 1.94e-03 | 42 |
| GO:0000280 | Liver | HCC | nuclear division | 220/7958 | 439/18723 | 6.90e-04 | 4.25e-03 | 220 |
| GO:01400145 | Oral cavity | OSCC | mitotic nuclear division | 191/7305 | 287/18723 | 1.99e-21 | 3.70e-19 | 191 |
| GO:00070526 | Oral cavity | OSCC | mitotic spindle organization | 85/7305 | 120/18723 | 1.44e-12 | 6.23e-11 | 85 |
| GO:19028506 | Oral cavity | OSCC | microtubule cytoskeleton organization involved in mitosis | 99/7305 | 147/18723 | 2.94e-12 | 1.18e-10 | 99 |
| GO:00482852 | Oral cavity | OSCC | organelle fission | 265/7305 | 488/18723 | 3.22e-12 | 1.27e-10 | 265 |
| Page: 1 2 |
| Pathway ID | Tissue | Disease Stage | Description | Gene Ratio | Bg Ratio | pvalue | p.adjust | qvalue | Count |
| Page: 1 |
Top |
Cell-cell communication analysis |
| Identification of potential cell-cell interactions between two cell types and their ligand-receptor pairs for different disease states |
| Ligand | Receptor | LRpair | Pathway | Tissue | Disease Stage |
| Page: 1 |
Top |
Single-cell gene regulatory network inference analysis |
| Find out the significant the regulons (TFs) and the target genes of each regulon across cell types for different disease states |
| TF | Cell Type | Tissue | Disease Stage | Target Gene | RSS | Regulon Activity |
| ∗The dot plots of a searched regulon are shown for all cell subpopulations in each disease state of each tissue based on the regulon specific score inferred using pySCENIC and by calculating the average expression. |
| Page: 1 |
Top |
Somatic mutation of malignant transformation related genes |
| Annotation of somatic variants for genes involved in malignant transformation |
| Hugo Symbol | Variant Class | Variant Classification | dbSNP RS | HGVSc | HGVSp | HGVSp Short | SWISSPROT | BIOTYPE | SIFT | PolyPhen | Tumor Sample Barcode | Tissue | Histology | Sex | Age | Stage | Therapy Types | Drugs | Outcome |
| KIFC2 | SNV | Missense_Mutation | novel | c.838N>G | p.Gln280Glu | p.Q280E | Q96AC6 | protein_coding | tolerated(0.73) | benign(0.018) | TCGA-A7-A6VV-01 | Breast | breast invasive carcinoma | Female | <65 | I/II | Chemotherapy | cyclophosphamide | CR |
| KIFC2 | SNV | Missense_Mutation | c.445N>T | p.Arg149Trp | p.R149W | Q96AC6 | protein_coding | deleterious_low_confidence(0.02) | possibly_damaging(0.544) | TCGA-C8-A130-01 | Breast | breast invasive carcinoma | Female | <65 | III/IV | Unknown | Unknown | SD | |
| KIFC2 | insertion | In_Frame_Ins | novel | c.1683_1684insTCTTCAAACAGA | p.Val561_Ala562insSerSerAsnArg | p.V561_A562insSSNR | Q96AC6 | protein_coding | TCGA-AO-A0JB-01 | Breast | breast invasive carcinoma | Female | <65 | III/IV | Chemotherapy | cyclophosphamide | SD | ||
| KIFC2 | deletion | Frame_Shift_Del | novel | c.654delN | p.Glu219SerfsTer21 | p.E219Sfs*21 | Q96AC6 | protein_coding | TCGA-D8-A27V-01 | Breast | breast invasive carcinoma | Female | <65 | I/II | Hormone Therapy | tamoxiphen | SD | ||
| KIFC2 | deletion | Frame_Shift_Del | novel | c.964delN | p.Cys322AlafsTer44 | p.C322Afs*44 | Q96AC6 | protein_coding | TCGA-D8-A27V-01 | Breast | breast invasive carcinoma | Female | <65 | I/II | Hormone Therapy | tamoxiphen | SD | ||
| KIFC2 | SNV | Missense_Mutation | c.1825N>T | p.Arg609Cys | p.R609C | Q96AC6 | protein_coding | deleterious(0.05) | probably_damaging(0.938) | TCGA-C5-A1BL-01 | Cervix | cervical & endocervical cancer | Female | <65 | I/II | Unknown | Unknown | SD | |
| KIFC2 | SNV | Missense_Mutation | rs368447948 | c.1105N>T | p.Arg369Trp | p.R369W | Q96AC6 | protein_coding | deleterious(0) | possibly_damaging(0.446) | TCGA-C5-A7CG-01 | Cervix | cervical & endocervical cancer | Female | <65 | I/II | Unknown | Unknown | SD |
| KIFC2 | SNV | Missense_Mutation | novel | c.1216N>A | p.Leu406Ile | p.L406I | Q96AC6 | protein_coding | deleterious(0.01) | possibly_damaging(0.765) | TCGA-C5-A7UI-01 | Cervix | cervical & endocervical cancer | Female | <65 | I/II | Unknown | Unknown | SD |
| KIFC2 | deletion | Frame_Shift_Del | novel | c.1086_1092delNNNNNNN | p.Gln362HisfsTer2 | p.Q362Hfs*2 | Q96AC6 | protein_coding | TCGA-DS-A1OB-01 | Cervix | cervical & endocervical cancer | Female | <65 | I/II | Chemotherapy | carboplatin | PD | ||
| KIFC2 | SNV | Missense_Mutation | rs768022702 | c.2435N>T | p.Pro812Leu | p.P812L | Q96AC6 | protein_coding | tolerated_low_confidence(1) | benign(0) | TCGA-5M-AAT6-01 | Colorectum | colon adenocarcinoma | Female | <65 | III/IV | Unknown | Unknown | PD |
| Page: 1 2 3 4 5 6 7 |
Top |
Related drugs of malignant transformation related genes |
| Identification of chemicals and drugs interact with genes involved in malignant transfromation |
| (DGIdb 4.0) |
| Entrez ID | Symbol | Category | Interaction Types | Drug Claim Name | Drug Name | PMIDs |
| Page: 1 |

Copyright 2023-Present -The University of Texas Health Science Center at Houston |