Schematic overview of the cellular and molecular mechanisms involved in the cancer progression, including the proposed cellular and molecular mechanisms in cancer cells trajectory. AT1: alveolar type 1 cells; AT2: alveolar type 2 cells; AAH: atypical adenomatous hyperplasia; AIS: adenocarcinoma in situ; MIA: minimally invasive adenocarcinoma; IA: invasive adenocarcinoma; EMT: epithelial-mesenchymal transition

Home

Download

Statistics

Help

Contact

Center for Computational Systems Medicine
leaf

Gene summary

leaf

Malignant transformation analysis

leaf

Malignant transformation related pathway analysis

leaf

Cell-cell communication analysis

leaf

Single-cell gene regulatory network inference analysis

leaf

Somatic mutation of malignant transformation related genes

leaf

Related drugs of malignant transformation related genes

Gene: KIFC1

Gene summary for KIFC1

check button Gene summary.

Gene informationSpeciesHuman
Gene symbol

KIFC1

Gene ID

3833

Gene namekinesin family member C1
Gene AliasHSET
Cytomap6p21.32
Gene Typeprotein-coding
GO ID

GO:0000003

UniProtAcc

A0A024RCS7


Top

Malignant transformation analysis

check button Identification of the aberrant gene expression in precancerous and cancerous lesions by comparing the gene expression of stem-like cells in diseased tissues with normal stem cells
check button Malignant transformation involving gene list.
Entrez IDSymbolReplicatesSpeciesOrganTissueAdj P-valueLog2FCMalignancy
3833KIFC1LZE21THumanEsophagusESCC6.52e-032.91e-010.0655
3833KIFC1P1T-EHumanEsophagusESCC2.97e-022.69e-010.0875
3833KIFC1P2T-EHumanEsophagusESCC6.44e-095.86e-010.1177
3833KIFC1P4T-EHumanEsophagusESCC1.78e-103.20e-010.1323
3833KIFC1P5T-EHumanEsophagusESCC1.76e-122.97e-010.1327
3833KIFC1P9T-EHumanEsophagusESCC5.23e-051.74e-010.1131
3833KIFC1P10T-EHumanEsophagusESCC1.00e-042.29e-010.116
3833KIFC1P15T-EHumanEsophagusESCC8.45e-041.44e-010.1149
3833KIFC1P16T-EHumanEsophagusESCC8.84e-051.52e-010.1153
3833KIFC1P17T-EHumanEsophagusESCC9.15e-126.37e-010.1278
3833KIFC1P20T-EHumanEsophagusESCC2.18e-031.45e-010.1124
3833KIFC1P21T-EHumanEsophagusESCC2.05e-072.80e-010.1617
3833KIFC1P23T-EHumanEsophagusESCC9.87e-031.63e-010.108
3833KIFC1P24T-EHumanEsophagusESCC6.56e-154.97e-010.1287
3833KIFC1P26T-EHumanEsophagusESCC1.66e-021.34e-010.1276
3833KIFC1P27T-EHumanEsophagusESCC4.17e-052.02e-010.1055
3833KIFC1P28T-EHumanEsophagusESCC4.12e-112.34e-010.1149
3833KIFC1P30T-EHumanEsophagusESCC7.79e-074.30e-010.137
3833KIFC1P31T-EHumanEsophagusESCC1.97e-103.17e-010.1251
3833KIFC1P32T-EHumanEsophagusESCC8.84e-051.54e-010.1666
Page: 1 2 3 

check button Transcriptomic changes along malignancy continuum.
TissueExpression DynamicsAbbreviation
EsophagusThe image shows the transcriptomic changes along malignancy continuum.log2FC in expression of this searched gene in stem-like cells from each diseased tissue sample relative to stem-like cells in normal samples in each tissue plotted against the malignancy continuum. Samples are colored based on if they are from different disease stage.
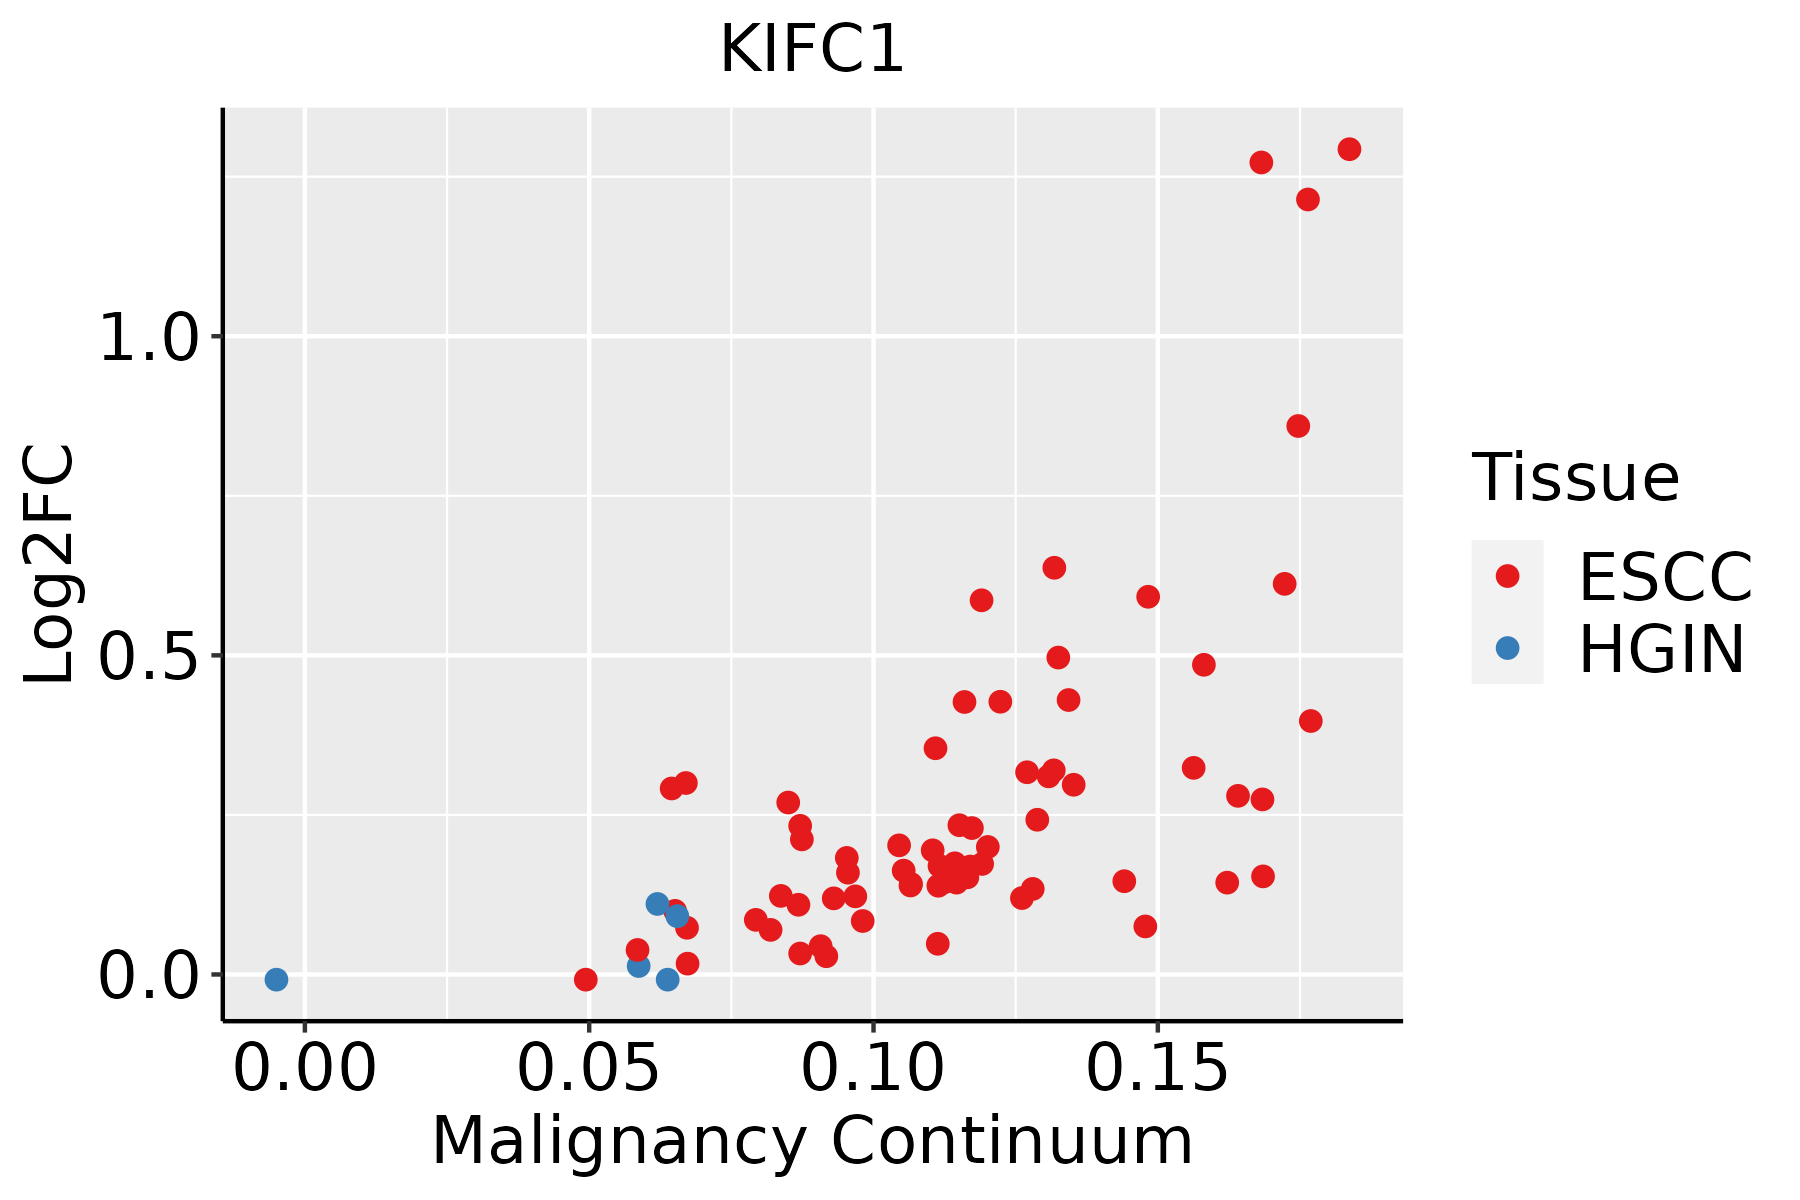
ESCC: Esophageal squamous cell carcinoma
HGIN: High-grade intraepithelial neoplasias
LGIN: Low-grade intraepithelial neoplasias
Oral CavityThe image shows the transcriptomic changes along malignancy continuum.log2FC in expression of this searched gene in stem-like cells from each diseased tissue sample relative to stem-like cells in normal samples in each tissue plotted against the malignancy continuum. Samples are colored based on if they are from different disease stage.
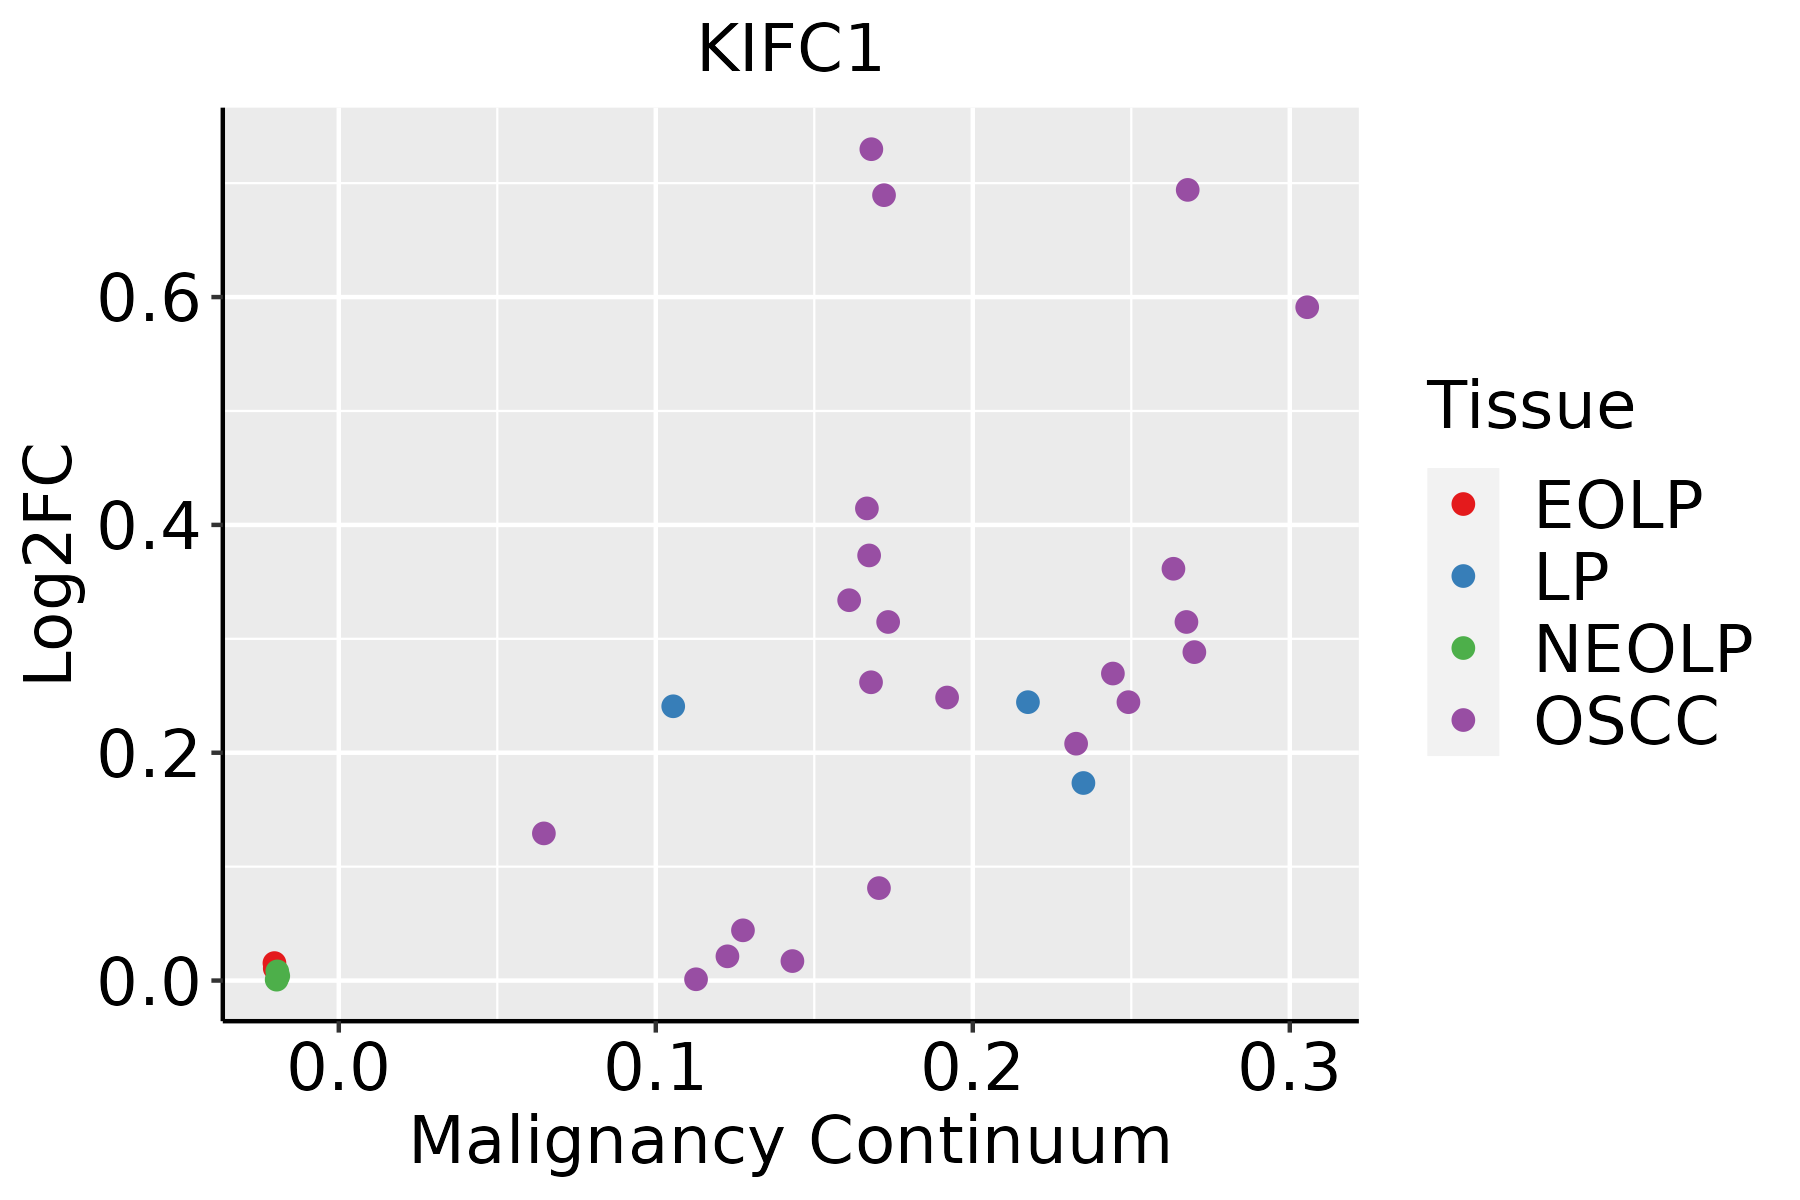
EOLP: Erosive Oral lichen planus
LP: leukoplakia
NEOLP: Non-erosive oral lichen planus
OSCC: Oral squamous cell carcinoma
SkinThe image shows the transcriptomic changes along malignancy continuum.log2FC in expression of this searched gene in stem-like cells from each diseased tissue sample relative to stem-like cells in normal samples in each tissue plotted against the malignancy continuum. Samples are colored based on if they are from different disease stage.
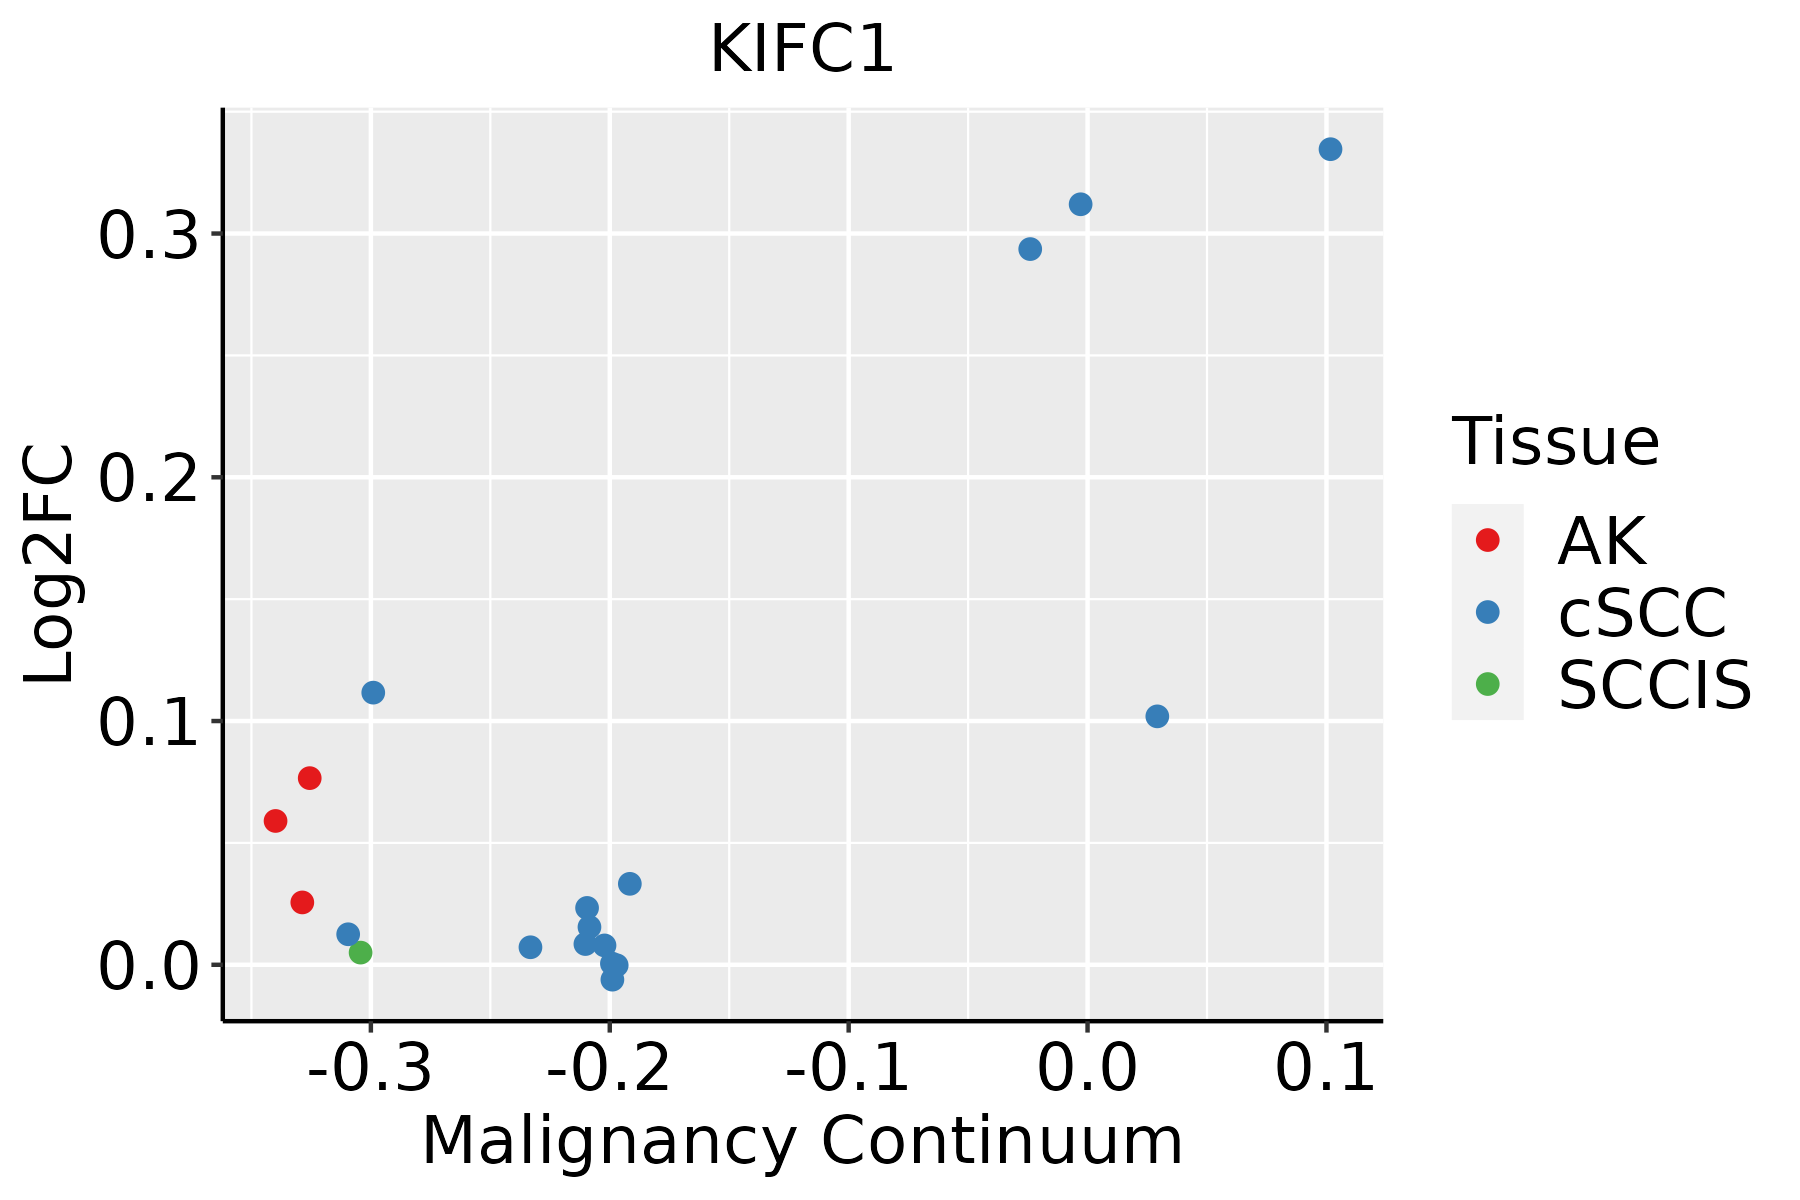
AK: Actinic keratosis
cSCC: Cutaneous squamous cell carcinoma
SCCIS:squamous cell carcinoma in situ
ThyroidThe image shows the transcriptomic changes along malignancy continuum.log2FC in expression of this searched gene in stem-like cells from each diseased tissue sample relative to stem-like cells in normal samples in each tissue plotted against the malignancy continuum. Samples are colored based on if they are from different disease stage.
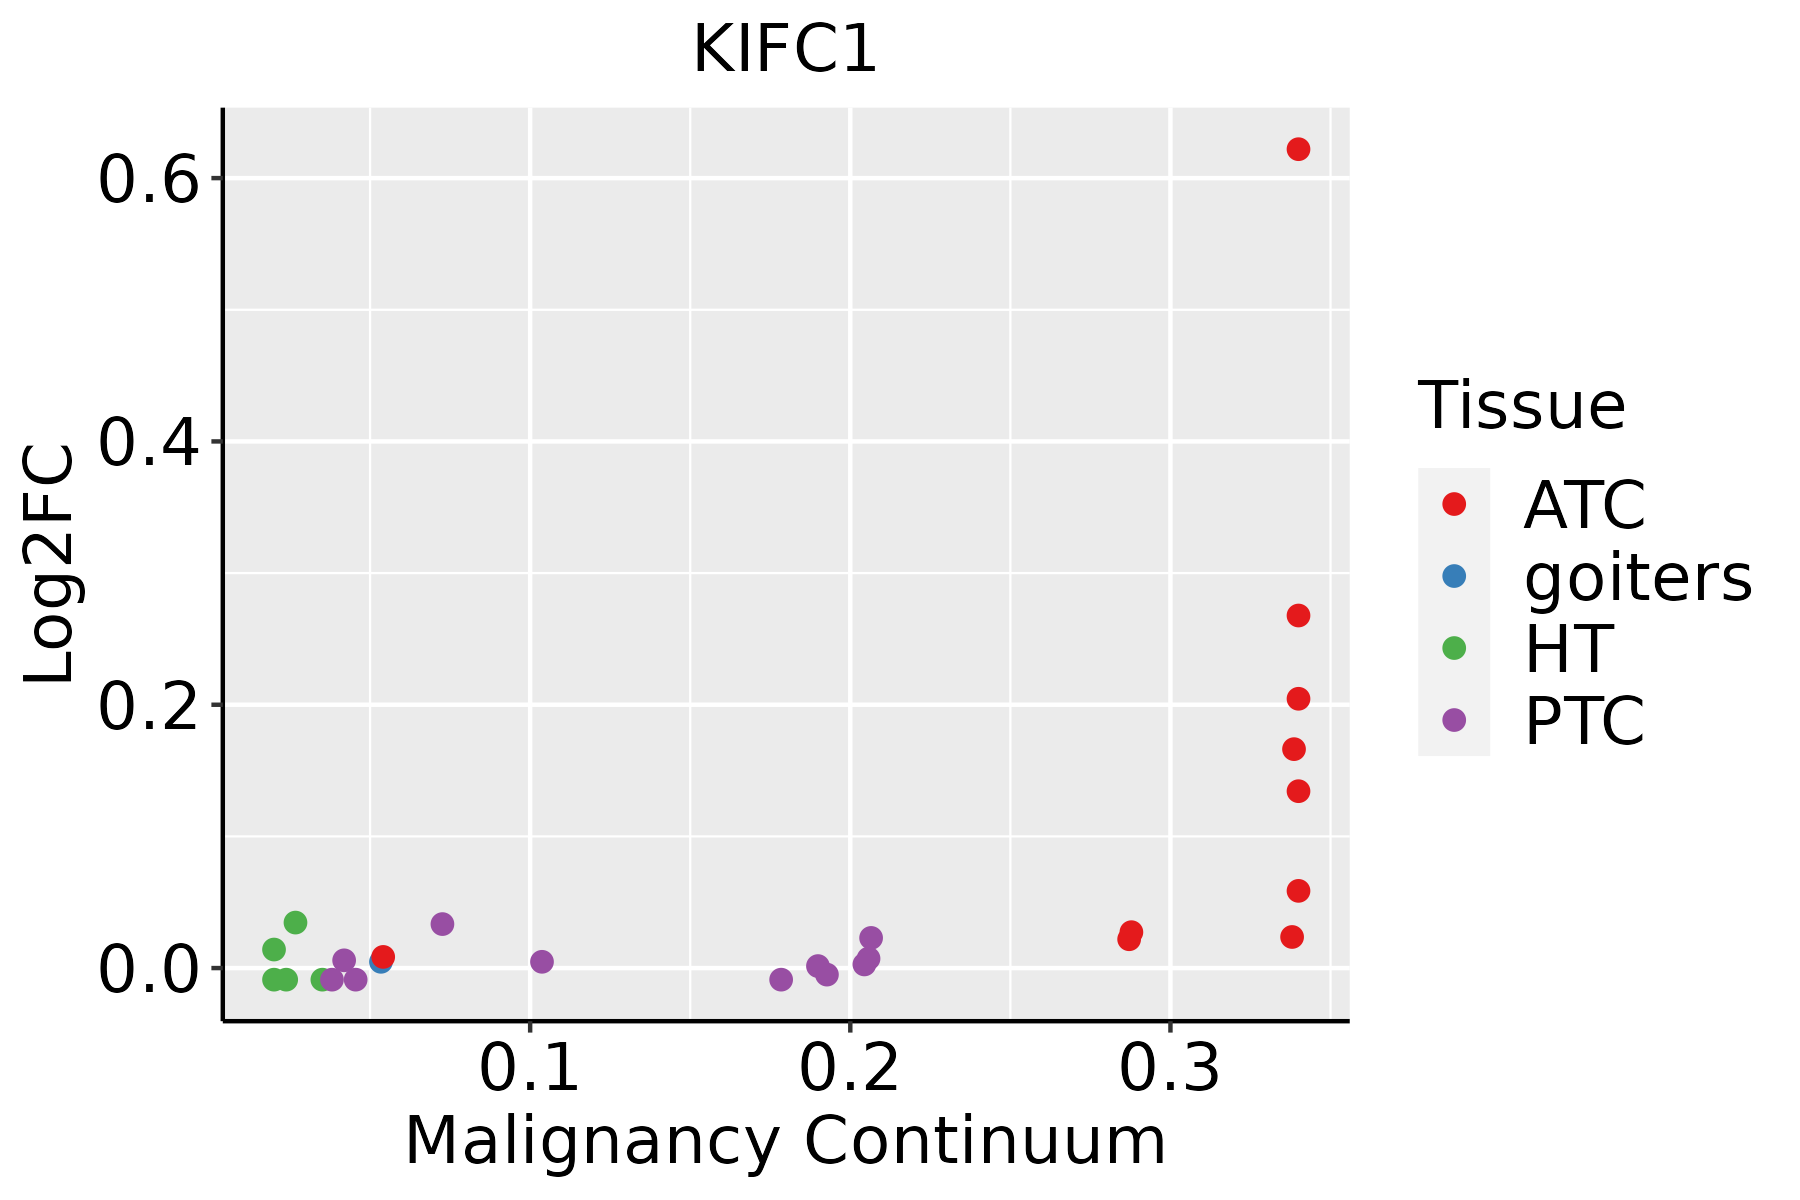
ATC: Anaplastic thyroid cancer
HT: Hashimoto's thyroiditis
PTC: Papillary thyroid cancer
∗log2FC in expression of this searched gene in stem-like cells from each diseased tissue sample relative to stem-like cells in normal samples in each tissue plotted against the malignancy continuum. Samples are colored based on if they are from different disease stage.

Top

Malignant transformation related pathway analysis

check buttonFind out the enriched GO biological processes and KEGG pathways involved in transition from healthy to precancer to cancer
check button Figure of enriched GO biological processes.
TissueDisease StageEnriched GO biological Processes
ColorectumADGO analysis - Figure of enriched GO biological processes: Top 15 enriched GO BP terms are showed in the bar plot of each disease state in each tissue. Each row represents a significant GO biological process which is colored according to the -log10(p.adjust).
ColorectumSERGO analysis - Figure of enriched GO biological processes: Top 15 enriched GO BP terms are showed in the bar plot of each disease state in each tissue. Each row represents a significant GO biological process which is colored according to the -log10(p.adjust).
ColorectumMSSGO analysis - Figure of enriched GO biological processes: Top 15 enriched GO BP terms are showed in the bar plot of each disease state in each tissue. Each row represents a significant GO biological process which is colored according to the -log10(p.adjust).
ColorectumMSI-HGO analysis - Figure of enriched GO biological processes: Top 15 enriched GO BP terms are showed in the bar plot of each disease state in each tissue. Each row represents a significant GO biological process which is colored according to the -log10(p.adjust).
ColorectumFAPGO analysis - Figure of enriched GO biological processes: Top 15 enriched GO BP terms are showed in the bar plot of each disease state in each tissue. Each row represents a significant GO biological process which is colored according to the -log10(p.adjust).
∗Top 15 enriched GO BP terms are showed in the bar plot of each disease state in each tissue. Each row represents a significant GO biological process which is colored according to the -log10(p.adjust).
Page: 1 2 3 4 5 6 7 8 9 

check button Enriched GO biological processes.
GO IDTissueDisease StageDescriptionGene RatioBg Ratiopvaluep.adjustCount
GO:014001414EsophagusESCCmitotic nuclear division218/8552287/187236.17e-261.78e-23218
GO:005165617EsophagusESCCestablishment of organelle localization273/8552390/187239.13e-231.81e-20273
GO:000007011EsophagusESCCmitotic sister chromatid segregation138/8552168/187231.37e-222.63e-20138
GO:00008194EsophagusESCCsister chromatid segregation157/8552202/187238.41e-211.33e-18157
GO:000705911EsophagusESCCchromosome segregation238/8552346/187231.72e-181.82e-16238
GO:190285015EsophagusESCCmicrotubule cytoskeleton organization involved in mitosis116/8552147/187231.25e-169.91e-15116
GO:000705214EsophagusESCCmitotic spindle organization97/8552120/187232.17e-151.33e-1397
GO:000705114EsophagusESCCspindle organization134/8552184/187235.70e-142.87e-12134
GO:005131011EsophagusESCCmetaphase plate congression58/855265/187231.81e-138.63e-1258
GO:000708011EsophagusESCCmitotic metaphase plate congression47/855250/187233.15e-131.47e-1147
GO:00482853EsophagusESCCorganelle fission301/8552488/187234.64e-132.12e-11301
GO:00988133EsophagusESCCnuclear chromosome segregation187/8552281/187231.00e-124.36e-11187
GO:005130311EsophagusESCCestablishment of chromosome localization67/855280/187231.92e-128.09e-1167
GO:005000011EsophagusESCCchromosome localization68/855282/187233.37e-121.32e-1068
GO:00002802EsophagusESCCnuclear division270/8552439/187231.17e-114.24e-10270
GO:00512256EsophagusESCCspindle assembly85/8552117/187232.72e-095.98e-0885
GO:009030715EsophagusESCCmitotic spindle assembly52/855265/187231.41e-082.77e-0752
GO:01400145Oral cavityOSCCmitotic nuclear division191/7305287/187231.99e-213.70e-19191
GO:005165610Oral cavityOSCCestablishment of organelle localization239/7305390/187232.46e-193.31e-17239
GO:00000702Oral cavityOSCCmitotic sister chromatid segregation118/7305168/187231.89e-161.48e-14118
Page: 1 2 3 4 

check button Enriched KEGG pathways.
Pathway IDTissueDisease StageDescriptionGene RatioBg Ratiopvaluep.adjustqvalueCount
Page: 1 

Top

Cell-cell communication analysis

check buttonIdentification of potential cell-cell interactions between two cell types and their ligand-receptor pairs for different disease states
LigandReceptorLRpairPathwayTissueDisease Stage
Page: 1 

Top

Single-cell gene regulatory network inference analysis

check buttonFind out the significant the regulons (TFs) and the target genes of each regulon across cell types for different disease states
TFCell TypeTissueDisease StageTarget GeneRSSRegulon Activity
∗The dot plots of a searched regulon are shown for all cell subpopulations in each disease state of each tissue based on the regulon specific score inferred using pySCENIC and by calculating the average expression.
Page: 1 

Top

Somatic mutation of malignant transformation related genes

check buttonAnnotation of somatic variants for genes involved in malignant transformation
Hugo SymbolVariant ClassVariant ClassificationdbSNP RSHGVScHGVSpHGVSp ShortSWISSPROTBIOTYPESIFTPolyPhenTumor Sample BarcodeTissueHistologySexAgeStageTherapy TypesDrugsOutcome
KIFC1SNVMissense_Mutationrs533235601c.956C>Tp.Pro319Leup.P319LQ9BW19protein_codingdeleterious(0)probably_damaging(1)TCGA-A8-A08C-01Breastbreast invasive carcinomaFemale>=65I/IIChemotherapy5-fluorouracilCR
KIFC1SNVMissense_Mutationc.95G>Tp.Gly32Valp.G32VQ9BW19protein_codingdeleterious(0.01)benign(0.274)TCGA-AR-A0TX-01Breastbreast invasive carcinomaFemale<65I/IIUnknownUnknownSD
KIFC1SNVMissense_Mutationc.253N>Gp.Gln85Glup.Q85EQ9BW19protein_codingtolerated(0.73)benign(0.015)TCGA-BH-A0BZ-01Breastbreast invasive carcinomaFemale<65III/IVChemotherapydoxorubicinCR
KIFC1SNVMissense_Mutationrs769727957c.1066N>Tp.Arg356Trpp.R356WQ9BW19protein_codingdeleterious(0.01)probably_damaging(0.991)TCGA-BH-A0HF-01Breastbreast invasive carcinomaFemale>=65I/IIHormone TherapyarimidexSD
KIFC1SNVMissense_Mutationc.1964N>Ap.Arg655Hisp.R655HQ9BW19protein_codingdeleterious(0)probably_damaging(1)TCGA-BH-A1F6-01Breastbreast invasive carcinomaFemale<65III/IVUnknownUnknownSD
KIFC1SNVMissense_Mutationc.955N>Tp.Pro319Serp.P319SQ9BW19protein_codingdeleterious(0)probably_damaging(1)TCGA-D8-A1Y3-01Breastbreast invasive carcinomaFemale<65III/IVChemotherapydoxorubicine+cyclophosphamideSD
KIFC1SNVMissense_Mutationc.458N>Tp.Cys153Phep.C153FQ9BW19protein_codingtolerated(0.45)benign(0.003)TCGA-E2-A14Q-01Breastbreast invasive carcinomaFemale<65I/IIHormone TherapytamoxiphenSD
KIFC1SNVMissense_Mutationc.1973C>Tp.Ser658Phep.S658FQ9BW19protein_codingdeleterious(0)probably_damaging(0.995)TCGA-E2-A15R-01Breastbreast invasive carcinomaFemale<65I/IIChemotherapycyclophosphamideSD
KIFC1insertionIn_Frame_Insnovelc.1252_1253insATGGTGAAACCCCGTCTTTACp.Phe418delinsTyrGlyGluThrProSerLeuLeup.F418delinsYGETPSLLQ9BW19protein_codingTCGA-A8-A09X-01Breastbreast invasive carcinomaFemale<65III/IVUnknownUnknownSD
KIFC1SNVMissense_Mutationc.380N>Ap.Gly127Glup.G127EQ9BW19protein_codingtolerated(0.09)benign(0.118)TCGA-C5-A1ML-01Cervixcervical & endocervical cancerFemale<65I/IIUnknownUnknownPD
Page: 1 2 3 4 5 6 7 

Top

Related drugs of malignant transformation related genes

check buttonIdentification of chemicals and drugs interact with genes involved in malignant transfromation
(DGIdb 4.0)
Entrez IDSymbolCategoryInteraction TypesDrug Claim NameDrug NamePMIDs
Page: 1