
|
|||||
|
 | |
| |
| |
| |
| |
| |
|
Gene: KIFAP3 |
Gene summary for KIFAP3 |
| Gene information | Species | Human | Gene symbol | KIFAP3 | Gene ID | 22920 |
| Gene name | kinesin associated protein 3 | |
| Gene Alias | FLA3 | |
| Cytomap | 1q24.2 | |
| Gene Type | protein-coding | GO ID | GO:0006810 | UniProtAcc | Q92845 |
Top |
Malignant transformation analysis |
| Identification of the aberrant gene expression in precancerous and cancerous lesions by comparing the gene expression of stem-like cells in diseased tissues with normal stem cells |
| Entrez ID | Symbol | Replicates | Species | Organ | Tissue | Adj P-value | Log2FC | Malignancy |
| 22920 | KIFAP3 | LZE4T | Human | Esophagus | ESCC | 2.52e-12 | 3.18e-01 | 0.0811 |
| 22920 | KIFAP3 | LZE7T | Human | Esophagus | ESCC | 3.25e-05 | 3.12e-01 | 0.0667 |
| 22920 | KIFAP3 | LZE24T | Human | Esophagus | ESCC | 4.28e-10 | 1.13e-01 | 0.0596 |
| 22920 | KIFAP3 | P1T-E | Human | Esophagus | ESCC | 7.68e-04 | 3.60e-01 | 0.0875 |
| 22920 | KIFAP3 | P2T-E | Human | Esophagus | ESCC | 3.28e-32 | 6.87e-01 | 0.1177 |
| 22920 | KIFAP3 | P4T-E | Human | Esophagus | ESCC | 8.39e-21 | 4.73e-01 | 0.1323 |
| 22920 | KIFAP3 | P5T-E | Human | Esophagus | ESCC | 2.14e-10 | 2.88e-01 | 0.1327 |
| 22920 | KIFAP3 | P8T-E | Human | Esophagus | ESCC | 1.02e-12 | 2.75e-01 | 0.0889 |
| 22920 | KIFAP3 | P9T-E | Human | Esophagus | ESCC | 5.61e-08 | 2.85e-01 | 0.1131 |
| 22920 | KIFAP3 | P10T-E | Human | Esophagus | ESCC | 1.07e-20 | 4.54e-01 | 0.116 |
| 22920 | KIFAP3 | P11T-E | Human | Esophagus | ESCC | 4.92e-17 | 4.91e-01 | 0.1426 |
| 22920 | KIFAP3 | P12T-E | Human | Esophagus | ESCC | 7.38e-16 | 2.22e-01 | 0.1122 |
| 22920 | KIFAP3 | P15T-E | Human | Esophagus | ESCC | 5.29e-11 | 2.44e-01 | 0.1149 |
| 22920 | KIFAP3 | P16T-E | Human | Esophagus | ESCC | 2.01e-23 | 4.33e-01 | 0.1153 |
| 22920 | KIFAP3 | P17T-E | Human | Esophagus | ESCC | 7.70e-07 | 3.71e-01 | 0.1278 |
| 22920 | KIFAP3 | P19T-E | Human | Esophagus | ESCC | 1.19e-04 | 4.20e-01 | 0.1662 |
| 22920 | KIFAP3 | P20T-E | Human | Esophagus | ESCC | 3.02e-12 | 2.59e-01 | 0.1124 |
| 22920 | KIFAP3 | P21T-E | Human | Esophagus | ESCC | 3.41e-18 | 4.45e-01 | 0.1617 |
| 22920 | KIFAP3 | P22T-E | Human | Esophagus | ESCC | 5.13e-25 | 4.90e-01 | 0.1236 |
| 22920 | KIFAP3 | P23T-E | Human | Esophagus | ESCC | 7.42e-16 | 3.17e-01 | 0.108 |
| Page: 1 2 3 4 5 |
| Tissue | Expression Dynamics | Abbreviation |
| Esophagus |  | ESCC: Esophageal squamous cell carcinoma |
| HGIN: High-grade intraepithelial neoplasias | ||
| LGIN: Low-grade intraepithelial neoplasias | ||
| Liver | 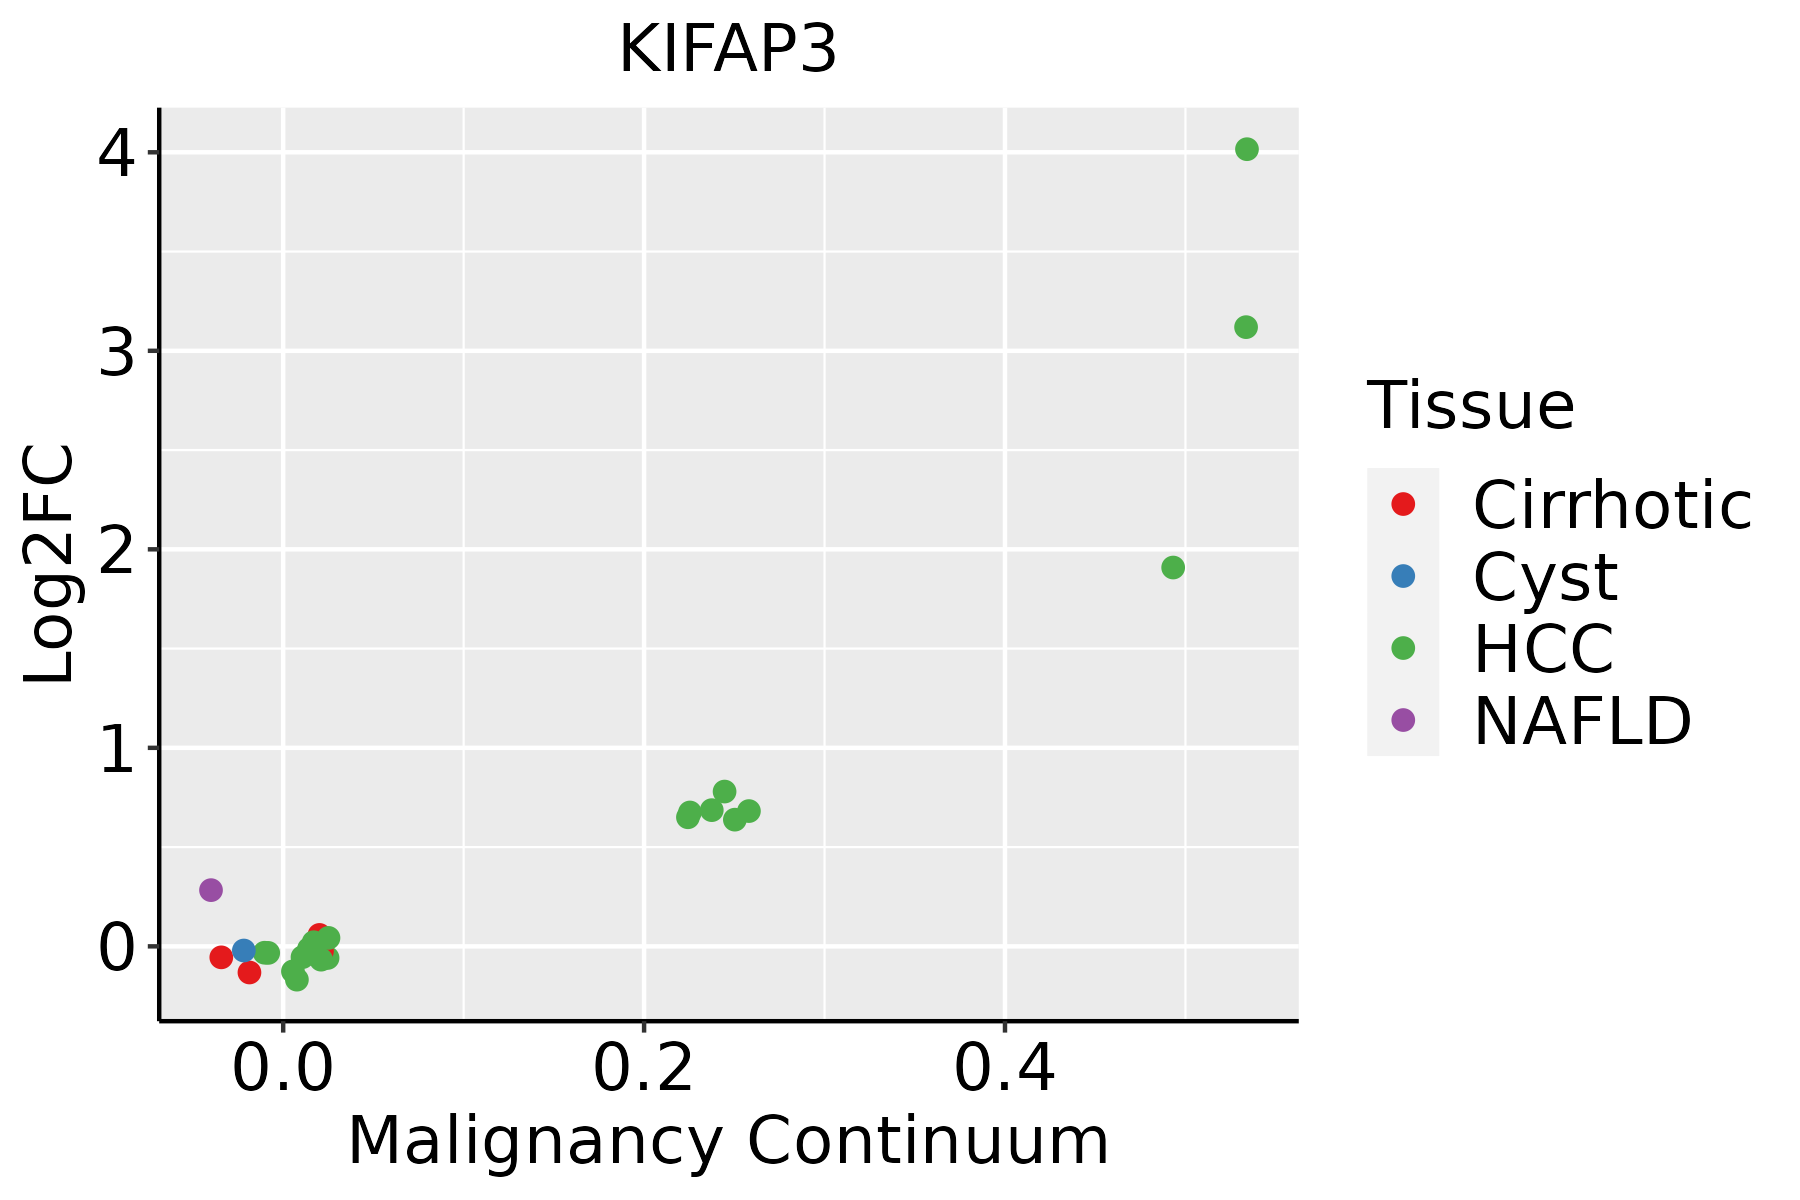 | HCC: Hepatocellular carcinoma |
| NAFLD: Non-alcoholic fatty liver disease | ||
| Thyroid | 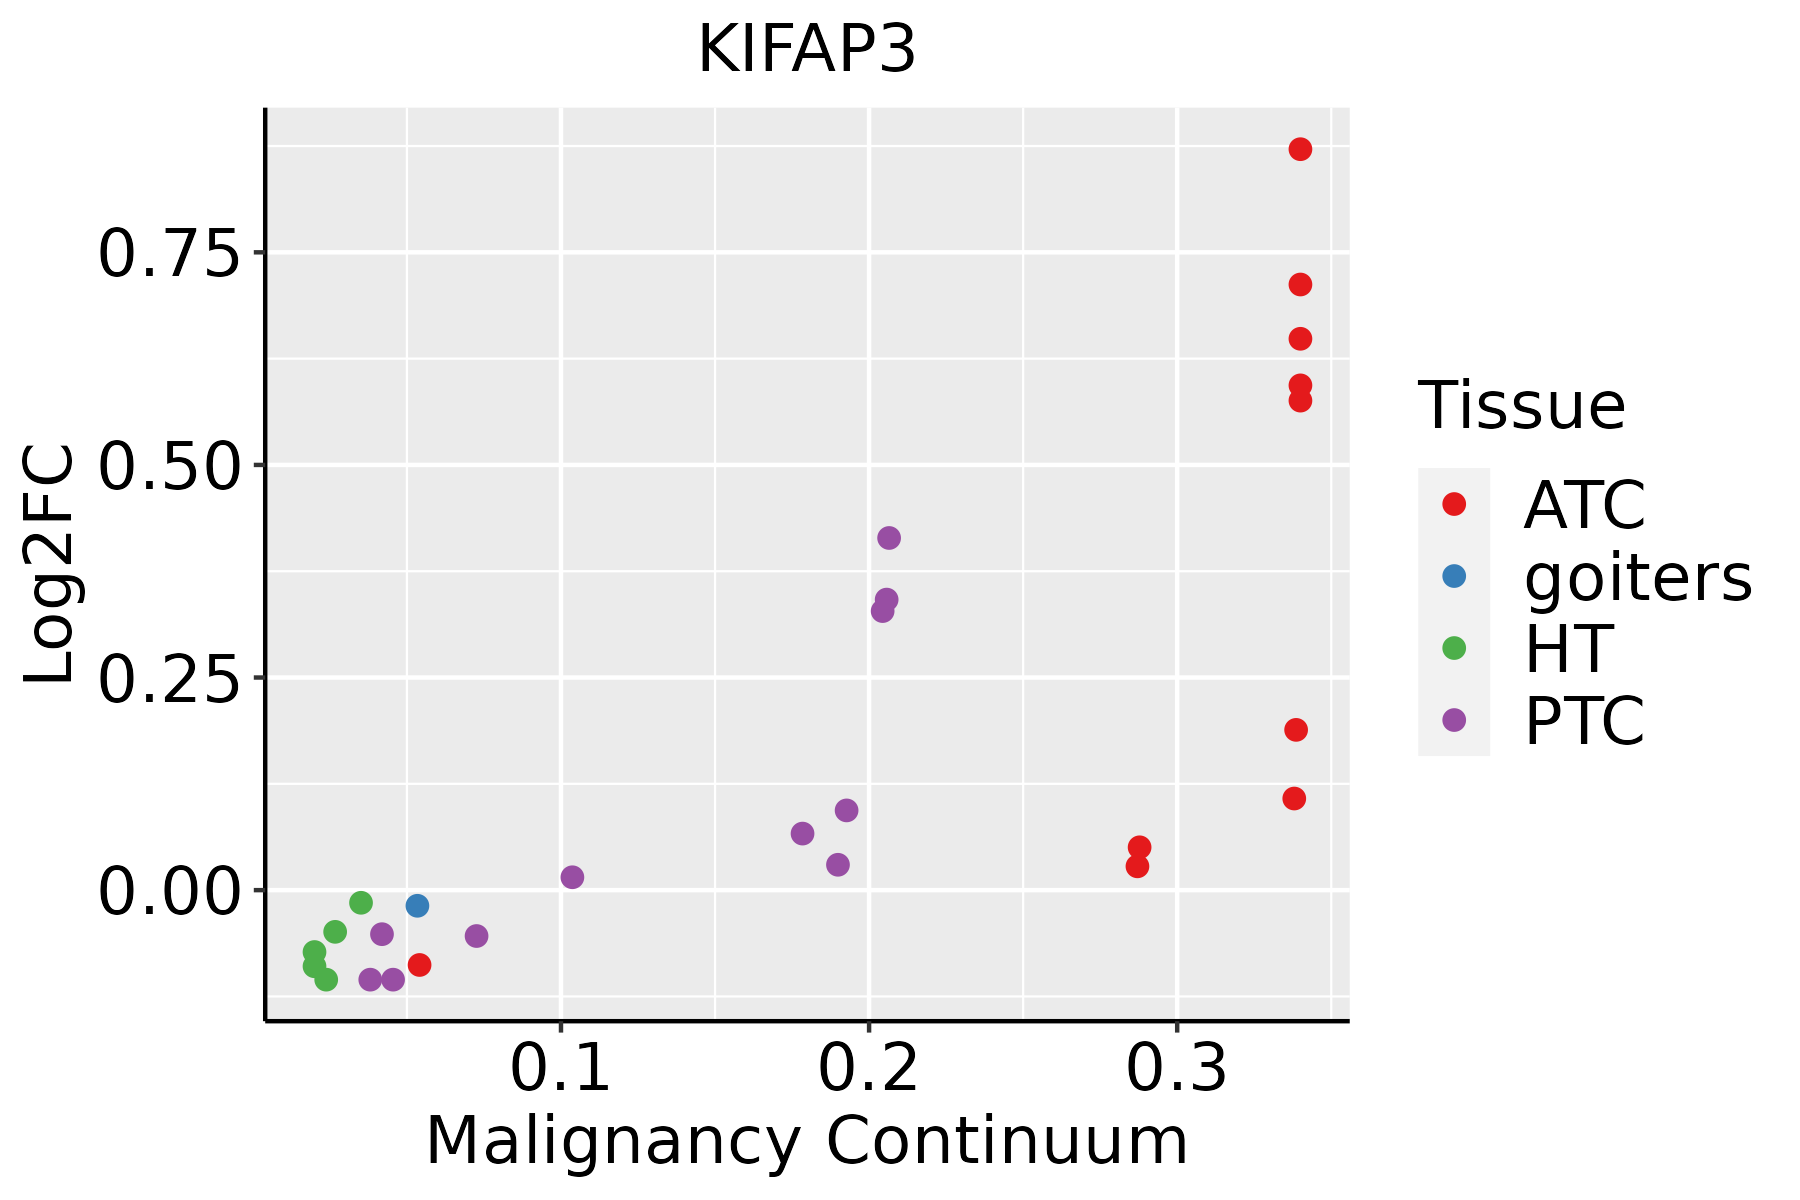 | ATC: Anaplastic thyroid cancer |
| HT: Hashimoto's thyroiditis | ||
| PTC: Papillary thyroid cancer |
| ∗log2FC in expression of this searched gene in stem-like cells from each diseased tissue sample relative to stem-like cells in normal samples in each tissue plotted against the malignancy continuum. Samples are colored based on if they are from different disease stage. |
Top |
Malignant transformation related pathway analysis |
| Find out the enriched GO biological processes and KEGG pathways involved in transition from healthy to precancer to cancer |
| Tissue | Disease Stage | Enriched GO biological Processes |
| Colorectum | AD |  |
| Colorectum | SER |  |
| Colorectum | MSS |  |
| Colorectum | MSI-H |  |
| Colorectum | FAP |  |
| ∗Top 15 enriched GO BP terms are showed in the bar plot of each disease state in each tissue. Each row represents a significant GO biological process which is colored according to the -log10(p.adjust). |
| Page: 1 2 3 4 5 6 7 8 9 |
| GO ID | Tissue | Disease Stage | Description | Gene Ratio | Bg Ratio | pvalue | p.adjust | Count |
| GO:005165617 | Esophagus | ESCC | establishment of organelle localization | 273/8552 | 390/18723 | 9.13e-23 | 1.81e-20 | 273 |
| GO:005165016 | Esophagus | ESCC | establishment of vesicle localization | 114/8552 | 161/18723 | 8.20e-11 | 2.53e-09 | 114 |
| GO:003070518 | Esophagus | ESCC | cytoskeleton-dependent intracellular transport | 133/8552 | 195/18723 | 1.48e-10 | 4.27e-09 | 133 |
| GO:001097013 | Esophagus | ESCC | transport along microtubule | 107/8552 | 155/18723 | 3.17e-09 | 6.80e-08 | 107 |
| GO:005164815 | Esophagus | ESCC | vesicle localization | 119/8552 | 177/18723 | 5.16e-09 | 1.08e-07 | 119 |
| GO:00723846 | Esophagus | ESCC | organelle transport along microtubule | 65/8552 | 85/18723 | 6.61e-09 | 1.35e-07 | 65 |
| GO:004578527 | Esophagus | ESCC | positive regulation of cell adhesion | 255/8552 | 437/18723 | 5.07e-08 | 9.11e-07 | 255 |
| GO:00474962 | Esophagus | ESCC | vesicle transport along microtubule | 36/8552 | 47/18723 | 1.53e-05 | 1.38e-04 | 36 |
| GO:00991114 | Esophagus | ESCC | microtubule-based transport | 115/8552 | 190/18723 | 2.54e-05 | 2.15e-04 | 115 |
| GO:00995185 | Esophagus | ESCC | vesicle cytoskeletal trafficking | 50/8552 | 73/18723 | 6.75e-05 | 5.12e-04 | 50 |
| GO:002240720 | Esophagus | ESCC | regulation of cell-cell adhesion | 239/8552 | 448/18723 | 5.88e-04 | 3.19e-03 | 239 |
| GO:002240919 | Esophagus | ESCC | positive regulation of cell-cell adhesion | 155/8552 | 284/18723 | 1.50e-03 | 7.06e-03 | 155 |
| GO:005165621 | Liver | HCC | establishment of organelle localization | 226/7958 | 390/18723 | 4.15e-10 | 1.34e-08 | 226 |
| GO:005165021 | Liver | HCC | establishment of vesicle localization | 103/7958 | 161/18723 | 2.94e-08 | 6.69e-07 | 103 |
| GO:005164821 | Liver | HCC | vesicle localization | 107/7958 | 177/18723 | 1.05e-06 | 1.57e-05 | 107 |
| GO:00723843 | Liver | HCC | organelle transport along microtubule | 56/7958 | 85/18723 | 1.13e-05 | 1.29e-04 | 56 |
| GO:003070521 | Liver | HCC | cytoskeleton-dependent intracellular transport | 111/7958 | 195/18723 | 3.25e-05 | 3.28e-04 | 111 |
| GO:0047496 | Liver | HCC | vesicle transport along microtubule | 34/7958 | 47/18723 | 3.27e-05 | 3.29e-04 | 34 |
| GO:00109702 | Liver | HCC | transport along microtubule | 90/7958 | 155/18723 | 6.49e-05 | 5.92e-04 | 90 |
| GO:00995182 | Liver | HCC | vesicle cytoskeletal trafficking | 46/7958 | 73/18723 | 3.23e-04 | 2.28e-03 | 46 |
| Page: 1 2 |
| Pathway ID | Tissue | Disease Stage | Description | Gene Ratio | Bg Ratio | pvalue | p.adjust | qvalue | Count |
| Page: 1 |
Top |
Cell-cell communication analysis |
| Identification of potential cell-cell interactions between two cell types and their ligand-receptor pairs for different disease states |
| Ligand | Receptor | LRpair | Pathway | Tissue | Disease Stage |
| Page: 1 |
Top |
Single-cell gene regulatory network inference analysis |
| Find out the significant the regulons (TFs) and the target genes of each regulon across cell types for different disease states |
| TF | Cell Type | Tissue | Disease Stage | Target Gene | RSS | Regulon Activity |
| ∗The dot plots of a searched regulon are shown for all cell subpopulations in each disease state of each tissue based on the regulon specific score inferred using pySCENIC and by calculating the average expression. |
| Page: 1 |
Top |
Somatic mutation of malignant transformation related genes |
| Annotation of somatic variants for genes involved in malignant transformation |
| Hugo Symbol | Variant Class | Variant Classification | dbSNP RS | HGVSc | HGVSp | HGVSp Short | SWISSPROT | BIOTYPE | SIFT | PolyPhen | Tumor Sample Barcode | Tissue | Histology | Sex | Age | Stage | Therapy Types | Drugs | Outcome |
| KIFAP3 | SNV | Missense_Mutation | novel | c.1458N>A | p.Met486Ile | p.M486I | Q92845 | protein_coding | tolerated(0.08) | benign(0.027) | TCGA-5L-AAT0-01 | Breast | breast invasive carcinoma | Female | <65 | I/II | Hormone Therapy | tamoxiphen | SD |
| KIFAP3 | SNV | Missense_Mutation | c.553N>A | p.Glu185Lys | p.E185K | Q92845 | protein_coding | deleterious(0.02) | probably_damaging(0.994) | TCGA-A8-A07J-01 | Breast | breast invasive carcinoma | Female | <65 | I/II | Chemotherapy | 5-fluorouracil | CR | |
| KIFAP3 | SNV | Missense_Mutation | novel | c.1409N>G | p.Met470Arg | p.M470R | Q92845 | protein_coding | tolerated(0.36) | benign(0.193) | TCGA-A8-A08H-01 | Breast | breast invasive carcinoma | Female | >=65 | I/II | Unknown | Unknown | SD |
| KIFAP3 | SNV | Missense_Mutation | c.616N>G | p.Ser206Gly | p.S206G | Q92845 | protein_coding | deleterious(0.01) | possibly_damaging(0.86) | TCGA-AN-A0AK-01 | Breast | breast invasive carcinoma | Female | >=65 | I/II | Unknown | Unknown | SD | |
| KIFAP3 | SNV | Missense_Mutation | c.2152C>T | p.Pro718Ser | p.P718S | Q92845 | protein_coding | tolerated(0.25) | benign(0.272) | TCGA-D8-A1J8-01 | Breast | breast invasive carcinoma | Female | >=65 | I/II | Hormone Therapy | nolvadex | SD | |
| KIFAP3 | SNV | Missense_Mutation | c.379G>A | p.Asp127Asn | p.D127N | Q92845 | protein_coding | tolerated(0.27) | benign(0.01) | TCGA-E9-A1R2-01 | Breast | breast invasive carcinoma | Female | <65 | III/IV | Chemotherapy | taxotere | CR | |
| KIFAP3 | insertion | Nonsense_Mutation | novel | c.1406_1407insCCATCCCTCTGCATATACATAAACACGCACAAAGGTCTTT | p.Lys469AsnfsTer8 | p.K469Nfs*8 | Q92845 | protein_coding | TCGA-A8-A08H-01 | Breast | breast invasive carcinoma | Female | >=65 | I/II | Unknown | Unknown | SD | ||
| KIFAP3 | insertion | Frame_Shift_Ins | novel | c.2261_2262insTGAGT | p.Phe755GlufsTer71 | p.F755Efs*71 | Q92845 | protein_coding | TCGA-AO-A0J9-01 | Breast | breast invasive carcinoma | Female | <65 | III/IV | Chemotherapy | cyclophosphamide | PD | ||
| KIFAP3 | insertion | Frame_Shift_Ins | novel | c.2260_2261insGCCTAATTAATGAATGCAGATTGTTT | p.Ser754CysfsTer79 | p.S754Cfs*79 | Q92845 | protein_coding | TCGA-AO-A0J9-01 | Breast | breast invasive carcinoma | Female | <65 | III/IV | Chemotherapy | cyclophosphamide | PD | ||
| KIFAP3 | insertion | In_Frame_Ins | novel | c.1753_1754insCCATTAGTCCCTTAG | p.Leu585delinsProIleSerProLeuVal | p.L585delinsPISPLV | Q92845 | protein_coding | TCGA-AR-A0TU-01 | Breast | breast invasive carcinoma | Female | <65 | I/II | Unspecific | Doxorubicin | SD |
| Page: 1 2 3 4 5 6 7 8 9 10 11 |
Top |
Related drugs of malignant transformation related genes |
| Identification of chemicals and drugs interact with genes involved in malignant transfromation |
| (DGIdb 4.0) |
| Entrez ID | Symbol | Category | Interaction Types | Drug Claim Name | Drug Name | PMIDs |
| Page: 1 |

Copyright 2023-Present -The University of Texas Health Science Center at Houston |