
|
|||||
|
 | |
| |
| |
| |
| |
| |
|
Gene: KIF9 |
Gene summary for KIF9 |
| Gene information | Species | Human | Gene symbol | KIF9 | Gene ID | 64147 |
| Gene name | kinesin family member 9 | |
| Gene Alias | KIF9 | |
| Cytomap | 3p21.31 | |
| Gene Type | protein-coding | GO ID | GO:0006928 | UniProtAcc | A8K932 |
Top |
Malignant transformation analysis |
| Identification of the aberrant gene expression in precancerous and cancerous lesions by comparing the gene expression of stem-like cells in diseased tissues with normal stem cells |
| Entrez ID | Symbol | Replicates | Species | Organ | Tissue | Adj P-value | Log2FC | Malignancy |
| 64147 | KIF9 | LZE7T | Human | Esophagus | ESCC | 3.75e-03 | 2.35e-02 | 0.0667 |
| 64147 | KIF9 | P1T-E | Human | Esophagus | ESCC | 2.82e-03 | 2.28e-01 | 0.0875 |
| 64147 | KIF9 | P2T-E | Human | Esophagus | ESCC | 2.17e-16 | 9.71e-02 | 0.1177 |
| 64147 | KIF9 | P4T-E | Human | Esophagus | ESCC | 5.10e-10 | 2.45e-01 | 0.1323 |
| 64147 | KIF9 | P5T-E | Human | Esophagus | ESCC | 4.70e-14 | 1.17e-01 | 0.1327 |
| 64147 | KIF9 | P8T-E | Human | Esophagus | ESCC | 1.48e-12 | 1.44e-01 | 0.0889 |
| 64147 | KIF9 | P9T-E | Human | Esophagus | ESCC | 2.43e-09 | 7.43e-02 | 0.1131 |
| 64147 | KIF9 | P10T-E | Human | Esophagus | ESCC | 5.58e-15 | 2.42e-01 | 0.116 |
| 64147 | KIF9 | P11T-E | Human | Esophagus | ESCC | 3.54e-05 | 2.22e-01 | 0.1426 |
| 64147 | KIF9 | P12T-E | Human | Esophagus | ESCC | 2.93e-23 | 1.02e-01 | 0.1122 |
| 64147 | KIF9 | P15T-E | Human | Esophagus | ESCC | 1.57e-09 | -1.42e-03 | 0.1149 |
| 64147 | KIF9 | P16T-E | Human | Esophagus | ESCC | 9.83e-17 | 1.72e-01 | 0.1153 |
| 64147 | KIF9 | P20T-E | Human | Esophagus | ESCC | 3.71e-10 | 7.30e-02 | 0.1124 |
| 64147 | KIF9 | P21T-E | Human | Esophagus | ESCC | 4.88e-30 | 5.18e-01 | 0.1617 |
| 64147 | KIF9 | P22T-E | Human | Esophagus | ESCC | 2.69e-11 | 1.19e-02 | 0.1236 |
| 64147 | KIF9 | P23T-E | Human | Esophagus | ESCC | 1.41e-14 | 4.56e-01 | 0.108 |
| 64147 | KIF9 | P24T-E | Human | Esophagus | ESCC | 1.76e-12 | 1.19e-01 | 0.1287 |
| 64147 | KIF9 | P26T-E | Human | Esophagus | ESCC | 3.84e-16 | 1.01e-01 | 0.1276 |
| 64147 | KIF9 | P27T-E | Human | Esophagus | ESCC | 5.97e-15 | 1.09e-01 | 0.1055 |
| 64147 | KIF9 | P28T-E | Human | Esophagus | ESCC | 7.13e-14 | 8.49e-02 | 0.1149 |
| Page: 1 2 3 4 |
| Tissue | Expression Dynamics | Abbreviation |
| Esophagus | 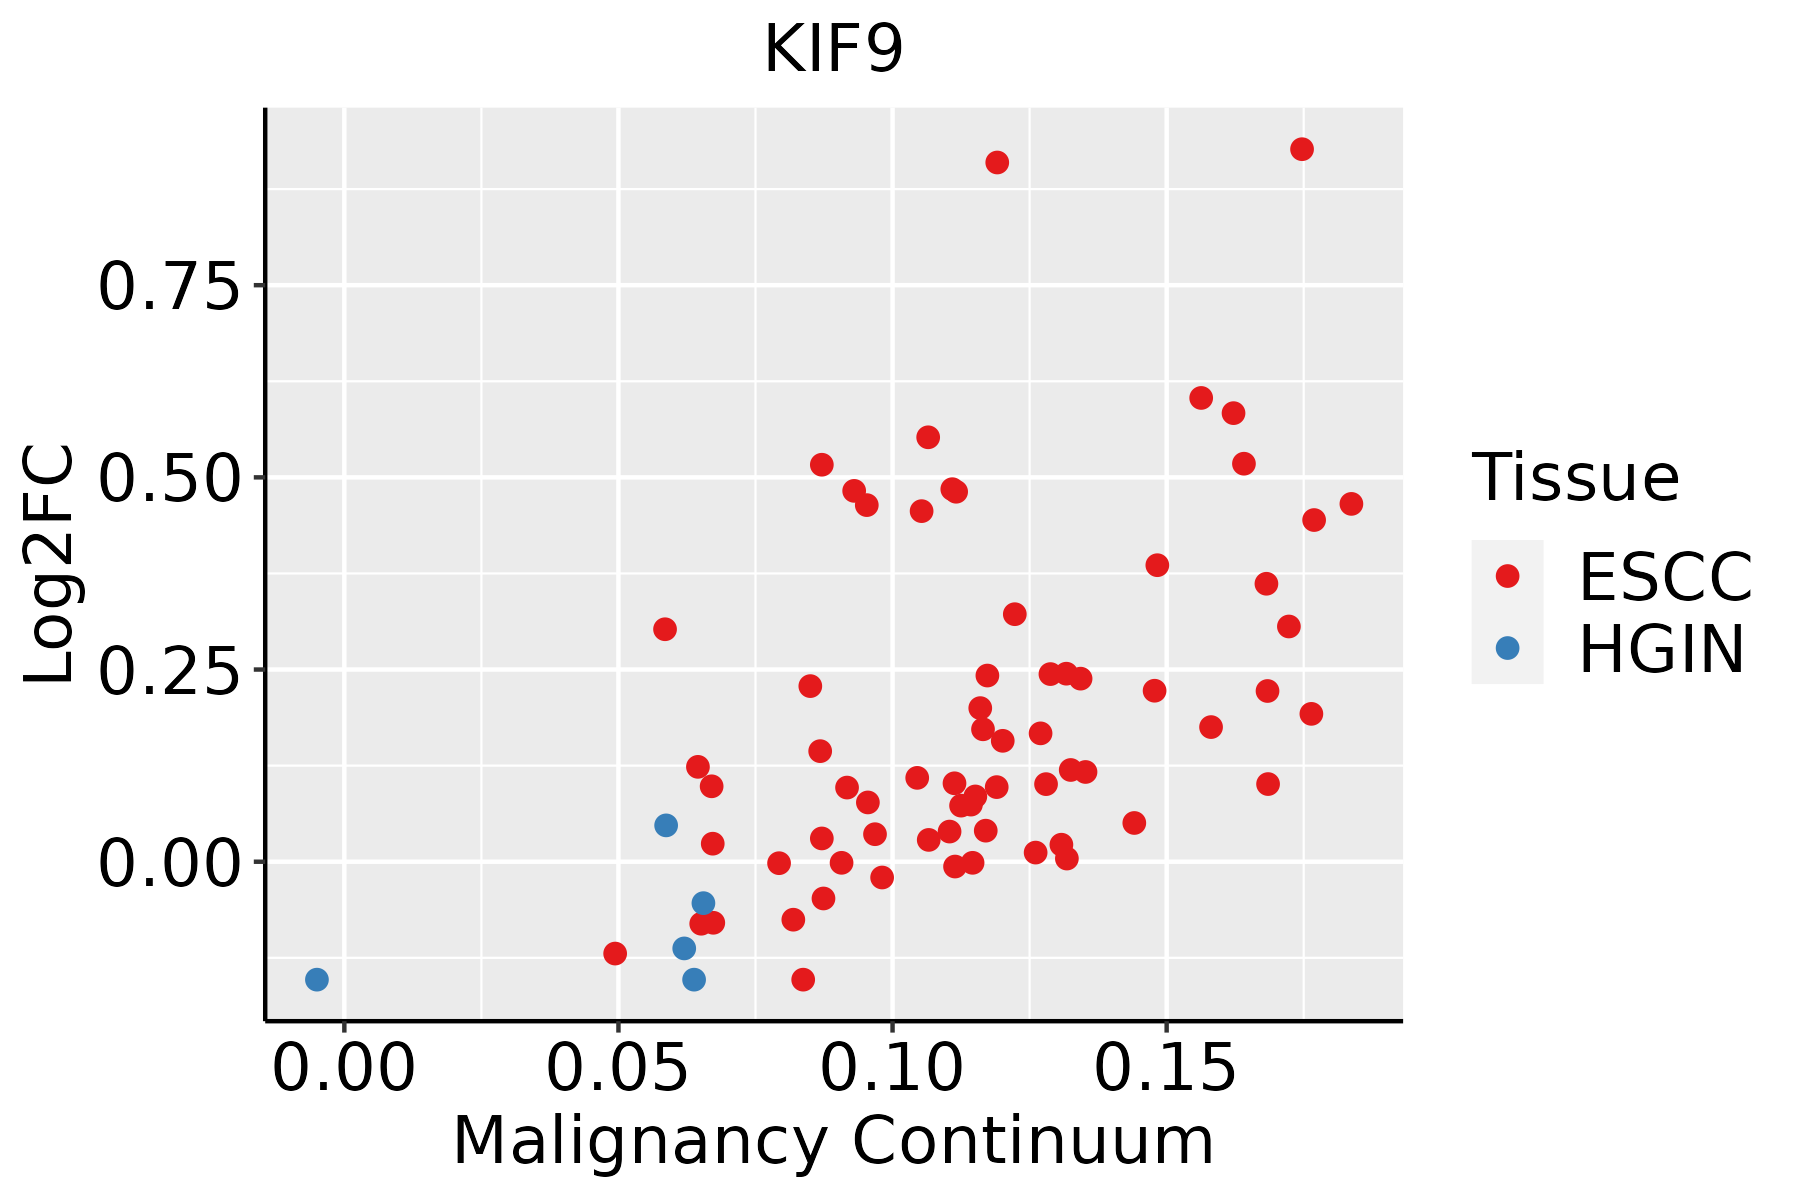 | ESCC: Esophageal squamous cell carcinoma |
| HGIN: High-grade intraepithelial neoplasias | ||
| LGIN: Low-grade intraepithelial neoplasias | ||
| Liver |  | HCC: Hepatocellular carcinoma |
| NAFLD: Non-alcoholic fatty liver disease | ||
| Oral Cavity |  | EOLP: Erosive Oral lichen planus |
| LP: leukoplakia | ||
| NEOLP: Non-erosive oral lichen planus | ||
| OSCC: Oral squamous cell carcinoma |
| ∗log2FC in expression of this searched gene in stem-like cells from each diseased tissue sample relative to stem-like cells in normal samples in each tissue plotted against the malignancy continuum. Samples are colored based on if they are from different disease stage. |
Top |
Malignant transformation related pathway analysis |
| Find out the enriched GO biological processes and KEGG pathways involved in transition from healthy to precancer to cancer |
| Tissue | Disease Stage | Enriched GO biological Processes |
| Colorectum | AD |  |
| Colorectum | SER |  |
| Colorectum | MSS |  |
| Colorectum | MSI-H |  |
| Colorectum | FAP |  |
| ∗Top 15 enriched GO BP terms are showed in the bar plot of each disease state in each tissue. Each row represents a significant GO biological process which is colored according to the -log10(p.adjust). |
| Page: 1 2 3 4 5 6 7 8 9 |
| GO ID | Tissue | Disease Stage | Description | Gene Ratio | Bg Ratio | pvalue | p.adjust | Count |
| GO:0022411111 | Esophagus | ESCC | cellular component disassembly | 305/8552 | 443/18723 | 1.94e-23 | 4.57e-21 | 305 |
| GO:0043254111 | Esophagus | ESCC | regulation of protein-containing complex assembly | 278/8552 | 428/18723 | 3.81e-16 | 2.77e-14 | 278 |
| GO:190300816 | Esophagus | ESCC | organelle disassembly | 89/8552 | 114/18723 | 1.36e-12 | 5.80e-11 | 89 |
| GO:190211514 | Esophagus | ESCC | regulation of organelle assembly | 116/8552 | 186/18723 | 3.15e-06 | 3.53e-05 | 116 |
| GO:00301984 | Esophagus | ESCC | extracellular matrix organization | 171/8552 | 301/18723 | 6.08e-05 | 4.67e-04 | 171 |
| GO:00430624 | Esophagus | ESCC | extracellular structure organization | 171/8552 | 302/18723 | 7.73e-05 | 5.76e-04 | 171 |
| GO:00452294 | Esophagus | ESCC | external encapsulating structure organization | 172/8552 | 304/18723 | 7.80e-05 | 5.80e-04 | 172 |
| GO:00718001 | Esophagus | ESCC | podosome assembly | 15/8552 | 18/18723 | 1.20e-03 | 5.88e-03 | 15 |
| GO:00718012 | Esophagus | ESCC | regulation of podosome assembly | 11/8552 | 13/18723 | 4.76e-03 | 1.85e-02 | 11 |
| GO:00226172 | Esophagus | ESCC | extracellular matrix disassembly | 39/8552 | 63/18723 | 6.92e-03 | 2.52e-02 | 39 |
| GO:00224117 | Liver | Cirrhotic | cellular component disassembly | 182/4634 | 443/18723 | 1.59e-14 | 1.54e-12 | 182 |
| GO:004325412 | Liver | Cirrhotic | regulation of protein-containing complex assembly | 169/4634 | 428/18723 | 7.40e-12 | 4.99e-10 | 169 |
| GO:19030084 | Liver | Cirrhotic | organelle disassembly | 59/4634 | 114/18723 | 4.82e-10 | 2.27e-08 | 59 |
| GO:1902115 | Liver | Cirrhotic | regulation of organelle assembly | 66/4634 | 186/18723 | 6.66e-04 | 5.04e-03 | 66 |
| GO:002241112 | Liver | HCC | cellular component disassembly | 282/7958 | 443/18723 | 1.02e-19 | 1.38e-17 | 282 |
| GO:004325422 | Liver | HCC | regulation of protein-containing complex assembly | 264/7958 | 428/18723 | 5.47e-16 | 4.39e-14 | 264 |
| GO:190300811 | Liver | HCC | organelle disassembly | 89/7958 | 114/18723 | 8.68e-15 | 5.73e-13 | 89 |
| GO:19021151 | Liver | HCC | regulation of organelle assembly | 110/7958 | 186/18723 | 3.30e-06 | 4.34e-05 | 110 |
| GO:002241119 | Oral cavity | OSCC | cellular component disassembly | 283/7305 | 443/18723 | 9.57e-27 | 3.37e-24 | 283 |
| GO:004325420 | Oral cavity | OSCC | regulation of protein-containing complex assembly | 255/7305 | 428/18723 | 2.94e-18 | 3.15e-16 | 255 |
| Page: 1 2 |
| Pathway ID | Tissue | Disease Stage | Description | Gene Ratio | Bg Ratio | pvalue | p.adjust | qvalue | Count |
| Page: 1 |
Top |
Cell-cell communication analysis |
| Identification of potential cell-cell interactions between two cell types and their ligand-receptor pairs for different disease states |
| Ligand | Receptor | LRpair | Pathway | Tissue | Disease Stage |
| Page: 1 |
Top |
Single-cell gene regulatory network inference analysis |
| Find out the significant the regulons (TFs) and the target genes of each regulon across cell types for different disease states |
| TF | Cell Type | Tissue | Disease Stage | Target Gene | RSS | Regulon Activity |
| ∗The dot plots of a searched regulon are shown for all cell subpopulations in each disease state of each tissue based on the regulon specific score inferred using pySCENIC and by calculating the average expression. |
| Page: 1 |
Top |
Somatic mutation of malignant transformation related genes |
| Annotation of somatic variants for genes involved in malignant transformation |
| Hugo Symbol | Variant Class | Variant Classification | dbSNP RS | HGVSc | HGVSp | HGVSp Short | SWISSPROT | BIOTYPE | SIFT | PolyPhen | Tumor Sample Barcode | Tissue | Histology | Sex | Age | Stage | Therapy Types | Drugs | Outcome |
| KIF9 | SNV | Missense_Mutation | rs772965509 | c.1530N>C | p.Lys510Asn | p.K510N | Q9HAQ2 | protein_coding | deleterious(0.05) | benign(0.132) | TCGA-A8-A06Z-01 | Breast | breast invasive carcinoma | Female | >=65 | I/II | Unknown | Unknown | SD |
| KIF9 | SNV | Missense_Mutation | c.691N>G | p.Leu231Val | p.L231V | Q9HAQ2 | protein_coding | tolerated(0.15) | benign(0.222) | TCGA-AQ-A1H2-01 | Breast | breast invasive carcinoma | Female | >=65 | III/IV | Chemotherapy | herceptin | SD | |
| KIF9 | SNV | Missense_Mutation | c.664N>T | p.Ile222Phe | p.I222F | Q9HAQ2 | protein_coding | deleterious(0.03) | possibly_damaging(0.775) | TCGA-C8-A134-01 | Breast | breast invasive carcinoma | Female | <65 | I/II | Chemotherapy | 5-fluorouracil | CR | |
| KIF9 | insertion | Nonsense_Mutation | novel | c.2125_2126insGGGAACACTGACAGACATGGGGGCTGGAGGGCTGTGAGATG | p.Ser709TrpfsTer4 | p.S709Wfs*4 | Q9HAQ2 | protein_coding | TCGA-A8-A093-01 | Breast | breast invasive carcinoma | Female | <65 | I/II | Hormone Therapy | tamoxiphen | SD | ||
| KIF9 | SNV | Missense_Mutation | rs776004585 | c.1573G>A | p.Val525Ile | p.V525I | Q9HAQ2 | protein_coding | tolerated(0.45) | benign(0) | TCGA-AA-3870-01 | Colorectum | colon adenocarcinoma | Female | >=65 | III/IV | Chemotherapy | folinic | CR |
| KIF9 | SNV | Missense_Mutation | c.389G>A | p.Arg130His | p.R130H | Q9HAQ2 | protein_coding | tolerated(0.18) | possibly_damaging(0.633) | TCGA-AA-3966-01 | Colorectum | colon adenocarcinoma | Female | >=65 | I/II | Unknown | Unknown | SD | |
| KIF9 | SNV | Missense_Mutation | novel | c.629N>G | p.Asn210Ser | p.N210S | Q9HAQ2 | protein_coding | deleterious(0.02) | probably_damaging(0.991) | TCGA-AA-3984-01 | Colorectum | colon adenocarcinoma | Female | <65 | I/II | Unknown | Unknown | SD |
| KIF9 | SNV | Missense_Mutation | c.1796N>T | p.Asn599Ile | p.N599I | Q9HAQ2 | protein_coding | deleterious(0) | possibly_damaging(0.892) | TCGA-AA-A01P-01 | Colorectum | colon adenocarcinoma | Female | >=65 | III/IV | Unknown | Unknown | PD | |
| KIF9 | SNV | Missense_Mutation | rs745616983 | c.1714N>A | p.Asp572Asn | p.D572N | Q9HAQ2 | protein_coding | deleterious(0.05) | benign(0) | TCGA-AD-5900-01 | Colorectum | colon adenocarcinoma | Male | >=65 | I/II | Unknown | Unknown | SD |
| KIF9 | SNV | Missense_Mutation | rs773934395 | c.49N>A | p.Asp17Asn | p.D17N | Q9HAQ2 | protein_coding | tolerated(0.23) | benign(0.174) | TCGA-CA-6717-01 | Colorectum | colon adenocarcinoma | Male | <65 | I/II | Chemotherapy | oxaliplatin | CR |
| Page: 1 2 3 4 5 6 7 |
Top |
Related drugs of malignant transformation related genes |
| Identification of chemicals and drugs interact with genes involved in malignant transfromation |
| (DGIdb 4.0) |
| Entrez ID | Symbol | Category | Interaction Types | Drug Claim Name | Drug Name | PMIDs |
| Page: 1 |

Copyright 2023-Present -The University of Texas Health Science Center at Houston |