
|
|||||
|
 | |
| |
| |
| |
| |
| |
|
Gene: KIF3A |
Gene summary for KIF3A |
| Gene information | Species | Human | Gene symbol | KIF3A | Gene ID | 11127 |
| Gene name | kinesin family member 3A | |
| Gene Alias | FLA10 | |
| Cytomap | 5q31.1 | |
| Gene Type | protein-coding | GO ID | GO:0000226 | UniProtAcc | B4DHG8 |
Top |
Malignant transformation analysis |
| Identification of the aberrant gene expression in precancerous and cancerous lesions by comparing the gene expression of stem-like cells in diseased tissues with normal stem cells |
| Entrez ID | Symbol | Replicates | Species | Organ | Tissue | Adj P-value | Log2FC | Malignancy |
| 11127 | KIF3A | LZE4T | Human | Esophagus | ESCC | 2.51e-06 | 1.01e-01 | 0.0811 |
| 11127 | KIF3A | LZE7T | Human | Esophagus | ESCC | 1.62e-04 | 1.70e-01 | 0.0667 |
| 11127 | KIF3A | LZE24T | Human | Esophagus | ESCC | 3.83e-14 | 4.23e-01 | 0.0596 |
| 11127 | KIF3A | P2T-E | Human | Esophagus | ESCC | 1.11e-32 | 5.60e-01 | 0.1177 |
| 11127 | KIF3A | P4T-E | Human | Esophagus | ESCC | 4.85e-21 | 3.43e-01 | 0.1323 |
| 11127 | KIF3A | P5T-E | Human | Esophagus | ESCC | 3.71e-11 | 2.09e-01 | 0.1327 |
| 11127 | KIF3A | P8T-E | Human | Esophagus | ESCC | 1.36e-13 | 1.85e-01 | 0.0889 |
| 11127 | KIF3A | P9T-E | Human | Esophagus | ESCC | 4.10e-04 | 5.37e-02 | 0.1131 |
| 11127 | KIF3A | P10T-E | Human | Esophagus | ESCC | 8.00e-13 | 3.04e-01 | 0.116 |
| 11127 | KIF3A | P11T-E | Human | Esophagus | ESCC | 1.80e-09 | 2.47e-01 | 0.1426 |
| 11127 | KIF3A | P12T-E | Human | Esophagus | ESCC | 1.40e-21 | 3.80e-01 | 0.1122 |
| 11127 | KIF3A | P15T-E | Human | Esophagus | ESCC | 2.38e-12 | 2.80e-01 | 0.1149 |
| 11127 | KIF3A | P16T-E | Human | Esophagus | ESCC | 1.61e-19 | 4.20e-01 | 0.1153 |
| 11127 | KIF3A | P17T-E | Human | Esophagus | ESCC | 1.31e-02 | 2.53e-01 | 0.1278 |
| 11127 | KIF3A | P19T-E | Human | Esophagus | ESCC | 3.21e-06 | 3.14e-01 | 0.1662 |
| 11127 | KIF3A | P20T-E | Human | Esophagus | ESCC | 1.69e-17 | 2.58e-01 | 0.1124 |
| 11127 | KIF3A | P21T-E | Human | Esophagus | ESCC | 3.65e-16 | 3.12e-01 | 0.1617 |
| 11127 | KIF3A | P22T-E | Human | Esophagus | ESCC | 4.48e-25 | 4.75e-01 | 0.1236 |
| 11127 | KIF3A | P23T-E | Human | Esophagus | ESCC | 1.73e-10 | 2.56e-01 | 0.108 |
| 11127 | KIF3A | P24T-E | Human | Esophagus | ESCC | 1.27e-06 | 1.24e-01 | 0.1287 |
| Page: 1 2 3 4 5 |
| Tissue | Expression Dynamics | Abbreviation |
| Esophagus | 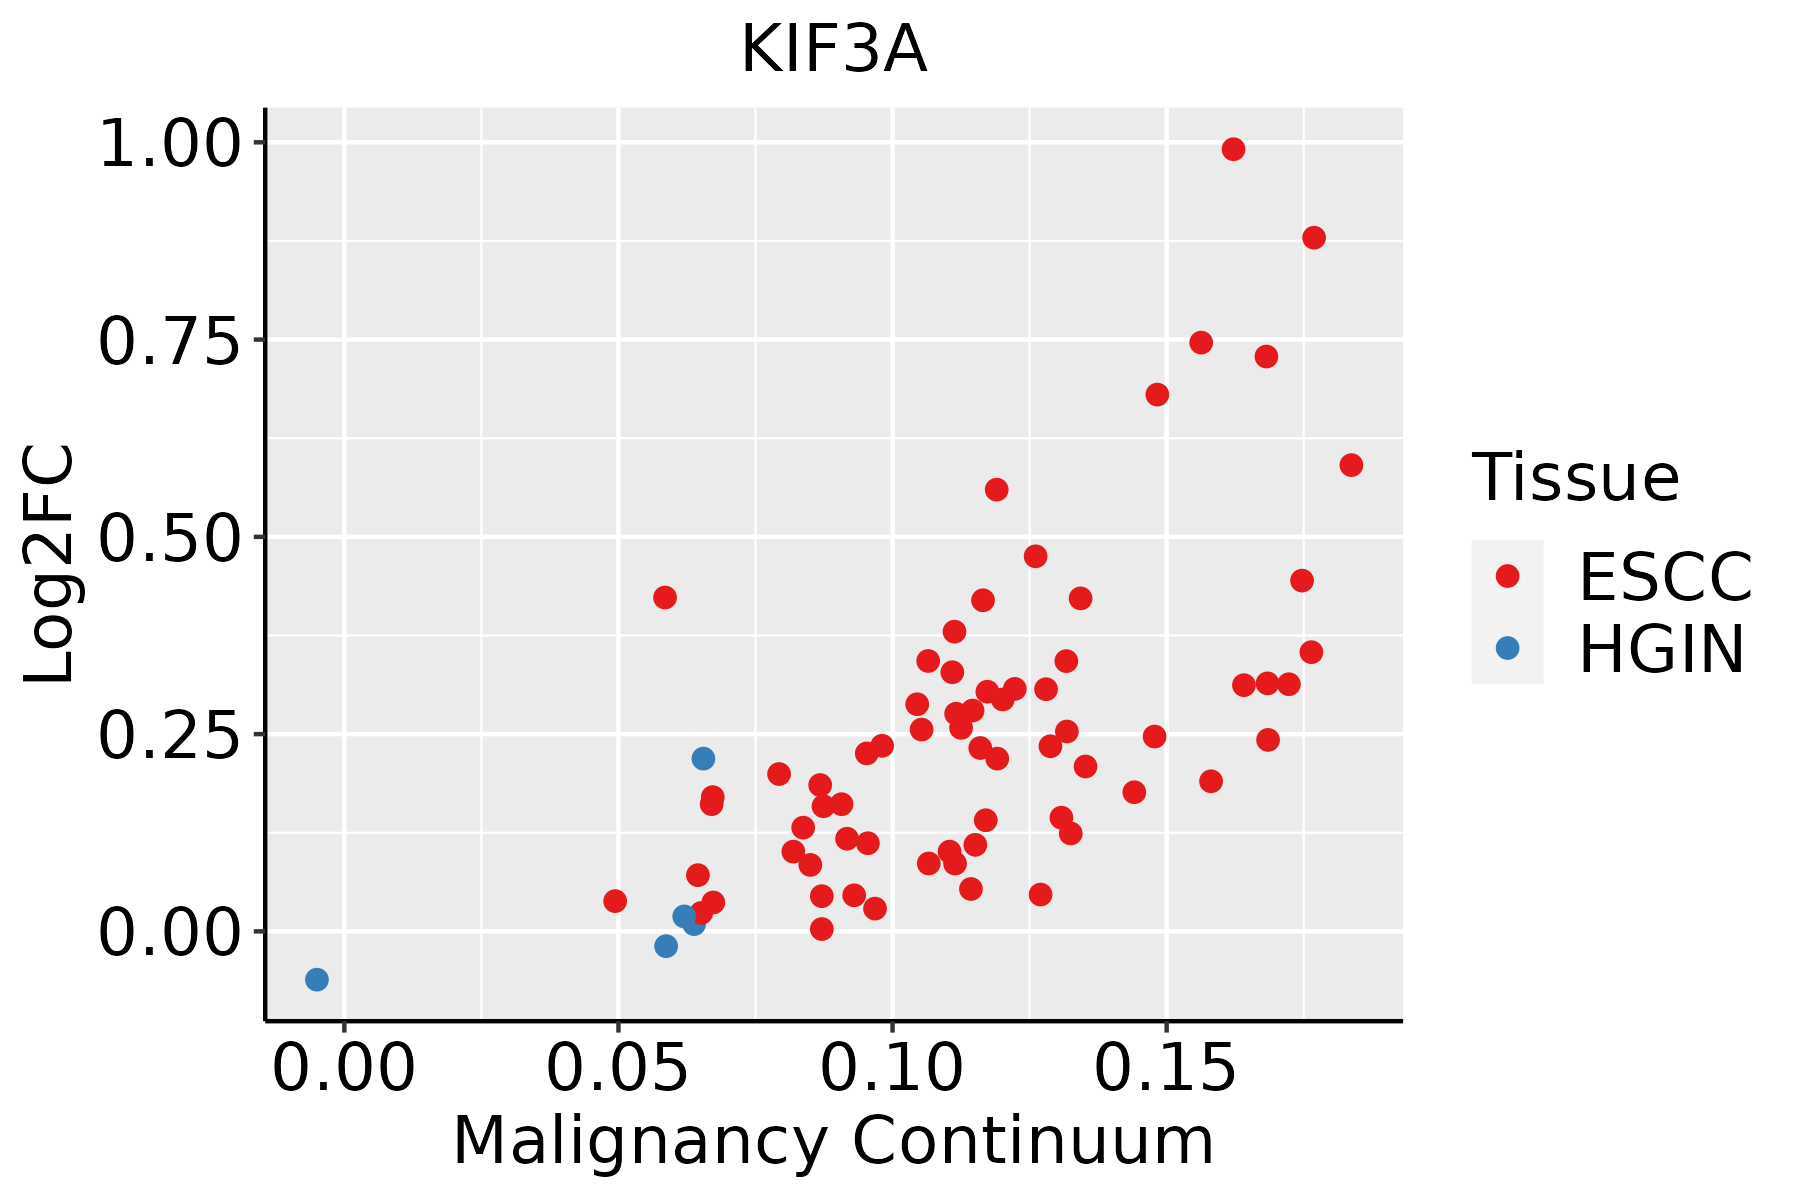 | ESCC: Esophageal squamous cell carcinoma |
| HGIN: High-grade intraepithelial neoplasias | ||
| LGIN: Low-grade intraepithelial neoplasias | ||
| Liver | 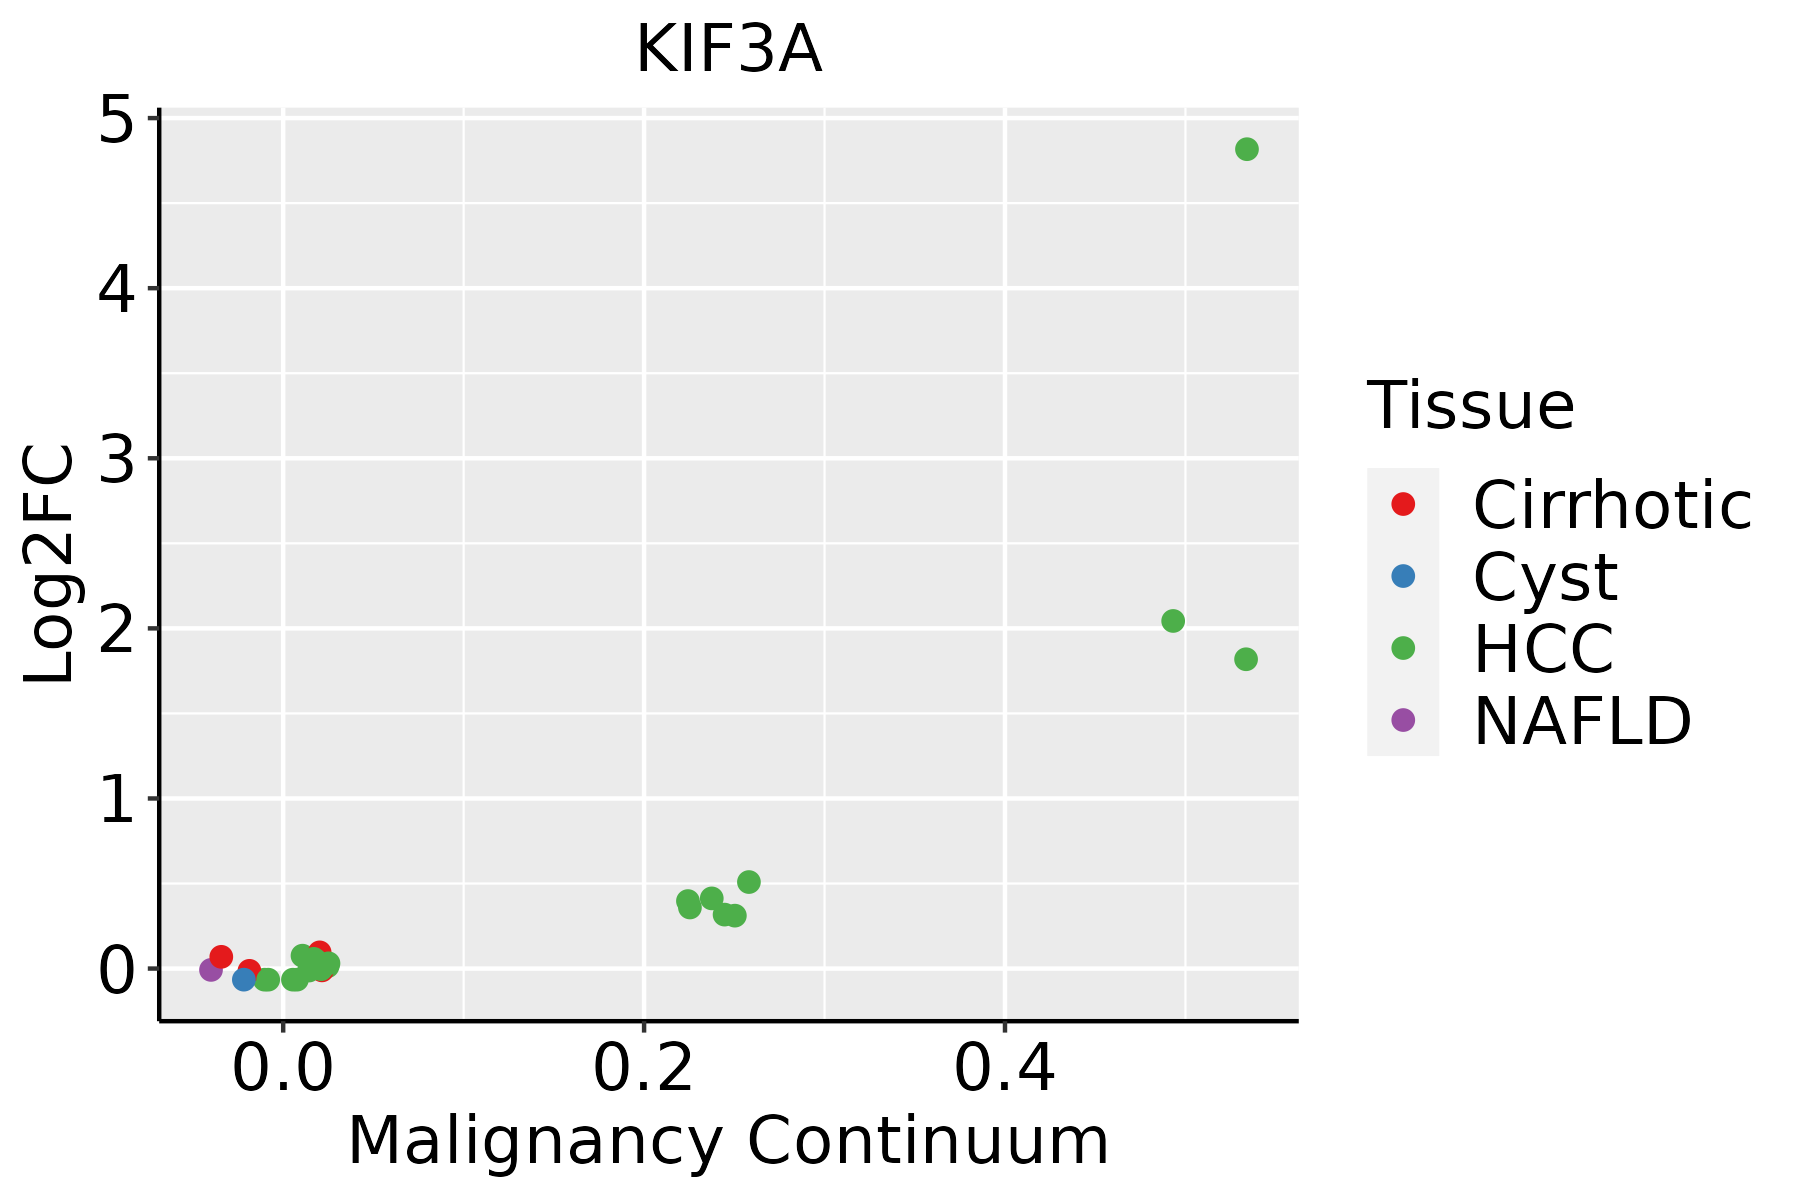 | HCC: Hepatocellular carcinoma |
| NAFLD: Non-alcoholic fatty liver disease | ||
| Oral Cavity | 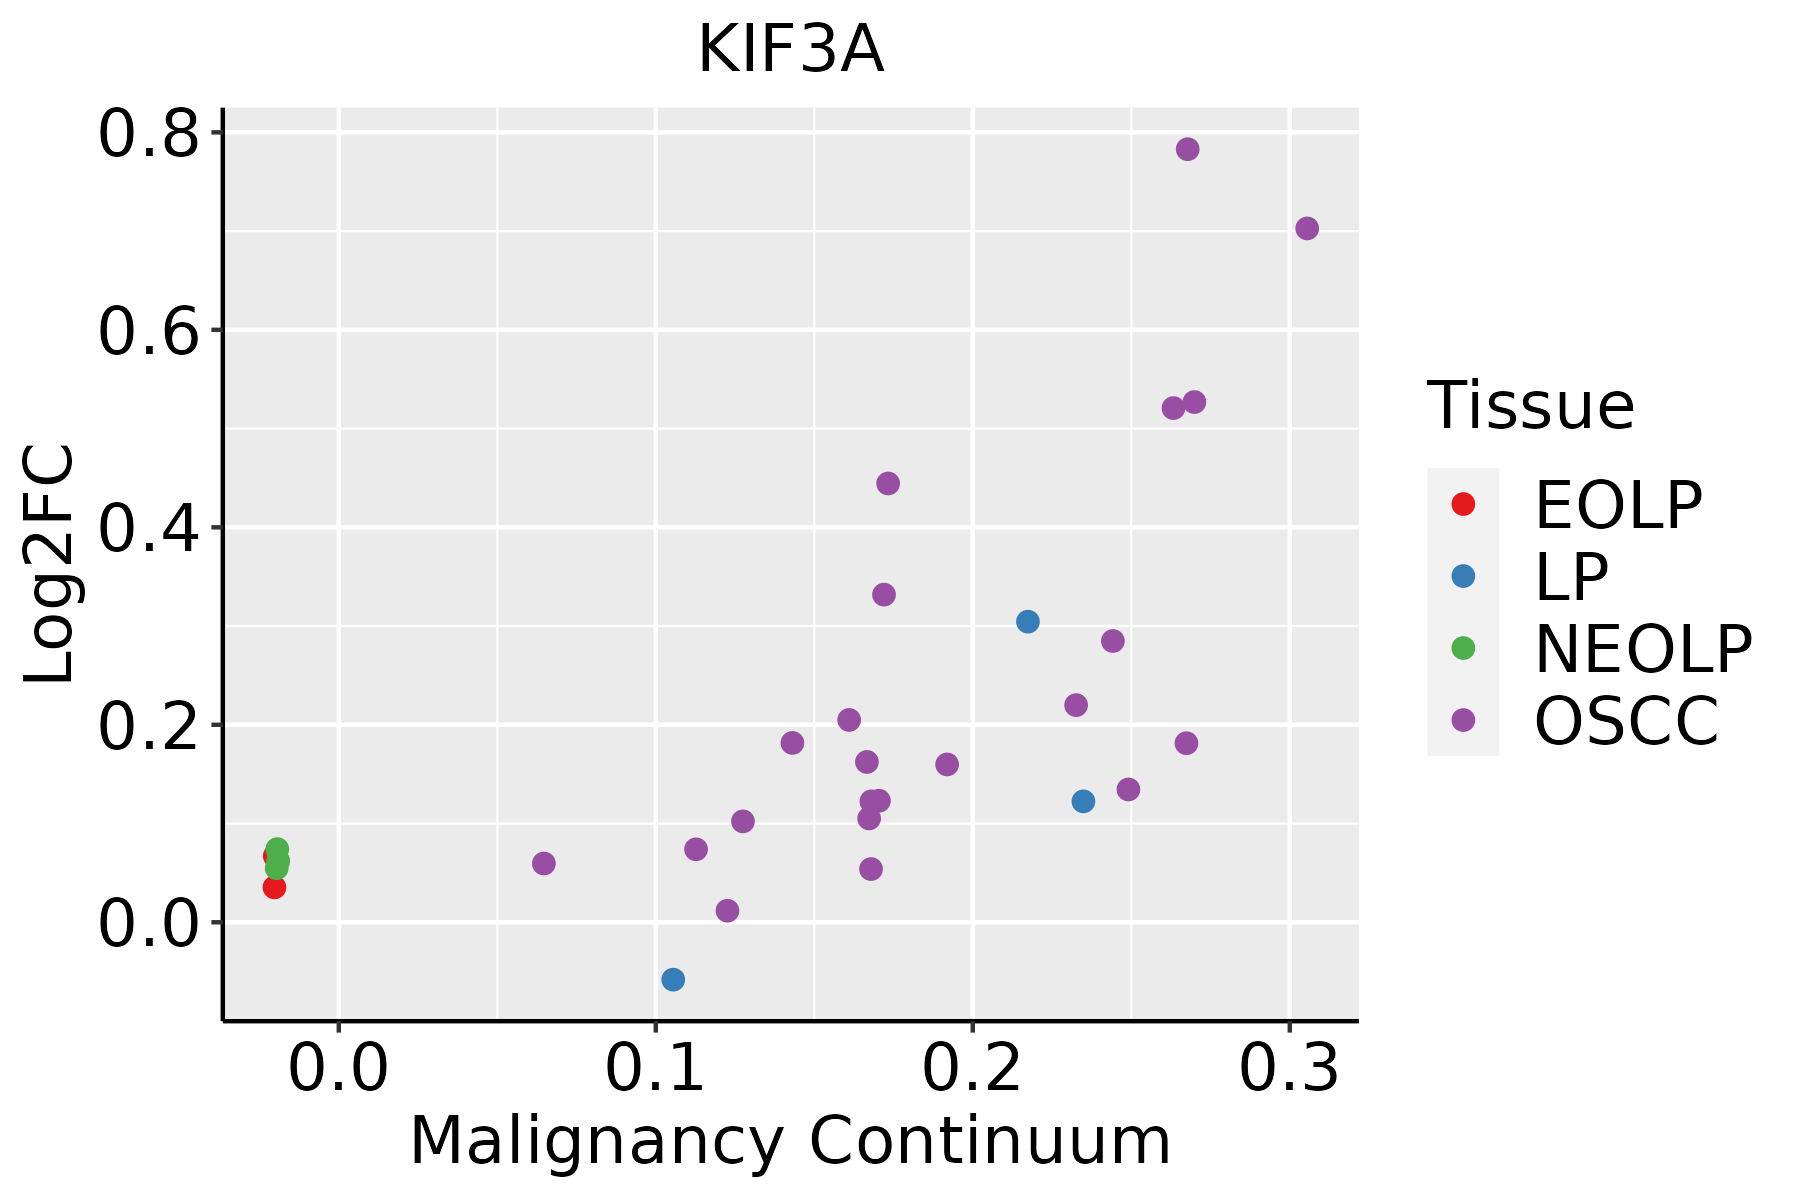 | EOLP: Erosive Oral lichen planus |
| LP: leukoplakia | ||
| NEOLP: Non-erosive oral lichen planus | ||
| OSCC: Oral squamous cell carcinoma | ||
| Thyroid | 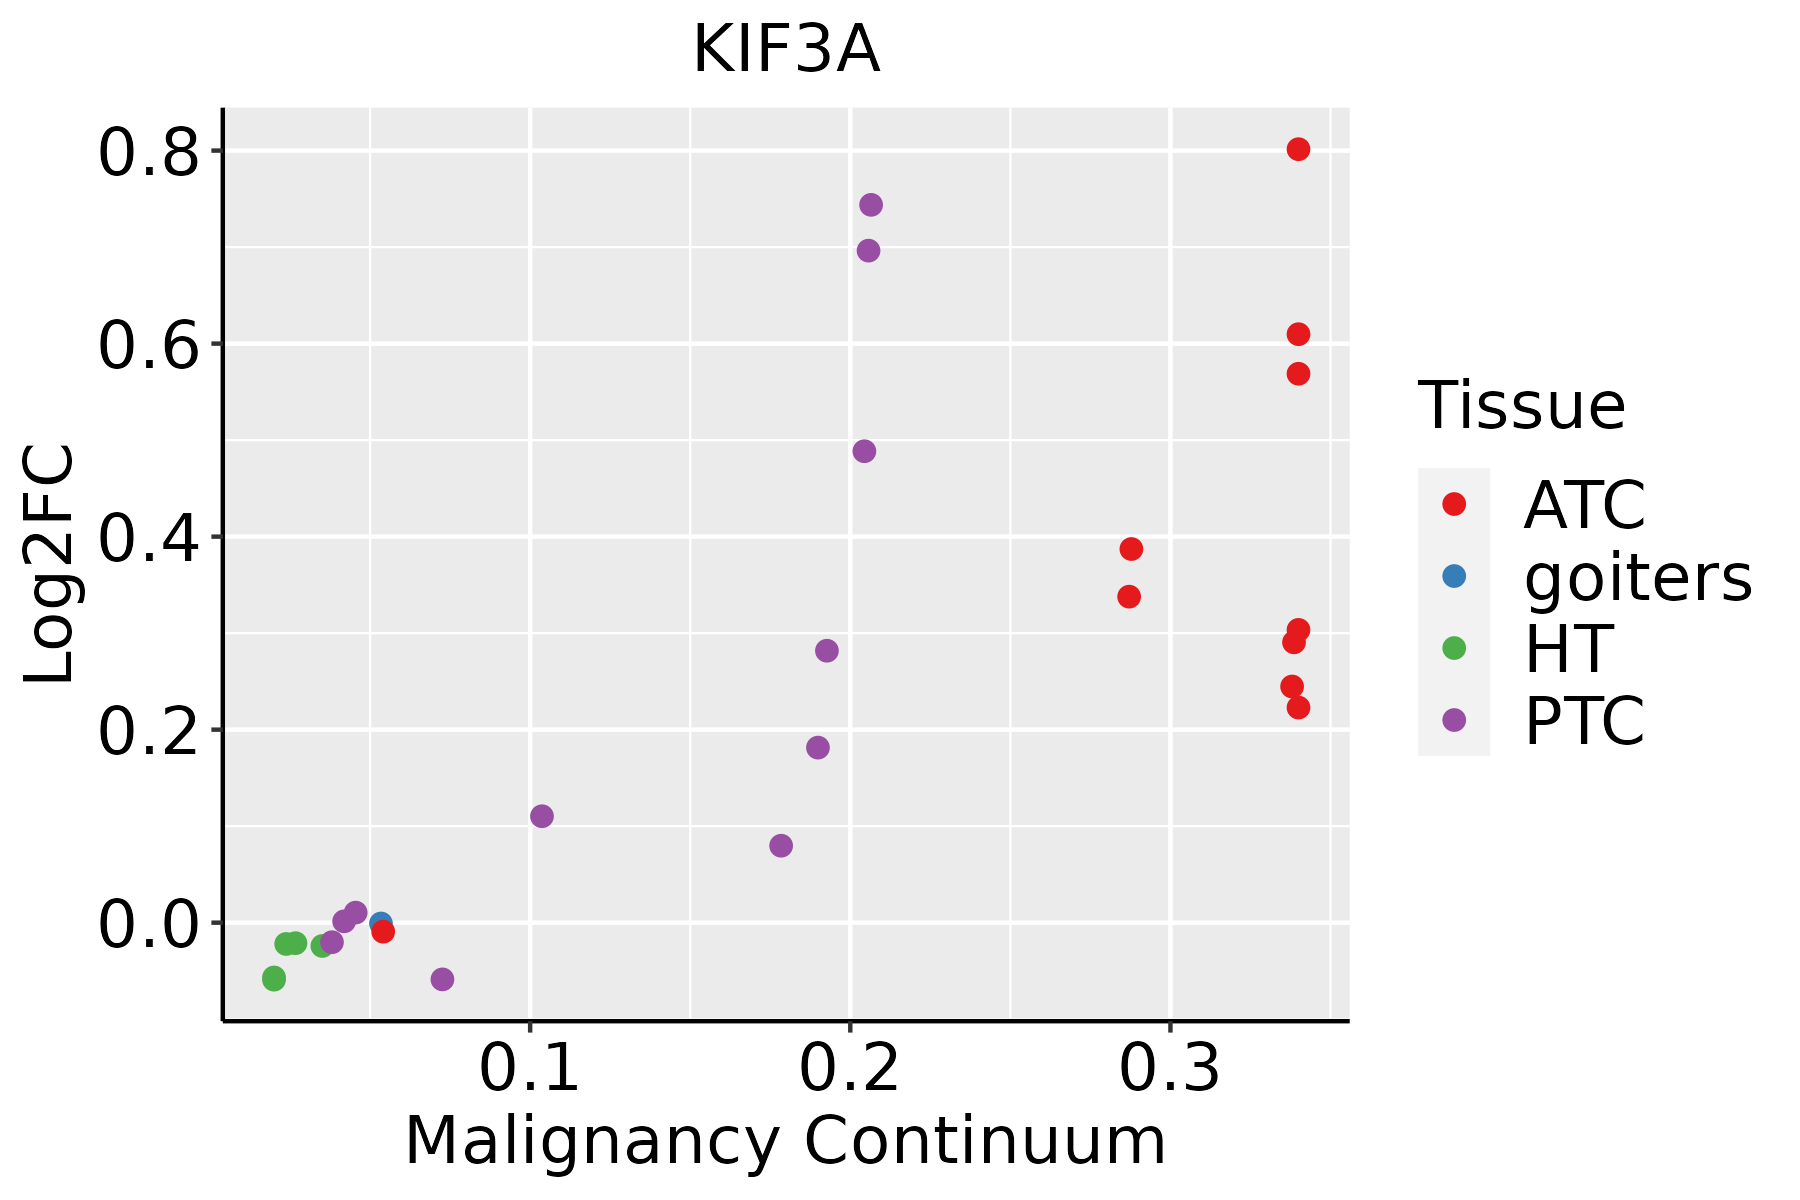 | ATC: Anaplastic thyroid cancer |
| HT: Hashimoto's thyroiditis | ||
| PTC: Papillary thyroid cancer |
| ∗log2FC in expression of this searched gene in stem-like cells from each diseased tissue sample relative to stem-like cells in normal samples in each tissue plotted against the malignancy continuum. Samples are colored based on if they are from different disease stage. |
Top |
Malignant transformation related pathway analysis |
| Find out the enriched GO biological processes and KEGG pathways involved in transition from healthy to precancer to cancer |
| Tissue | Disease Stage | Enriched GO biological Processes |
| Colorectum | AD |  |
| Colorectum | SER |  |
| Colorectum | MSS |  |
| Colorectum | MSI-H |  |
| Colorectum | FAP |  |
| ∗Top 15 enriched GO BP terms are showed in the bar plot of each disease state in each tissue. Each row represents a significant GO biological process which is colored according to the -log10(p.adjust). |
| Page: 1 2 3 4 5 6 7 8 9 |
| GO ID | Tissue | Disease Stage | Description | Gene Ratio | Bg Ratio | pvalue | p.adjust | Count |
| GO:005165617 | Esophagus | ESCC | establishment of organelle localization | 273/8552 | 390/18723 | 9.13e-23 | 1.81e-20 | 273 |
| GO:005165016 | Esophagus | ESCC | establishment of vesicle localization | 114/8552 | 161/18723 | 8.20e-11 | 2.53e-09 | 114 |
| GO:003070518 | Esophagus | ESCC | cytoskeleton-dependent intracellular transport | 133/8552 | 195/18723 | 1.48e-10 | 4.27e-09 | 133 |
| GO:001097013 | Esophagus | ESCC | transport along microtubule | 107/8552 | 155/18723 | 3.17e-09 | 6.80e-08 | 107 |
| GO:005164815 | Esophagus | ESCC | vesicle localization | 119/8552 | 177/18723 | 5.16e-09 | 1.08e-07 | 119 |
| GO:00723846 | Esophagus | ESCC | organelle transport along microtubule | 65/8552 | 85/18723 | 6.61e-09 | 1.35e-07 | 65 |
| GO:000808810 | Esophagus | ESCC | axo-dendritic transport | 58/8552 | 75/18723 | 2.09e-08 | 4.02e-07 | 58 |
| GO:00989304 | Esophagus | ESCC | axonal transport | 49/8552 | 64/18723 | 4.54e-07 | 6.15e-06 | 49 |
| GO:00070982 | Esophagus | ESCC | centrosome cycle | 85/8552 | 130/18723 | 4.41e-06 | 4.69e-05 | 85 |
| GO:00310233 | Esophagus | ESCC | microtubule organizing center organization | 92/8552 | 143/18723 | 5.04e-06 | 5.31e-05 | 92 |
| GO:00474962 | Esophagus | ESCC | vesicle transport along microtubule | 36/8552 | 47/18723 | 1.53e-05 | 1.38e-04 | 36 |
| GO:00991114 | Esophagus | ESCC | microtubule-based transport | 115/8552 | 190/18723 | 2.54e-05 | 2.15e-04 | 115 |
| GO:00080892 | Esophagus | ESCC | anterograde axonal transport | 37/8552 | 50/18723 | 4.42e-05 | 3.51e-04 | 37 |
| GO:00995185 | Esophagus | ESCC | vesicle cytoskeletal trafficking | 50/8552 | 73/18723 | 6.75e-05 | 5.12e-04 | 50 |
| GO:0010457 | Esophagus | ESCC | centriole-centriole cohesion | 12/8552 | 14/18723 | 2.51e-03 | 1.08e-02 | 12 |
| GO:005165621 | Liver | HCC | establishment of organelle localization | 226/7958 | 390/18723 | 4.15e-10 | 1.34e-08 | 226 |
| GO:005165021 | Liver | HCC | establishment of vesicle localization | 103/7958 | 161/18723 | 2.94e-08 | 6.69e-07 | 103 |
| GO:005164821 | Liver | HCC | vesicle localization | 107/7958 | 177/18723 | 1.05e-06 | 1.57e-05 | 107 |
| GO:00080882 | Liver | HCC | axo-dendritic transport | 52/7958 | 75/18723 | 2.34e-06 | 3.14e-05 | 52 |
| GO:00723843 | Liver | HCC | organelle transport along microtubule | 56/7958 | 85/18723 | 1.13e-05 | 1.29e-04 | 56 |
| Page: 1 2 3 4 |
| Pathway ID | Tissue | Disease Stage | Description | Gene Ratio | Bg Ratio | pvalue | p.adjust | qvalue | Count |
| Page: 1 |
Top |
Cell-cell communication analysis |
| Identification of potential cell-cell interactions between two cell types and their ligand-receptor pairs for different disease states |
| Ligand | Receptor | LRpair | Pathway | Tissue | Disease Stage |
| Page: 1 |
Top |
Single-cell gene regulatory network inference analysis |
| Find out the significant the regulons (TFs) and the target genes of each regulon across cell types for different disease states |
| TF | Cell Type | Tissue | Disease Stage | Target Gene | RSS | Regulon Activity |
| ∗The dot plots of a searched regulon are shown for all cell subpopulations in each disease state of each tissue based on the regulon specific score inferred using pySCENIC and by calculating the average expression. |
| Page: 1 |
Top |
Somatic mutation of malignant transformation related genes |
| Annotation of somatic variants for genes involved in malignant transformation |
| Hugo Symbol | Variant Class | Variant Classification | dbSNP RS | HGVSc | HGVSp | HGVSp Short | SWISSPROT | BIOTYPE | SIFT | PolyPhen | Tumor Sample Barcode | Tissue | Histology | Sex | Age | Stage | Therapy Types | Drugs | Outcome |
| KIF3A | SNV | Missense_Mutation | c.1628G>T | p.Arg543Ile | p.R543I | protein_coding | deleterious(0.01) | benign(0.093) | TCGA-BH-A0BZ-01 | Breast | breast invasive carcinoma | Female | <65 | III/IV | Chemotherapy | doxorubicin | CR | ||
| KIF3A | SNV | Missense_Mutation | c.2055N>C | p.Glu685Asp | p.E685D | protein_coding | tolerated(0.31) | possibly_damaging(0.899) | TCGA-E2-A1LG-01 | Breast | breast invasive carcinoma | Female | <65 | I/II | Chemotherapy | doxorubicin | SD | ||
| KIF3A | SNV | Missense_Mutation | novel | c.392N>G | p.Phe131Cys | p.F131C | protein_coding | deleterious(0) | probably_damaging(1) | TCGA-W8-A86G-01 | Breast | breast invasive carcinoma | Female | >=65 | I/II | Hormone Therapy | arimidex | SD | |
| KIF3A | SNV | Missense_Mutation | rs754855003 | c.1022G>A | p.Arg341His | p.R341H | protein_coding | deleterious(0) | probably_damaging(1) | TCGA-2W-A8YY-01 | Cervix | cervical & endocervical cancer | Female | <65 | I/II | Chemotherapy | cisplatin | CR | |
| KIF3A | SNV | Missense_Mutation | novel | c.1081C>T | p.Arg361Cys | p.R361C | protein_coding | deleterious(0) | probably_damaging(0.999) | TCGA-EA-A410-01 | Cervix | cervical & endocervical cancer | Female | <65 | I/II | Unknown | Unknown | SD | |
| KIF3A | SNV | Missense_Mutation | novel | c.1252N>A | p.Asp418Asn | p.D418N | protein_coding | tolerated(0.18) | benign(0.245) | TCGA-IR-A3LH-01 | Cervix | cervical & endocervical cancer | Female | <65 | I/II | Chemotherapy | cisplatin | CR | |
| KIF3A | SNV | Missense_Mutation | c.1352C>T | p.Ala451Val | p.A451V | protein_coding | tolerated(0.2) | probably_damaging(0.935) | TCGA-AA-3663-01 | Colorectum | colon adenocarcinoma | Male | <65 | I/II | Unknown | Unknown | SD | ||
| KIF3A | SNV | Missense_Mutation | rs771666064 | c.1009N>T | p.Arg337Trp | p.R337W | protein_coding | deleterious(0) | probably_damaging(1) | TCGA-AA-3664-01 | Colorectum | colon adenocarcinoma | Female | >=65 | I/II | Unknown | Unknown | SD | |
| KIF3A | SNV | Missense_Mutation | c.1786N>G | p.Arg596Gly | p.R596G | protein_coding | deleterious(0.01) | benign(0) | TCGA-AA-3811-01 | Colorectum | colon adenocarcinoma | Female | >=65 | III/IV | Unknown | Unknown | PD | ||
| KIF3A | SNV | Missense_Mutation | novel | c.1285N>A | p.Asp429Asn | p.D429N | protein_coding | tolerated(0.21) | benign(0.135) | TCGA-AA-3869-01 | Colorectum | colon adenocarcinoma | Male | >=65 | III/IV | Chemotherapy | capecitabine | PD |
| Page: 1 2 3 4 5 6 7 8 |
Top |
Related drugs of malignant transformation related genes |
| Identification of chemicals and drugs interact with genes involved in malignant transfromation |
| (DGIdb 4.0) |
| Entrez ID | Symbol | Category | Interaction Types | Drug Claim Name | Drug Name | PMIDs |
| Page: 1 |

Copyright 2023-Present -The University of Texas Health Science Center at Houston |