Schematic overview of the cellular and molecular mechanisms involved in the cancer progression, including the proposed cellular and molecular mechanisms in cancer cells trajectory. AT1: alveolar type 1 cells; AT2: alveolar type 2 cells; AAH: atypical adenomatous hyperplasia; AIS: adenocarcinoma in situ; MIA: minimally invasive adenocarcinoma; IA: invasive adenocarcinoma; EMT: epithelial-mesenchymal transition

Home

Download

Statistics

Help

Contact

Center for Computational Systems Medicine
leaf

Gene summary

leaf

Malignant transformation analysis

leaf

Malignant transformation related pathway analysis

leaf

Cell-cell communication analysis

leaf

Single-cell gene regulatory network inference analysis

leaf

Somatic mutation of malignant transformation related genes

leaf

Related drugs of malignant transformation related genes

Gene: KIF2C

Gene summary for KIF2C

check button Gene summary.

Gene informationSpeciesHuman
Gene symbol

KIF2C

Gene ID

11004

Gene namekinesin family member 2C
Gene AliasCT139
Cytomap1p34.1
Gene Typeprotein-coding
GO ID

GO:0000070

UniProtAcc

B7Z6Q6


Top

Malignant transformation analysis

check button Identification of the aberrant gene expression in precancerous and cancerous lesions by comparing the gene expression of stem-like cells in diseased tissues with normal stem cells
check button Malignant transformation involving gene list.
Entrez IDSymbolReplicatesSpeciesOrganTissueAdj P-valueLog2FCMalignancy
11004KIF2CLZE2THumanEsophagusESCC2.18e-047.78e-010.082
11004KIF2CLZE22THumanEsophagusESCC1.57e-023.08e-010.068
11004KIF2CP2T-EHumanEsophagusESCC9.53e-093.71e-010.1177
11004KIF2CP5T-EHumanEsophagusESCC3.60e-133.65e-010.1327
11004KIF2CP10T-EHumanEsophagusESCC8.40e-041.47e-010.116
11004KIF2CP15T-EHumanEsophagusESCC2.11e-031.81e-010.1149
11004KIF2CP16T-EHumanEsophagusESCC1.66e-026.58e-020.1153
11004KIF2CP17T-EHumanEsophagusESCC4.48e-074.69e-010.1278
11004KIF2CP20T-EHumanEsophagusESCC2.18e-031.53e-010.1124
11004KIF2CP21T-EHumanEsophagusESCC2.02e-062.47e-010.1617
11004KIF2CP24T-EHumanEsophagusESCC1.88e-041.82e-010.1287
11004KIF2CP28T-EHumanEsophagusESCC8.40e-041.16e-010.1149
11004KIF2CP31T-EHumanEsophagusESCC4.17e-052.23e-010.1251
11004KIF2CP32T-EHumanEsophagusESCC9.02e-113.11e-010.1666
11004KIF2CP36T-EHumanEsophagusESCC2.82e-021.18e-010.1187
11004KIF2CP37T-EHumanEsophagusESCC6.05e-082.52e-010.1371
11004KIF2CP38T-EHumanEsophagusESCC5.18e-031.45e-010.127
11004KIF2CP44T-EHumanEsophagusESCC7.53e-031.47e-010.1096
11004KIF2CP52T-EHumanEsophagusESCC9.44e-072.49e-010.1555
11004KIF2CP62T-EHumanEsophagusESCC1.20e-021.38e-010.1302
Page: 1 2 3 

check button Transcriptomic changes along malignancy continuum.
TissueExpression DynamicsAbbreviation
EsophagusThe image shows the transcriptomic changes along malignancy continuum.log2FC in expression of this searched gene in stem-like cells from each diseased tissue sample relative to stem-like cells in normal samples in each tissue plotted against the malignancy continuum. Samples are colored based on if they are from different disease stage.
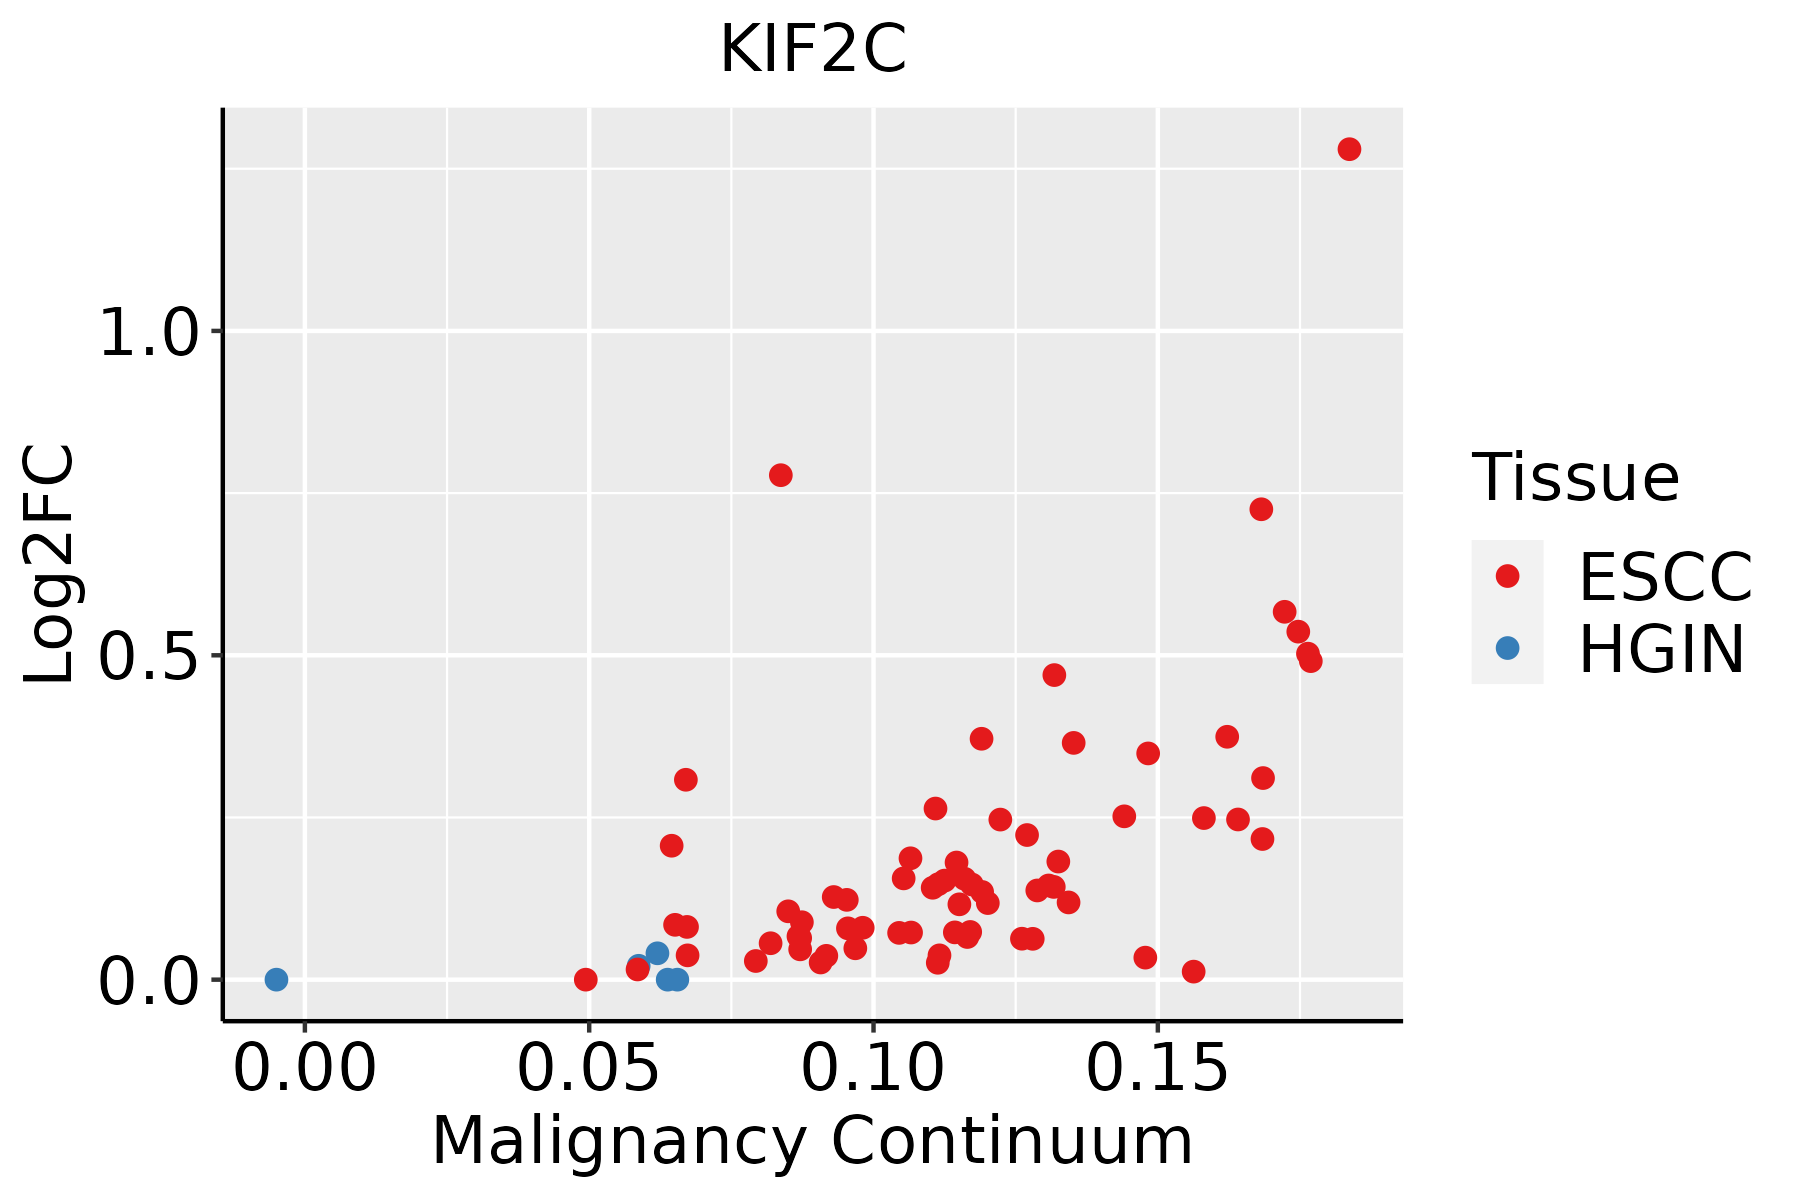
ESCC: Esophageal squamous cell carcinoma
HGIN: High-grade intraepithelial neoplasias
LGIN: Low-grade intraepithelial neoplasias
Oral CavityThe image shows the transcriptomic changes along malignancy continuum.log2FC in expression of this searched gene in stem-like cells from each diseased tissue sample relative to stem-like cells in normal samples in each tissue plotted against the malignancy continuum. Samples are colored based on if they are from different disease stage.
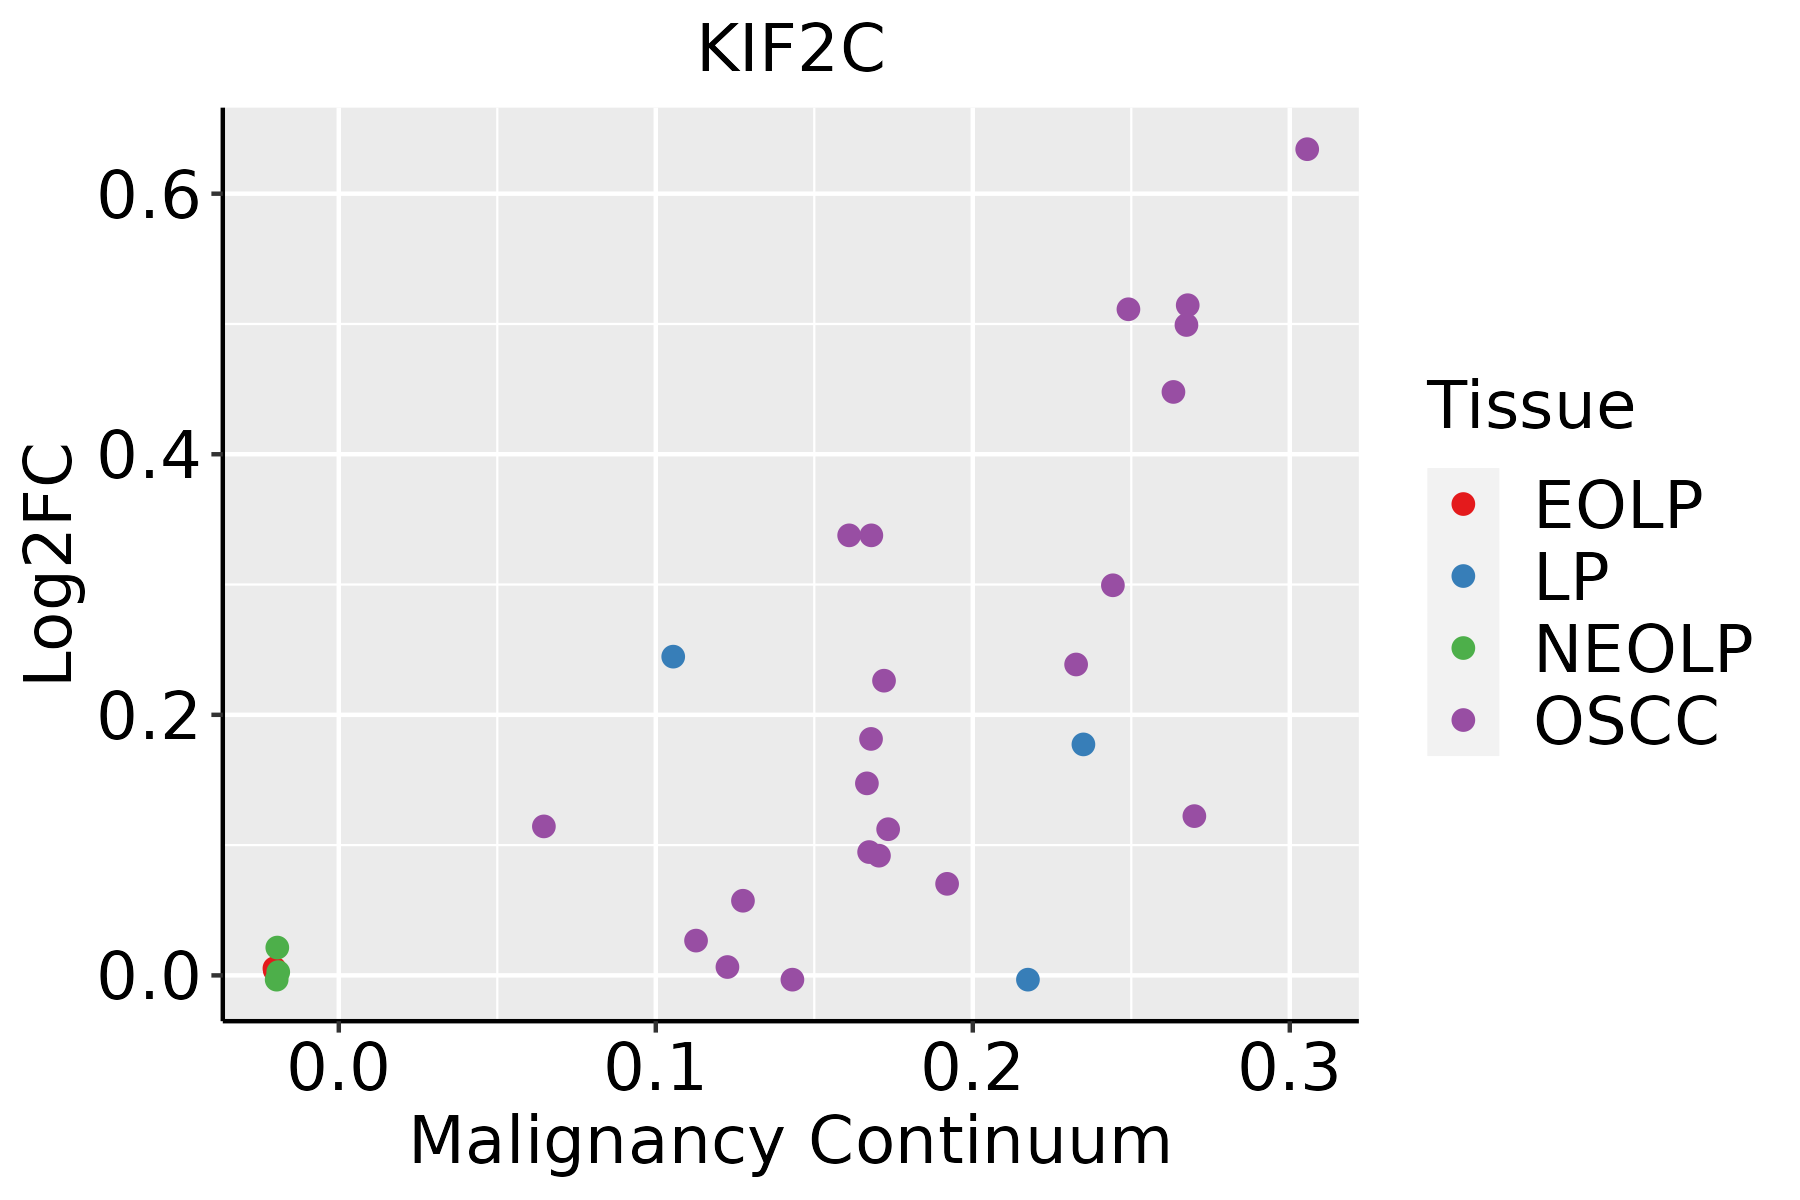
EOLP: Erosive Oral lichen planus
LP: leukoplakia
NEOLP: Non-erosive oral lichen planus
OSCC: Oral squamous cell carcinoma
SkinThe image shows the transcriptomic changes along malignancy continuum.log2FC in expression of this searched gene in stem-like cells from each diseased tissue sample relative to stem-like cells in normal samples in each tissue plotted against the malignancy continuum. Samples are colored based on if they are from different disease stage.AK: Actinic keratosis
cSCC: Cutaneous squamous cell carcinoma
SCCIS:squamous cell carcinoma in situ
ThyroidThe image shows the transcriptomic changes along malignancy continuum.log2FC in expression of this searched gene in stem-like cells from each diseased tissue sample relative to stem-like cells in normal samples in each tissue plotted against the malignancy continuum. Samples are colored based on if they are from different disease stage.
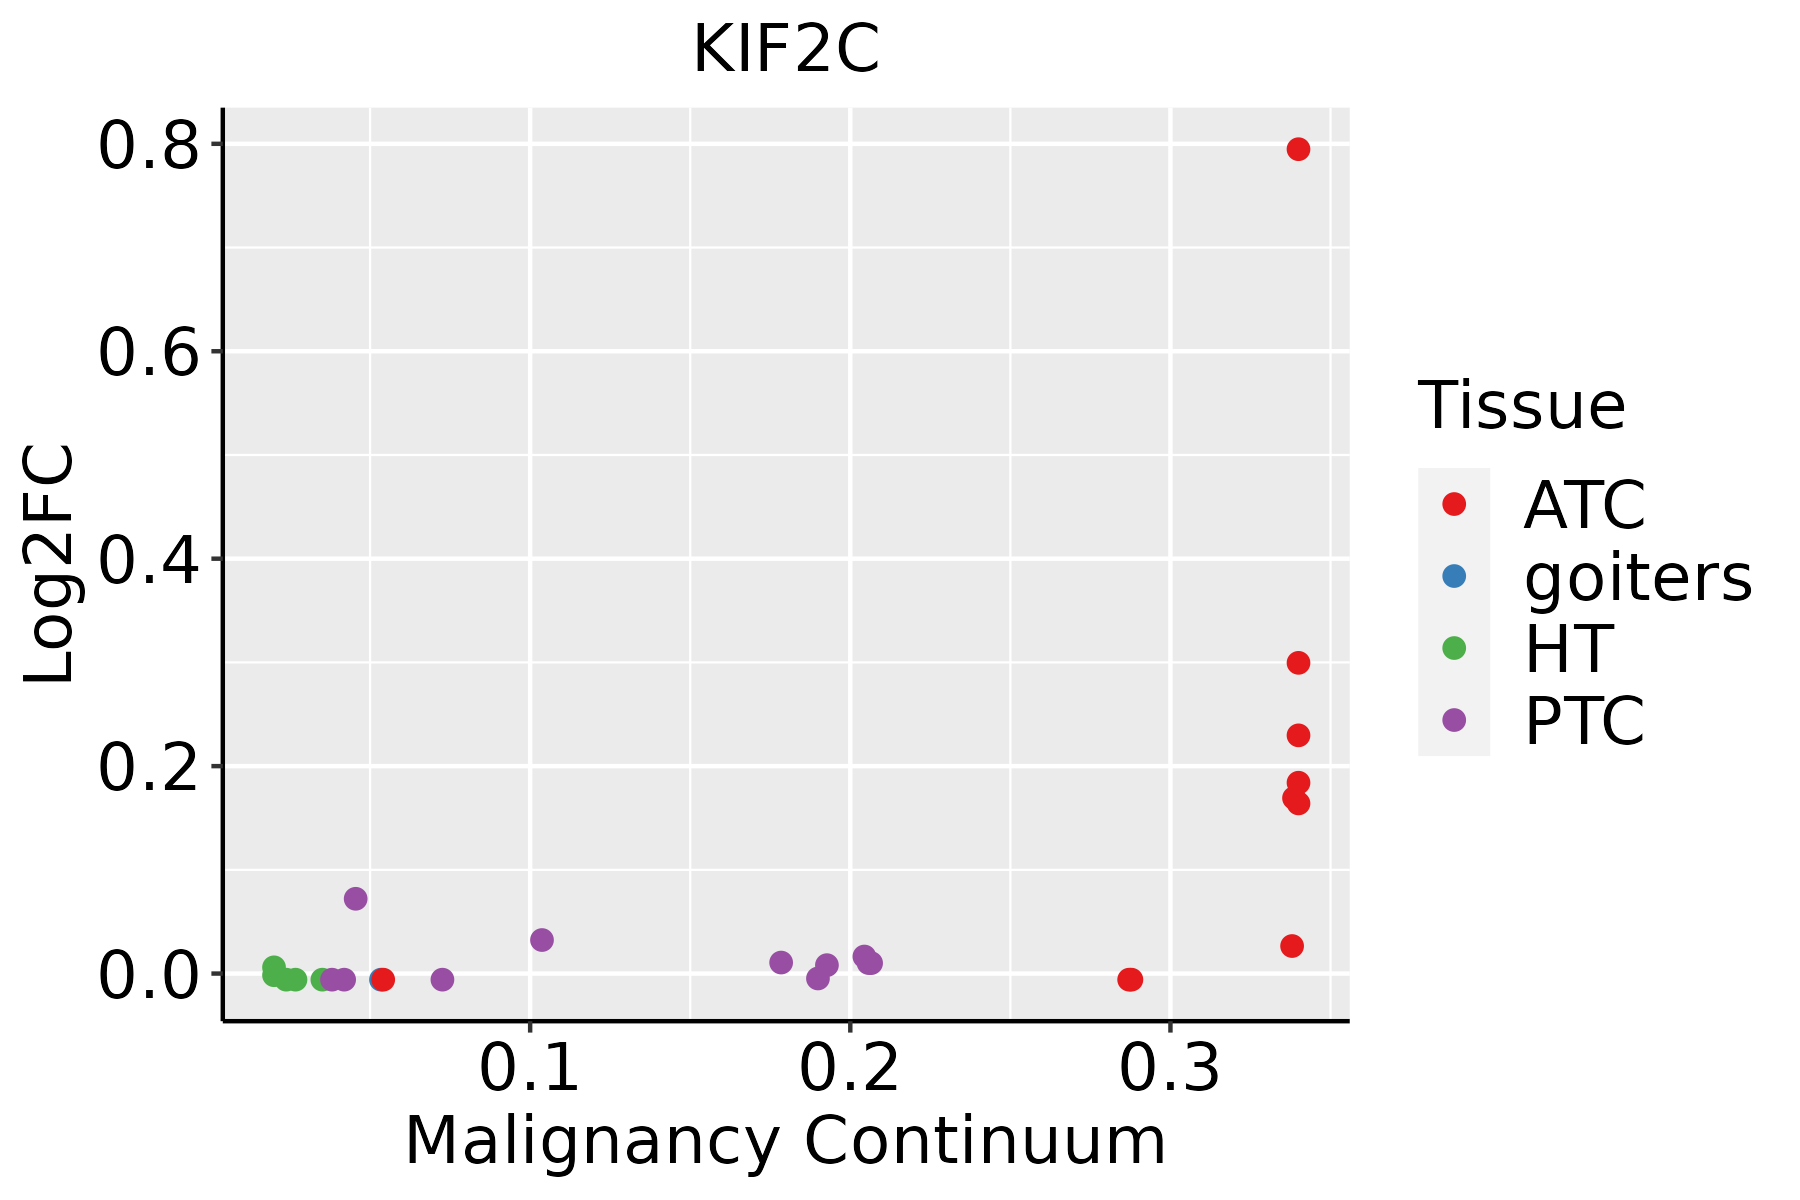
ATC: Anaplastic thyroid cancer
HT: Hashimoto's thyroiditis
PTC: Papillary thyroid cancer
∗log2FC in expression of this searched gene in stem-like cells from each diseased tissue sample relative to stem-like cells in normal samples in each tissue plotted against the malignancy continuum. Samples are colored based on if they are from different disease stage.

Top

Malignant transformation related pathway analysis

check buttonFind out the enriched GO biological processes and KEGG pathways involved in transition from healthy to precancer to cancer
check button Figure of enriched GO biological processes.
TissueDisease StageEnriched GO biological Processes
ColorectumADGO analysis - Figure of enriched GO biological processes: Top 15 enriched GO BP terms are showed in the bar plot of each disease state in each tissue. Each row represents a significant GO biological process which is colored according to the -log10(p.adjust).
ColorectumSERGO analysis - Figure of enriched GO biological processes: Top 15 enriched GO BP terms are showed in the bar plot of each disease state in each tissue. Each row represents a significant GO biological process which is colored according to the -log10(p.adjust).
ColorectumMSSGO analysis - Figure of enriched GO biological processes: Top 15 enriched GO BP terms are showed in the bar plot of each disease state in each tissue. Each row represents a significant GO biological process which is colored according to the -log10(p.adjust).
ColorectumMSI-HGO analysis - Figure of enriched GO biological processes: Top 15 enriched GO BP terms are showed in the bar plot of each disease state in each tissue. Each row represents a significant GO biological process which is colored according to the -log10(p.adjust).
ColorectumFAPGO analysis - Figure of enriched GO biological processes: Top 15 enriched GO BP terms are showed in the bar plot of each disease state in each tissue. Each row represents a significant GO biological process which is colored according to the -log10(p.adjust).
∗Top 15 enriched GO BP terms are showed in the bar plot of each disease state in each tissue. Each row represents a significant GO biological process which is colored according to the -log10(p.adjust).
Page: 1 2 3 4 5 6 7 8 9 

check button Enriched GO biological processes.
GO IDTissueDisease StageDescriptionGene RatioBg Ratiopvaluep.adjustCount
GO:014001414EsophagusESCCmitotic nuclear division218/8552287/187236.17e-261.78e-23218
GO:0022411111EsophagusESCCcellular component disassembly305/8552443/187231.94e-234.57e-21305
GO:005165617EsophagusESCCestablishment of organelle localization273/8552390/187239.13e-231.81e-20273
GO:000007011EsophagusESCCmitotic sister chromatid segregation138/8552168/187231.37e-222.63e-20138
GO:00008194EsophagusESCCsister chromatid segregation157/8552202/187238.41e-211.33e-18157
GO:000705911EsophagusESCCchromosome segregation238/8552346/187231.72e-181.82e-16238
GO:005131011EsophagusESCCmetaphase plate congression58/855265/187231.81e-138.63e-1258
GO:000708011EsophagusESCCmitotic metaphase plate congression47/855250/187233.15e-131.47e-1147
GO:00482853EsophagusESCCorganelle fission301/8552488/187234.64e-132.12e-11301
GO:00988133EsophagusESCCnuclear chromosome segregation187/8552281/187231.00e-124.36e-11187
GO:005130311EsophagusESCCestablishment of chromosome localization67/855280/187231.92e-128.09e-1167
GO:005000011EsophagusESCCchromosome localization68/855282/187233.37e-121.32e-1068
GO:00002802EsophagusESCCnuclear division270/8552439/187231.17e-114.24e-10270
GO:003298416EsophagusESCCprotein-containing complex disassembly151/8552224/187233.45e-111.15e-09151
GO:000716320EsophagusESCCestablishment or maintenance of cell polarity143/8552218/187232.05e-094.65e-08143
GO:00519833EsophagusESCCregulation of chromosome segregation67/855291/187235.42e-089.66e-0767
GO:00086081EsophagusESCCattachment of spindle microtubules to kinetochore29/855235/187236.61e-066.75e-0529
GO:00513151EsophagusESCCattachment of mitotic spindle microtubules to kinetochore15/855215/187237.81e-067.69e-0515
GO:00311094EsophagusESCCmicrotubule polymerization or depolymerization77/8552122/187237.60e-055.68e-0477
GO:00436245EsophagusESCCcellular protein complex disassembly78/8552136/187234.00e-031.62e-0278
Page: 1 2 3 4 

check button Enriched KEGG pathways.
Pathway IDTissueDisease StageDescriptionGene RatioBg Ratiopvaluep.adjustqvalueCount
Page: 1 

Top

Cell-cell communication analysis

check buttonIdentification of potential cell-cell interactions between two cell types and their ligand-receptor pairs for different disease states
LigandReceptorLRpairPathwayTissueDisease Stage
Page: 1 

Top

Single-cell gene regulatory network inference analysis

check buttonFind out the significant the regulons (TFs) and the target genes of each regulon across cell types for different disease states
TFCell TypeTissueDisease StageTarget GeneRSSRegulon Activity
∗The dot plots of a searched regulon are shown for all cell subpopulations in each disease state of each tissue based on the regulon specific score inferred using pySCENIC and by calculating the average expression.
Page: 1 

Top

Somatic mutation of malignant transformation related genes

check buttonAnnotation of somatic variants for genes involved in malignant transformation
Hugo SymbolVariant ClassVariant ClassificationdbSNP RSHGVScHGVSpHGVSp ShortSWISSPROTBIOTYPESIFTPolyPhenTumor Sample BarcodeTissueHistologySexAgeStageTherapy TypesDrugsOutcome
KIF2CSNVMissense_Mutationc.1739G>Cp.Arg580Thrp.R580TQ99661protein_codingdeleterious(0)probably_damaging(0.999)TCGA-A8-A09N-01Breastbreast invasive carcinomaFemale<65III/IVUnknownUnknownSD
KIF2CSNVMissense_Mutationrs760237957c.278N>Ap.Arg93Glnp.R93QQ99661protein_codingdeleterious(0.01)benign(0.011)TCGA-AR-A0U3-01Breastbreast invasive carcinomaFemale<65I/IIChemotherapydoxorubicinSD
KIF2CSNVMissense_Mutationc.1270G>Ap.Asp424Asnp.D424NQ99661protein_codingdeleterious(0)probably_damaging(0.99)TCGA-C8-A12K-01Breastbreast invasive carcinomaFemale>=65I/IIUnknownUnknownSD
KIF2CSNVMissense_Mutationnovelc.835G>Cp.Asp279Hisp.D279HQ99661protein_codingdeleterious(0)probably_damaging(1)TCGA-EW-A6SB-01Breastbreast invasive carcinomaFemale<65I/IIUnknownUnknownSD
KIF2CinsertionFrame_Shift_Insnovelc.1211_1212insGGp.Ile404MetfsTer46p.I404Mfs*46Q99661protein_codingTCGA-A8-A095-01Breastbreast invasive carcinomaFemale<65I/IIChemotherapy5-fluorouracilCR
KIF2CinsertionNonsense_Mutationnovelc.1212_1213insCCATCCTTGAGTGGATACTGAATGAGGTATCACCCGTp.Tyr405ProfsTer7p.Y405Pfs*7Q99661protein_codingTCGA-A8-A095-01Breastbreast invasive carcinomaFemale<65I/IIChemotherapy5-fluorouracilCR
KIF2CinsertionFrame_Shift_Insnovelc.1313_1314insCTATGCCATGGCCTGTAAGTACTGTGTACTGCTGCTTCAGp.Val439TyrfsTer15p.V439Yfs*15Q99661protein_codingTCGA-BH-A0B8-01Breastbreast invasive carcinomaFemale<65I/IIHormone TherapyarimidexSD
KIF2CinsertionFrame_Shift_Insnovelc.1321_1322insCGp.Ala442LeufsTer8p.A442Lfs*8Q99661protein_codingTCGA-BH-A0HF-01Breastbreast invasive carcinomaFemale>=65I/IIHormone TherapyarimidexSD
KIF2CinsertionNonsense_Mutationnovelc.1323_1324insTTCCTTAGAGTGGGATCTAGATAATAAAAATAp.Ala442PhefsTer8p.A442Ffs*8Q99661protein_codingTCGA-BH-A0HF-01Breastbreast invasive carcinomaFemale>=65I/IIHormone TherapyarimidexSD
KIF2CdeletionFrame_Shift_Delnovelc.364delAp.Ile122SerfsTer41p.I122Sfs*41Q99661protein_codingTCGA-D8-A27V-01Breastbreast invasive carcinomaFemale<65I/IIHormone TherapytamoxiphenSD
Page: 1 2 3 4 5 6 7 8 9 10 

Top

Related drugs of malignant transformation related genes

check buttonIdentification of chemicals and drugs interact with genes involved in malignant transfromation
(DGIdb 4.0)
Entrez IDSymbolCategoryInteraction TypesDrug Claim NameDrug NamePMIDs
Page: 1