Schematic overview of the cellular and molecular mechanisms involved in the cancer progression, including the proposed cellular and molecular mechanisms in cancer cells trajectory. AT1: alveolar type 1 cells; AT2: alveolar type 2 cells; AAH: atypical adenomatous hyperplasia; AIS: adenocarcinoma in situ; MIA: minimally invasive adenocarcinoma; IA: invasive adenocarcinoma; EMT: epithelial-mesenchymal transition

Home

Download

Statistics

Help

Contact

Center for Computational Systems Medicine
leaf

Gene summary

leaf

Malignant transformation analysis

leaf

Malignant transformation related pathway analysis

leaf

Cell-cell communication analysis

leaf

Single-cell gene regulatory network inference analysis

leaf

Somatic mutation of malignant transformation related genes

leaf

Related drugs of malignant transformation related genes

Gene: KIF2A

Gene summary for KIF2A

check button Gene summary.

Gene informationSpeciesHuman
Gene symbol

KIF2A

Gene ID

3796

Gene namekinesin family member 2A
Gene AliasCDCBM3
Cytomap5q12.1
Gene Typeprotein-coding
GO ID

GO:0000226

UniProtAcc

O00139


Top

Malignant transformation analysis

check button Identification of the aberrant gene expression in precancerous and cancerous lesions by comparing the gene expression of stem-like cells in diseased tissues with normal stem cells
check button Malignant transformation involving gene list.
Entrez IDSymbolReplicatesSpeciesOrganTissueAdj P-valueLog2FCMalignancy
3796KIF2ALZE4THumanEsophagusESCC3.16e-093.37e-010.0811
3796KIF2ALZE7THumanEsophagusESCC3.57e-073.88e-010.0667
3796KIF2ALZE8THumanEsophagusESCC3.60e-021.08e-010.067
3796KIF2ALZE20THumanEsophagusESCC1.77e-031.37e-010.0662
3796KIF2ALZE24THumanEsophagusESCC1.21e-113.92e-010.0596
3796KIF2AP1T-EHumanEsophagusESCC1.23e-126.07e-010.0875
3796KIF2AP2T-EHumanEsophagusESCC8.40e-861.45e+000.1177
3796KIF2AP4T-EHumanEsophagusESCC1.37e-204.87e-010.1323
3796KIF2AP5T-EHumanEsophagusESCC8.29e-132.73e-010.1327
3796KIF2AP8T-EHumanEsophagusESCC4.05e-293.93e-010.0889
3796KIF2AP9T-EHumanEsophagusESCC8.07e-142.53e-010.1131
3796KIF2AP10T-EHumanEsophagusESCC3.58e-254.37e-010.116
3796KIF2AP11T-EHumanEsophagusESCC1.96e-146.03e-010.1426
3796KIF2AP12T-EHumanEsophagusESCC1.32e-326.58e-010.1122
3796KIF2AP15T-EHumanEsophagusESCC4.54e-235.63e-010.1149
3796KIF2AP16T-EHumanEsophagusESCC3.94e-487.47e-010.1153
3796KIF2AP17T-EHumanEsophagusESCC1.01e-054.44e-010.1278
3796KIF2AP19T-EHumanEsophagusESCC6.26e-084.69e-010.1662
3796KIF2AP20T-EHumanEsophagusESCC3.20e-367.95e-010.1124
3796KIF2AP21T-EHumanEsophagusESCC1.28e-356.49e-010.1617
Page: 1 2 3 4 5 6 

check button Transcriptomic changes along malignancy continuum.
TissueExpression DynamicsAbbreviation
EsophagusThe image shows the transcriptomic changes along malignancy continuum.log2FC in expression of this searched gene in stem-like cells from each diseased tissue sample relative to stem-like cells in normal samples in each tissue plotted against the malignancy continuum. Samples are colored based on if they are from different disease stage.
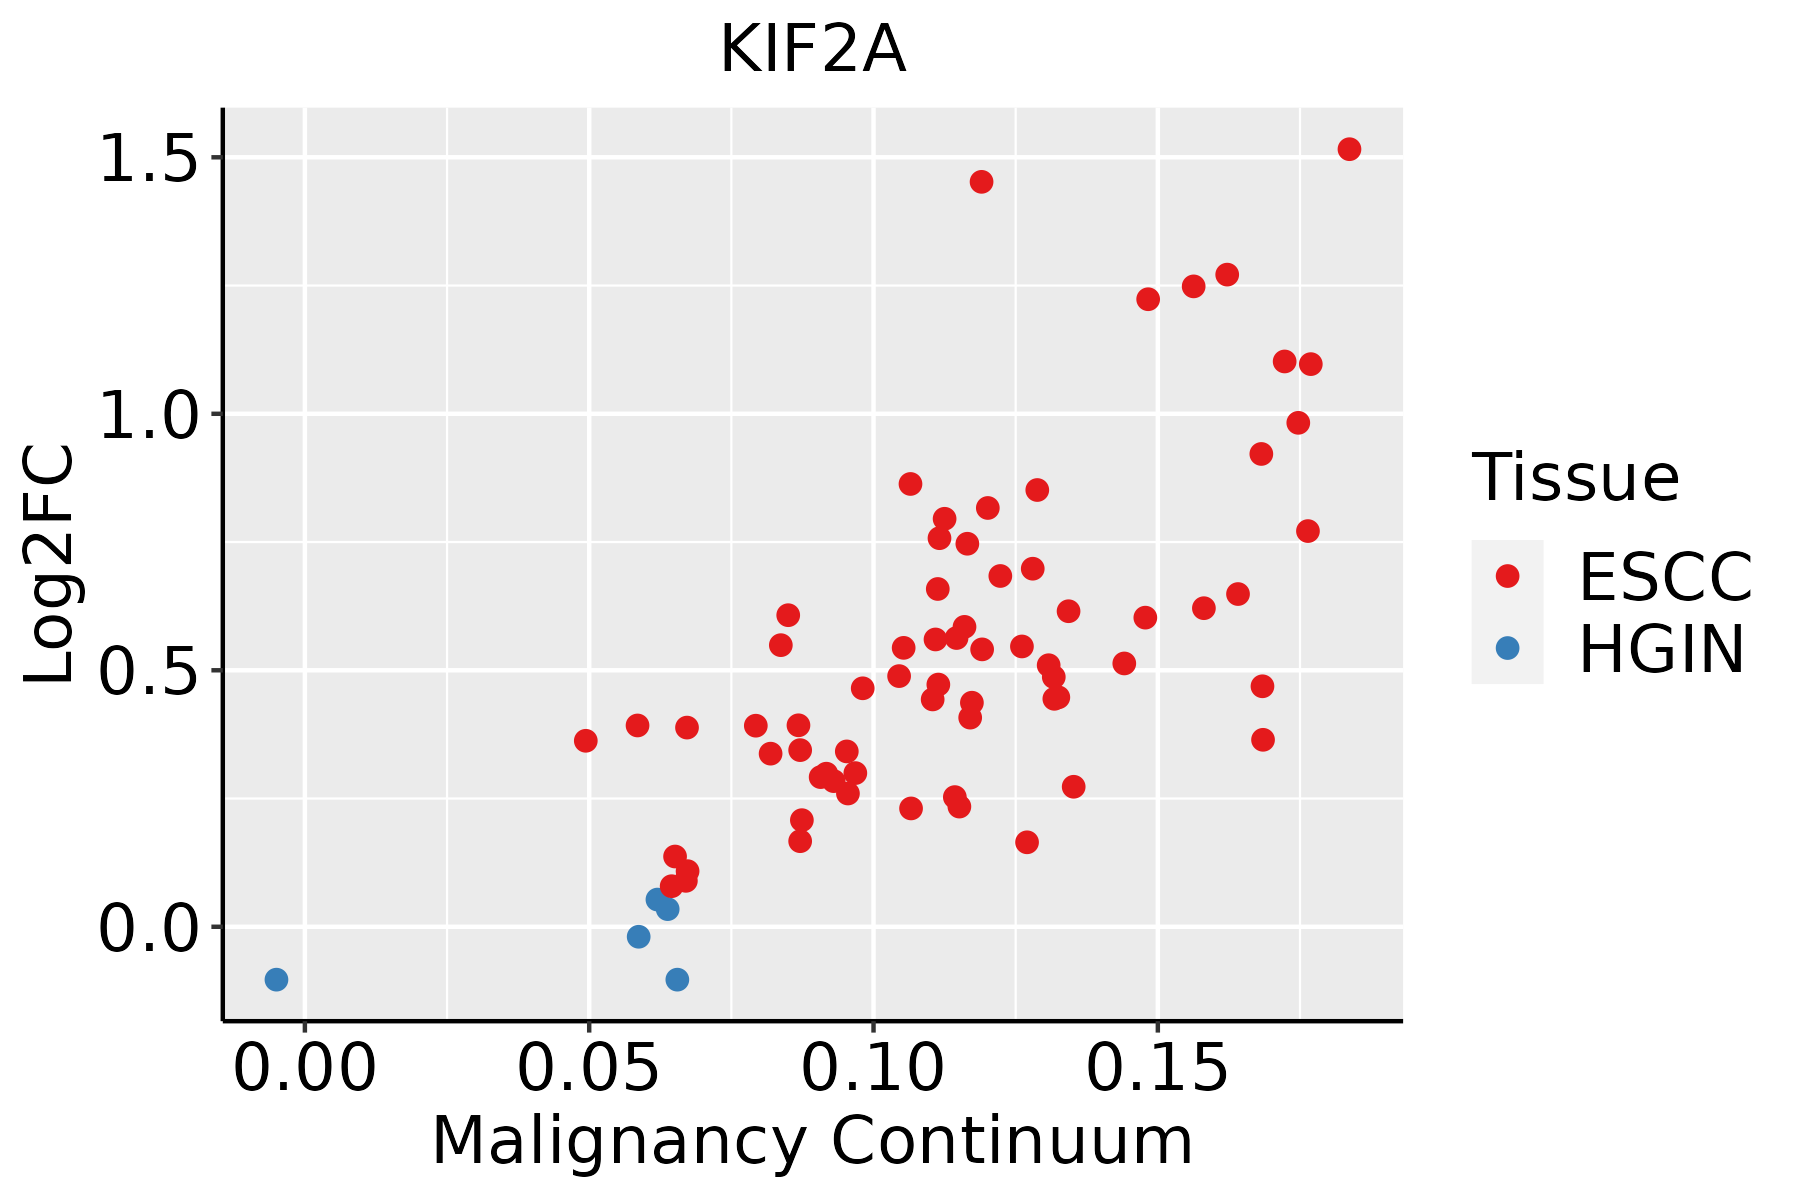
ESCC: Esophageal squamous cell carcinoma
HGIN: High-grade intraepithelial neoplasias
LGIN: Low-grade intraepithelial neoplasias
LiverThe image shows the transcriptomic changes along malignancy continuum.log2FC in expression of this searched gene in stem-like cells from each diseased tissue sample relative to stem-like cells in normal samples in each tissue plotted against the malignancy continuum. Samples are colored based on if they are from different disease stage.
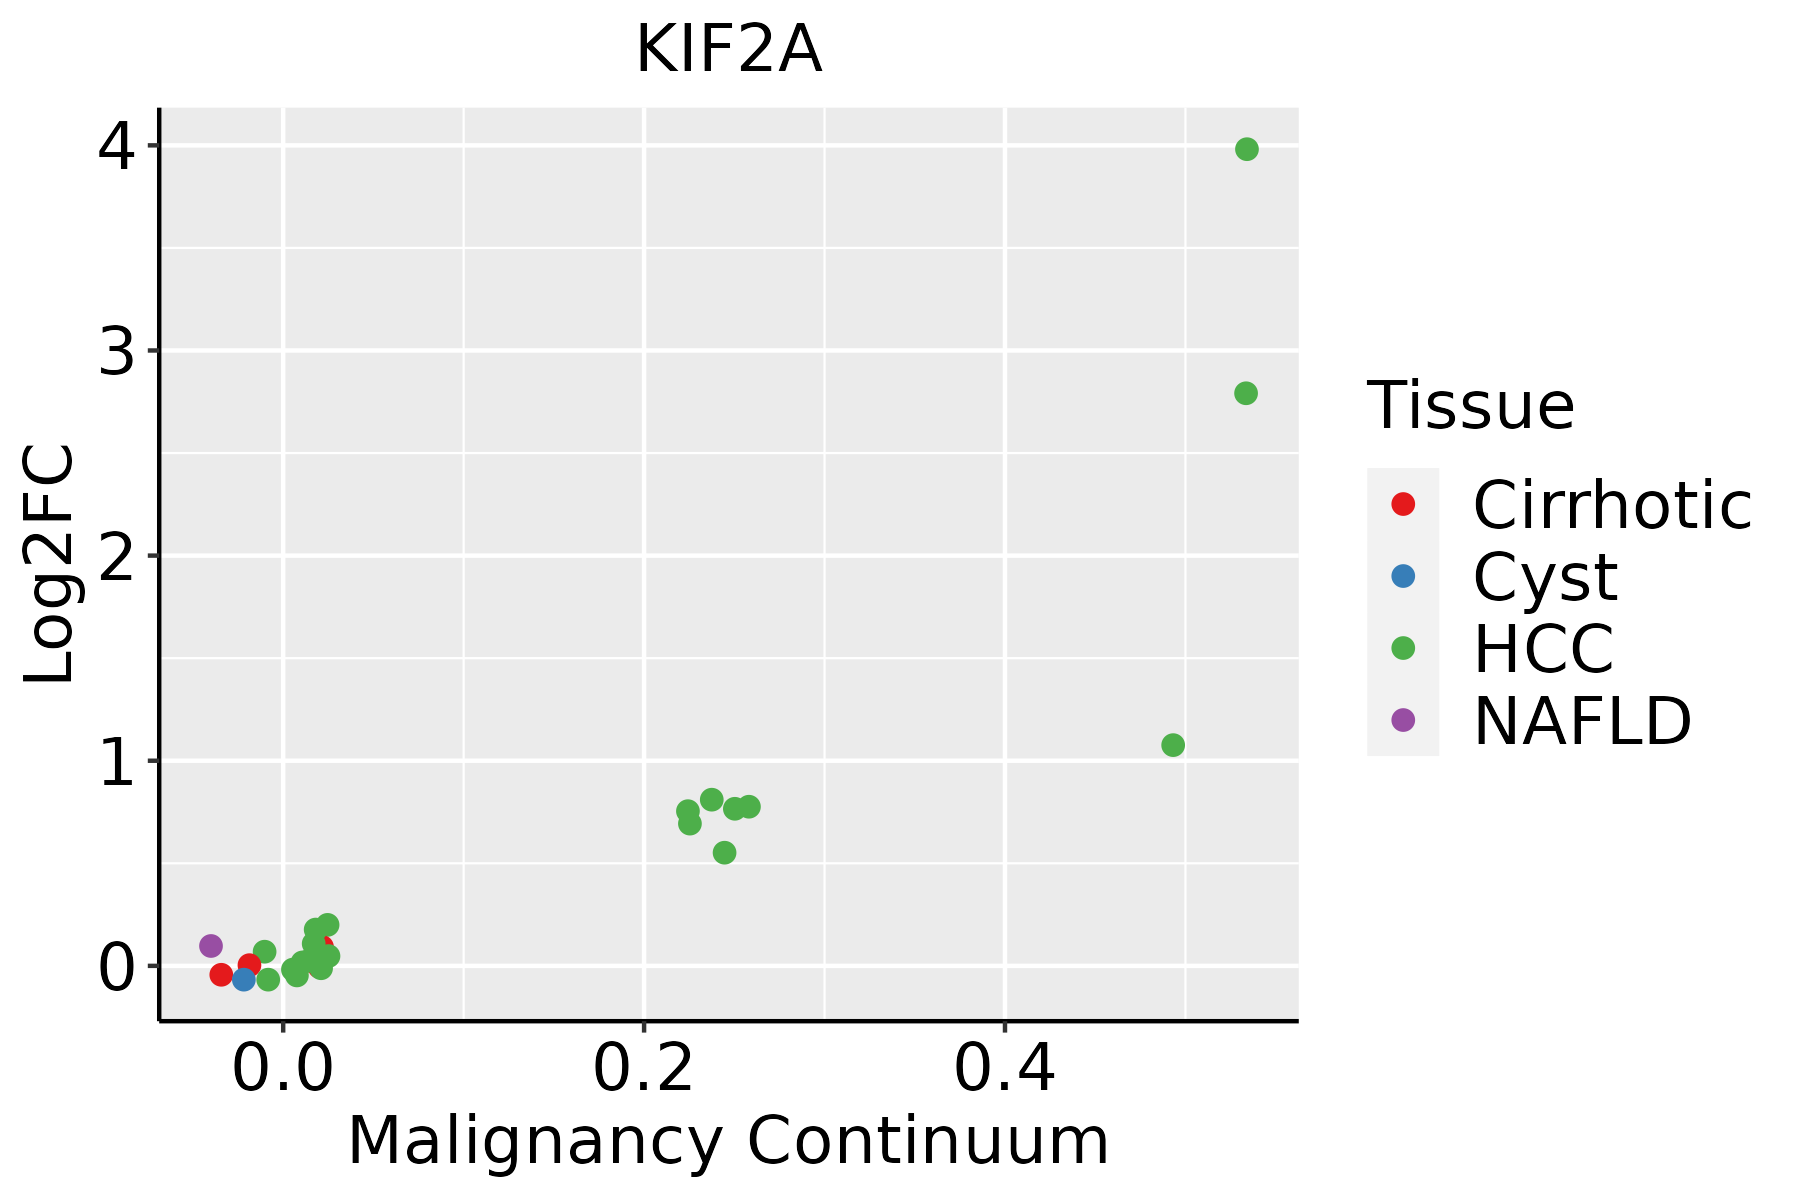
HCC: Hepatocellular carcinoma
NAFLD: Non-alcoholic fatty liver disease
LungThe image shows the transcriptomic changes along malignancy continuum.log2FC in expression of this searched gene in stem-like cells from each diseased tissue sample relative to stem-like cells in normal samples in each tissue plotted against the malignancy continuum. Samples are colored based on if they are from different disease stage.
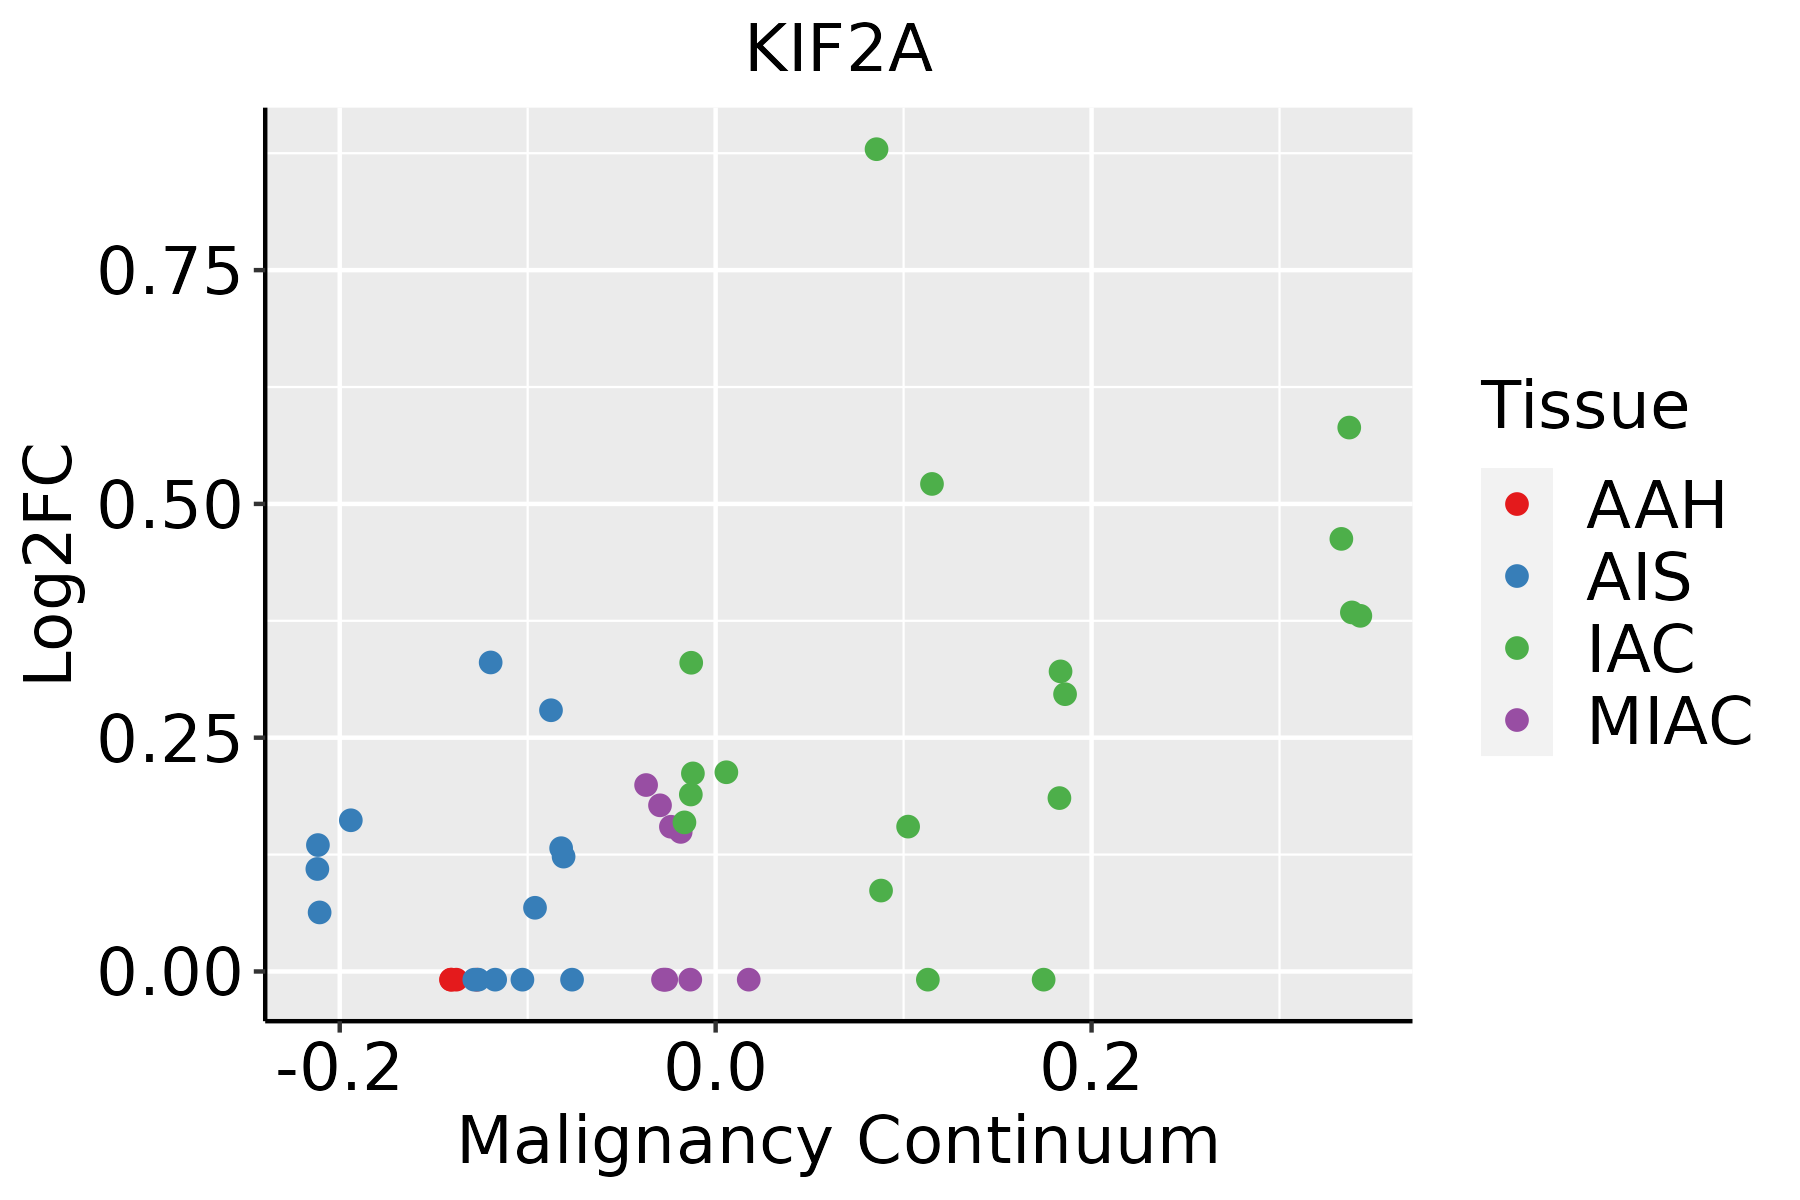
AAH: Atypical adenomatous hyperplasia
AIS: Adenocarcinoma in situ
IAC: Invasive lung adenocarcinoma
MIA: Minimally invasive adenocarcinoma
Oral CavityThe image shows the transcriptomic changes along malignancy continuum.log2FC in expression of this searched gene in stem-like cells from each diseased tissue sample relative to stem-like cells in normal samples in each tissue plotted against the malignancy continuum. Samples are colored based on if they are from different disease stage.EOLP: Erosive Oral lichen planus
LP: leukoplakia
NEOLP: Non-erosive oral lichen planus
OSCC: Oral squamous cell carcinoma
SkinThe image shows the transcriptomic changes along malignancy continuum.log2FC in expression of this searched gene in stem-like cells from each diseased tissue sample relative to stem-like cells in normal samples in each tissue plotted against the malignancy continuum. Samples are colored based on if they are from different disease stage.AK: Actinic keratosis
cSCC: Cutaneous squamous cell carcinoma
SCCIS:squamous cell carcinoma in situ
ThyroidThe image shows the transcriptomic changes along malignancy continuum.log2FC in expression of this searched gene in stem-like cells from each diseased tissue sample relative to stem-like cells in normal samples in each tissue plotted against the malignancy continuum. Samples are colored based on if they are from different disease stage.ATC: Anaplastic thyroid cancer
HT: Hashimoto's thyroiditis
PTC: Papillary thyroid cancer
∗log2FC in expression of this searched gene in stem-like cells from each diseased tissue sample relative to stem-like cells in normal samples in each tissue plotted against the malignancy continuum. Samples are colored based on if they are from different disease stage.

Top

Malignant transformation related pathway analysis

check buttonFind out the enriched GO biological processes and KEGG pathways involved in transition from healthy to precancer to cancer
check button Figure of enriched GO biological processes.
TissueDisease StageEnriched GO biological Processes
ColorectumADGO analysis - Figure of enriched GO biological processes: Top 15 enriched GO BP terms are showed in the bar plot of each disease state in each tissue. Each row represents a significant GO biological process which is colored according to the -log10(p.adjust).
ColorectumSERGO analysis - Figure of enriched GO biological processes: Top 15 enriched GO BP terms are showed in the bar plot of each disease state in each tissue. Each row represents a significant GO biological process which is colored according to the -log10(p.adjust).
ColorectumMSSGO analysis - Figure of enriched GO biological processes: Top 15 enriched GO BP terms are showed in the bar plot of each disease state in each tissue. Each row represents a significant GO biological process which is colored according to the -log10(p.adjust).
ColorectumMSI-HGO analysis - Figure of enriched GO biological processes: Top 15 enriched GO BP terms are showed in the bar plot of each disease state in each tissue. Each row represents a significant GO biological process which is colored according to the -log10(p.adjust).
ColorectumFAPGO analysis - Figure of enriched GO biological processes: Top 15 enriched GO BP terms are showed in the bar plot of each disease state in each tissue. Each row represents a significant GO biological process which is colored according to the -log10(p.adjust).
∗Top 15 enriched GO BP terms are showed in the bar plot of each disease state in each tissue. Each row represents a significant GO biological process which is colored according to the -log10(p.adjust).
Page: 1 2 3 4 5 6 7 8 9 

check button Enriched GO biological processes.
GO IDTissueDisease StageDescriptionGene RatioBg Ratiopvaluep.adjustCount
GO:014001414EsophagusESCCmitotic nuclear division218/8552287/187236.17e-261.78e-23218
GO:0022411111EsophagusESCCcellular component disassembly305/8552443/187231.94e-234.57e-21305
GO:190285015EsophagusESCCmicrotubule cytoskeleton organization involved in mitosis116/8552147/187231.25e-169.91e-15116
GO:000705214EsophagusESCCmitotic spindle organization97/8552120/187232.17e-151.33e-1397
GO:000705114EsophagusESCCspindle organization134/8552184/187235.70e-142.87e-12134
GO:00482853EsophagusESCCorganelle fission301/8552488/187234.64e-132.12e-11301
GO:00002802EsophagusESCCnuclear division270/8552439/187231.17e-114.24e-10270
GO:003298416EsophagusESCCprotein-containing complex disassembly151/8552224/187233.45e-111.15e-09151
GO:00512256EsophagusESCCspindle assembly85/8552117/187232.72e-095.98e-0885
GO:009030715EsophagusESCCmitotic spindle assembly52/855265/187231.41e-082.77e-0752
GO:00311094EsophagusESCCmicrotubule polymerization or depolymerization77/8552122/187237.60e-055.68e-0477
GO:00436245EsophagusESCCcellular protein complex disassembly78/8552136/187234.00e-031.62e-0278
GO:002241112LiverHCCcellular component disassembly282/7958443/187231.02e-191.38e-17282
GO:014001411LiverHCCmitotic nuclear division174/7958287/187233.74e-101.23e-08174
GO:003298411LiverHCCprotein-containing complex disassembly138/7958224/187235.59e-091.46e-07138
GO:000705111LiverHCCspindle organization116/7958184/187231.40e-083.40e-07116
GO:000705211LiverHCCmitotic spindle organization80/7958120/187237.43e-081.50e-0680
GO:190285011LiverHCCmicrotubule cytoskeleton organization involved in mitosis93/7958147/187232.91e-075.09e-0693
GO:005122511LiverHCCspindle assembly75/7958117/187231.92e-062.67e-0575
GO:0048285LiverHCCorganelle fission254/7958488/187231.07e-051.23e-04254
Page: 1 2 3 4 5 

check button Enriched KEGG pathways.
Pathway IDTissueDisease StageDescriptionGene RatioBg Ratiopvaluep.adjustqvalueCount
Page: 1 

Top

Cell-cell communication analysis

check buttonIdentification of potential cell-cell interactions between two cell types and their ligand-receptor pairs for different disease states
LigandReceptorLRpairPathwayTissueDisease Stage
Page: 1 

Top

Single-cell gene regulatory network inference analysis

check buttonFind out the significant the regulons (TFs) and the target genes of each regulon across cell types for different disease states
TFCell TypeTissueDisease StageTarget GeneRSSRegulon Activity
∗The dot plots of a searched regulon are shown for all cell subpopulations in each disease state of each tissue based on the regulon specific score inferred using pySCENIC and by calculating the average expression.
Page: 1 

Top

Somatic mutation of malignant transformation related genes

check buttonAnnotation of somatic variants for genes involved in malignant transformation
Hugo SymbolVariant ClassVariant ClassificationdbSNP RSHGVScHGVSpHGVSp ShortSWISSPROTBIOTYPESIFTPolyPhenTumor Sample BarcodeTissueHistologySexAgeStageTherapy TypesDrugsOutcome
KIF2ASNVMissense_Mutationrs767638932c.182N>Tp.Ser61Leup.S61LO00139protein_codingtolerated(0.11)benign(0.007)TCGA-A1-A0SF-01Breastbreast invasive carcinomaFemale<65I/IIChemotherapytcSD
KIF2ASNVMissense_Mutationc.208N>Ap.Glu70Lysp.E70KO00139protein_codingtolerated(0.36)benign(0.155)TCGA-A8-A09N-01Breastbreast invasive carcinomaFemale<65III/IVUnknownUnknownSD
KIF2ASNVMissense_Mutationc.2045N>Tp.Ala682Valp.A682VO00139protein_codingtolerated(0.48)benign(0.001)TCGA-A8-A09Z-01Breastbreast invasive carcinomaFemale>=65I/IIUnknownUnknownSD
KIF2ASNVMissense_Mutationc.1675N>Cp.Asp559Hisp.D559HO00139protein_codingtolerated(0.08)probably_damaging(0.996)TCGA-B6-A0IE-01Breastbreast invasive carcinomaFemale<65III/IVUnknownUnknownPD
KIF2ASNVMissense_Mutationc.674G>Ap.Cys225Tyrp.C225YO00139protein_codingdeleterious(0)probably_damaging(0.987)TCGA-BH-A18G-01Breastbreast invasive carcinomaFemale>=65I/IIUnknownUnknownSD
KIF2ASNVMissense_Mutationc.72N>Gp.Ile24Metp.I24MO00139protein_codingdeleterious(0)possibly_damaging(0.885)TCGA-D8-A27M-01Breastbreast invasive carcinomaFemale<65I/IIChemotherapymethotrexate+5SD
KIF2AinsertionIn_Frame_Insnovelc.1307_1308insGTCCTTp.His436delinsGlnSerPhep.H436delinsQSFO00139protein_codingTCGA-AN-A0FS-01Breastbreast invasive carcinomaFemale<65I/IIUnknownUnknownSD
KIF2AinsertionFrame_Shift_Insnovelc.1309_1310insAAACTTTTCAACTTp.Ala437GlufsTer55p.A437Efs*55O00139protein_codingTCGA-AN-A0FS-01Breastbreast invasive carcinomaFemale<65I/IIUnknownUnknownSD
KIF2ASNVMissense_Mutationc.177N>Gp.Ile59Metp.I59MO00139protein_codingdeleterious(0)possibly_damaging(0.805)TCGA-Q1-A73O-01Cervixcervical & endocervical cancerFemale<65I/IIChemotherapycisplatinCR
KIF2ASNVMissense_Mutationc.1741N>Gp.Phe581Valp.F581VO00139protein_codingtolerated(0.52)probably_damaging(0.943)TCGA-Q1-A73O-01Cervixcervical & endocervical cancerFemale<65I/IIChemotherapycisplatinCR
Page: 1 2 3 4 5 6 7 

Top

Related drugs of malignant transformation related genes

check buttonIdentification of chemicals and drugs interact with genes involved in malignant transfromation
(DGIdb 4.0)
Entrez IDSymbolCategoryInteraction TypesDrug Claim NameDrug NamePMIDs
Page: 1