
|
|||||
|
 | |
| |
| |
| |
| |
| |
|
Gene: KIF26B |
Gene summary for KIF26B |
| Gene information | Species | Human | Gene symbol | KIF26B | Gene ID | 55083 |
| Gene name | kinesin family member 26B | |
| Gene Alias | KIF26B | |
| Cytomap | 1q44 | |
| Gene Type | protein-coding | GO ID | GO:0001655 | UniProtAcc | Q2KJY2 |
Top |
Malignant transformation analysis |
| Identification of the aberrant gene expression in precancerous and cancerous lesions by comparing the gene expression of stem-like cells in diseased tissues with normal stem cells |
| Entrez ID | Symbol | Replicates | Species | Organ | Tissue | Adj P-value | Log2FC | Malignancy |
| 55083 | KIF26B | HTA11_347_2000001011 | Human | Colorectum | AD | 2.00e-04 | 1.66e-01 | -0.1954 |
| 55083 | KIF26B | HTA11_866_3004761011 | Human | Colorectum | AD | 4.21e-14 | 5.98e-01 | 0.096 |
| 55083 | KIF26B | HTA11_6818_2000001011 | Human | Colorectum | AD | 2.00e-05 | 4.28e-01 | 0.0112 |
| 55083 | KIF26B | HTA11_6818_2000001021 | Human | Colorectum | AD | 7.50e-18 | 8.63e-01 | 0.0588 |
| 55083 | KIF26B | HTA11_99999970781_79442 | Human | Colorectum | MSS | 4.59e-04 | 1.98e-01 | 0.294 |
| 55083 | KIF26B | HTA11_99999971662_82457 | Human | Colorectum | MSS | 1.15e-07 | 2.97e-01 | 0.3859 |
| 55083 | KIF26B | HTA11_99999974143_84620 | Human | Colorectum | MSS | 2.17e-06 | 2.26e-01 | 0.3005 |
| 55083 | KIF26B | A001-C-007 | Human | Colorectum | CRC | 5.42e-09 | 6.37e-01 | 0.1899 |
| 55083 | KIF26B | AEH-subject1 | Human | Endometrium | AEH | 7.61e-13 | 3.96e-01 | -0.3059 |
| 55083 | KIF26B | AEH-subject2 | Human | Endometrium | AEH | 1.49e-08 | 3.68e-01 | -0.2525 |
| 55083 | KIF26B | AEH-subject4 | Human | Endometrium | AEH | 7.13e-09 | 4.20e-01 | -0.2657 |
| 55083 | KIF26B | EEC-subject1 | Human | Endometrium | EEC | 7.32e-16 | 5.46e-01 | -0.2682 |
| 55083 | KIF26B | EEC-subject2 | Human | Endometrium | EEC | 4.31e-10 | 4.07e-01 | -0.2607 |
| 55083 | KIF26B | EEC-subject3 | Human | Endometrium | EEC | 3.77e-14 | 5.37e-01 | -0.2525 |
| 55083 | KIF26B | EEC-subject4 | Human | Endometrium | EEC | 2.44e-05 | 2.74e-01 | -0.2571 |
| 55083 | KIF26B | GSM6177620_NYU_UCEC1_lib1_lib1 | Human | Endometrium | EEC | 4.23e-03 | 8.97e-02 | -0.1869 |
| 55083 | KIF26B | GSM6177620_NYU_UCEC1_lib2_lib2 | Human | Endometrium | EEC | 2.77e-02 | 9.42e-02 | -0.1875 |
| 55083 | KIF26B | GSM6177620_NYU_UCEC1_lib3_lib3 | Human | Endometrium | EEC | 2.84e-04 | 7.33e-02 | -0.1883 |
| 55083 | KIF26B | HCC2_Meng | Human | Liver | HCC | 3.57e-03 | 7.12e-02 | 0.0107 |
| 55083 | KIF26B | S014 | Human | Liver | HCC | 2.32e-34 | 1.11e+00 | 0.2254 |
| Page: 1 2 |
| Tissue | Expression Dynamics | Abbreviation |
| Colorectum (GSE201348) |  | FAP: Familial adenomatous polyposis |
| CRC: Colorectal cancer | ||
| Colorectum (HTA11) |  | AD: Adenomas |
| SER: Sessile serrated lesions | ||
| MSI-H: Microsatellite-high colorectal cancer | ||
| MSS: Microsatellite stable colorectal cancer | ||
| Endometrium |  | AEH: Atypical endometrial hyperplasia |
| EEC: Endometrioid Cancer | ||
| Liver | 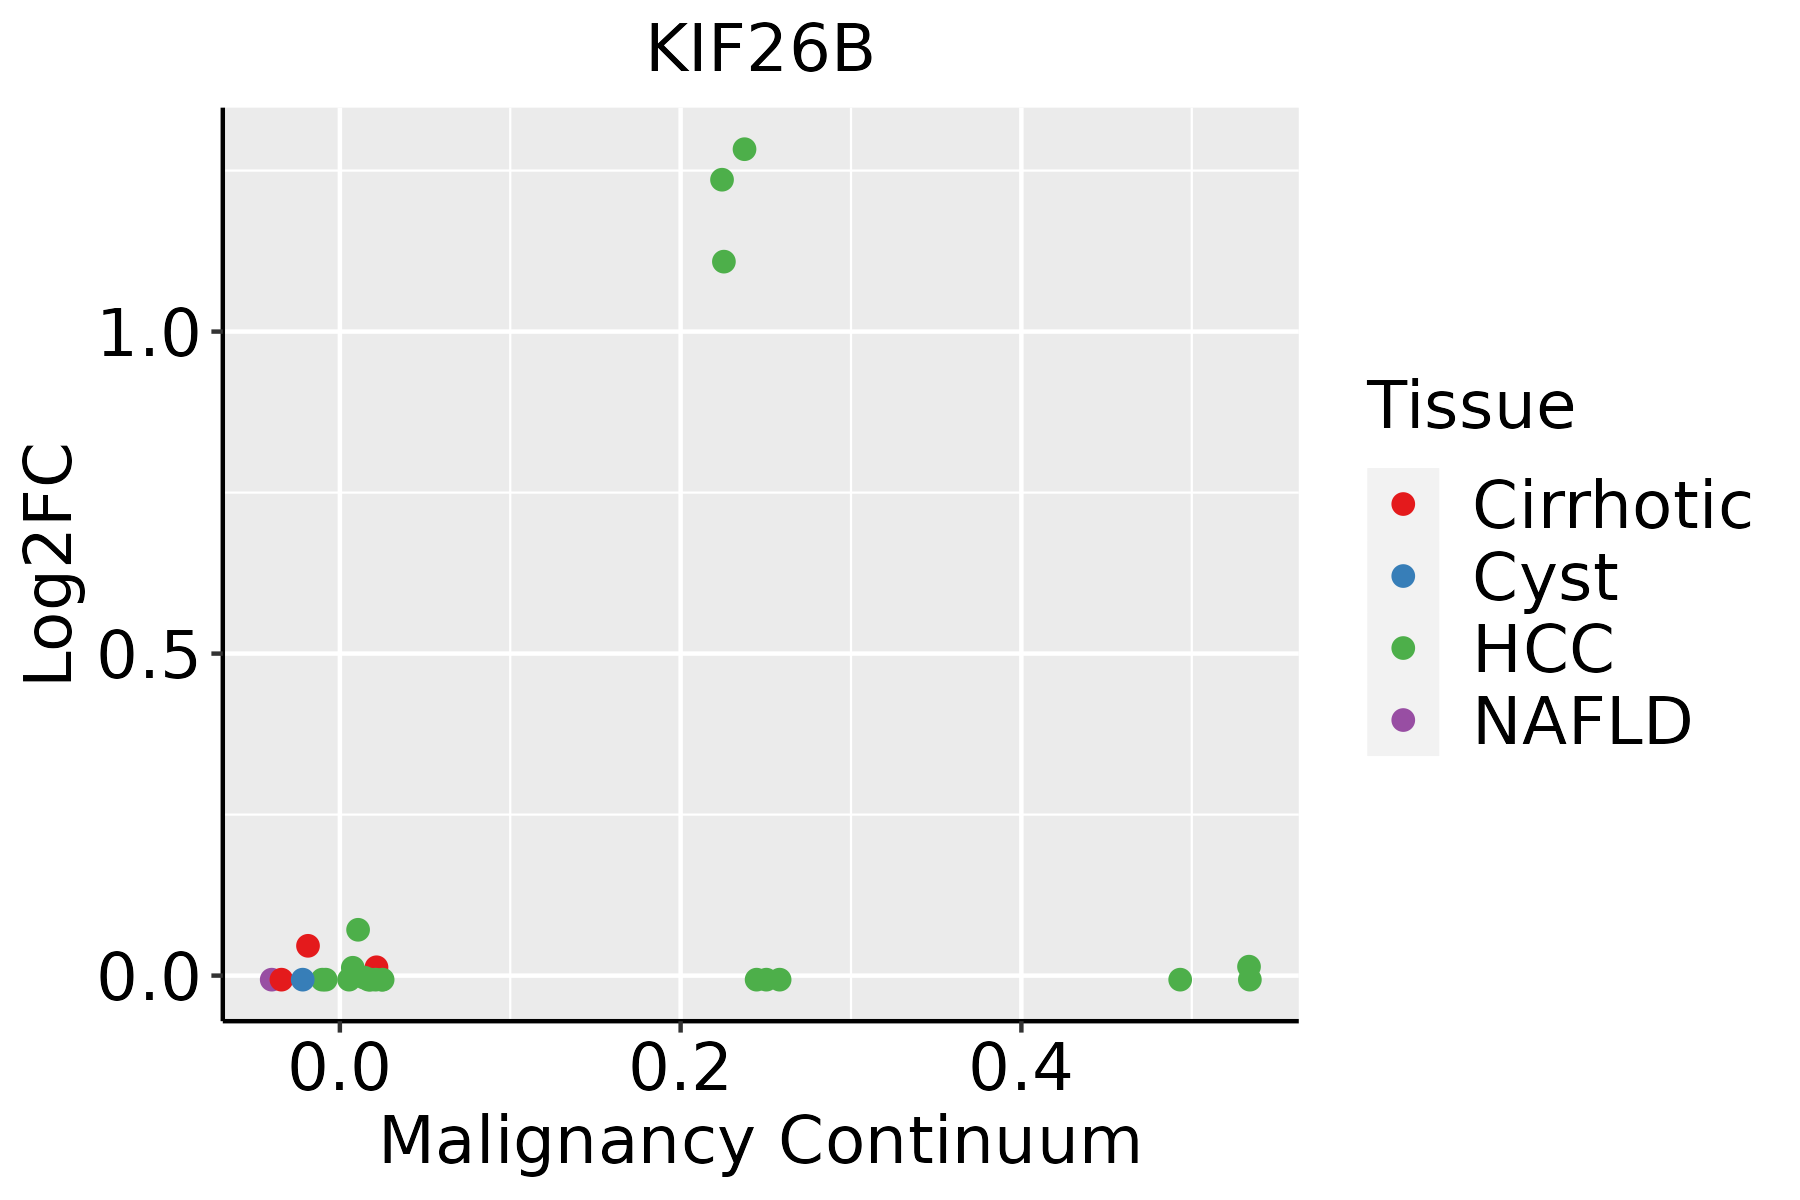 | HCC: Hepatocellular carcinoma |
| NAFLD: Non-alcoholic fatty liver disease | ||
| Lung | 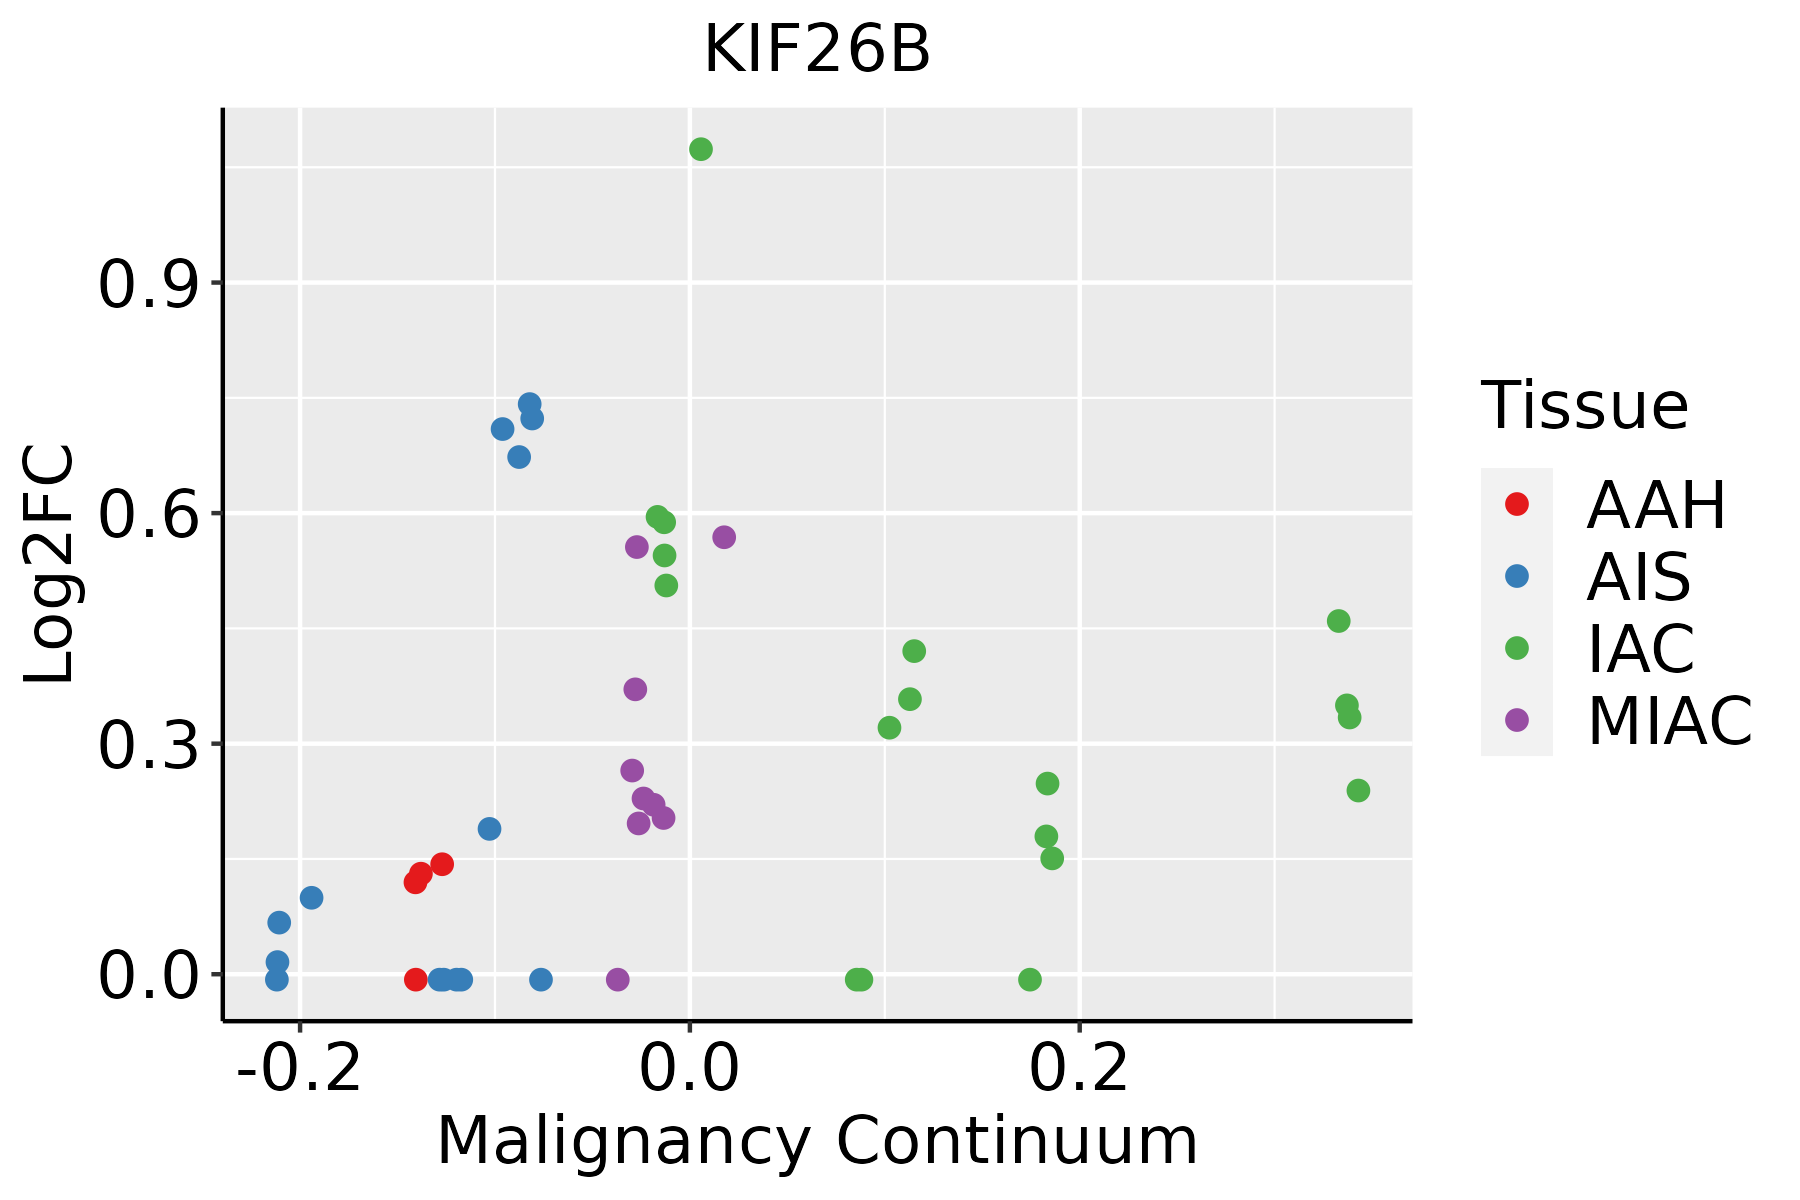 | AAH: Atypical adenomatous hyperplasia |
| AIS: Adenocarcinoma in situ | ||
| IAC: Invasive lung adenocarcinoma | ||
| MIA: Minimally invasive adenocarcinoma |
| ∗log2FC in expression of this searched gene in stem-like cells from each diseased tissue sample relative to stem-like cells in normal samples in each tissue plotted against the malignancy continuum. Samples are colored based on if they are from different disease stage. |
Top |
Malignant transformation related pathway analysis |
| Find out the enriched GO biological processes and KEGG pathways involved in transition from healthy to precancer to cancer |
| Tissue | Disease Stage | Enriched GO biological Processes |
| Colorectum | AD |  |
| Colorectum | SER |  |
| Colorectum | MSS |  |
| Colorectum | MSI-H |  |
| Colorectum | FAP |  |
| ∗Top 15 enriched GO BP terms are showed in the bar plot of each disease state in each tissue. Each row represents a significant GO biological process which is colored according to the -log10(p.adjust). |
| Page: 1 2 3 4 5 6 7 8 9 |
| GO ID | Tissue | Disease Stage | Description | Gene Ratio | Bg Ratio | pvalue | p.adjust | Count |
| GO:0007163 | Colorectum | AD | establishment or maintenance of cell polarity | 77/3918 | 218/18723 | 5.72e-07 | 2.08e-05 | 77 |
| GO:0030010 | Colorectum | AD | establishment of cell polarity | 50/3918 | 143/18723 | 6.90e-05 | 1.11e-03 | 50 |
| GO:0045785 | Colorectum | AD | positive regulation of cell adhesion | 122/3918 | 437/18723 | 2.65e-04 | 3.28e-03 | 122 |
| GO:0060562 | Colorectum | AD | epithelial tube morphogenesis | 93/3918 | 325/18723 | 5.65e-04 | 6.00e-03 | 93 |
| GO:0072073 | Colorectum | AD | kidney epithelium development | 42/3918 | 136/18723 | 4.02e-03 | 2.80e-02 | 42 |
| GO:0060560 | Colorectum | AD | developmental growth involved in morphogenesis | 66/3918 | 234/18723 | 4.75e-03 | 3.22e-02 | 66 |
| GO:00071632 | Colorectum | MSS | establishment or maintenance of cell polarity | 72/3467 | 218/18723 | 1.90e-07 | 8.30e-06 | 72 |
| GO:00300102 | Colorectum | MSS | establishment of cell polarity | 47/3467 | 143/18723 | 2.74e-05 | 5.58e-04 | 47 |
| GO:00605621 | Colorectum | MSS | epithelial tube morphogenesis | 88/3467 | 325/18723 | 8.45e-05 | 1.37e-03 | 88 |
| GO:00457852 | Colorectum | MSS | positive regulation of cell adhesion | 110/3467 | 437/18723 | 2.94e-04 | 3.87e-03 | 110 |
| GO:00605601 | Colorectum | MSS | developmental growth involved in morphogenesis | 61/3467 | 234/18723 | 2.56e-03 | 2.03e-02 | 61 |
| GO:00720731 | Colorectum | MSS | kidney epithelium development | 38/3467 | 136/18723 | 4.53e-03 | 3.19e-02 | 38 |
| GO:0001655 | Colorectum | MSS | urogenital system development | 81/3467 | 338/18723 | 6.88e-03 | 4.43e-02 | 81 |
| GO:00071634 | Colorectum | CRC | establishment or maintenance of cell polarity | 57/2078 | 218/18723 | 3.96e-10 | 1.58e-07 | 57 |
| GO:00300104 | Colorectum | CRC | establishment of cell polarity | 40/2078 | 143/18723 | 2.09e-08 | 3.23e-06 | 40 |
| GO:00605603 | Colorectum | CRC | developmental growth involved in morphogenesis | 53/2078 | 234/18723 | 2.88e-07 | 2.54e-05 | 53 |
| GO:00457855 | Colorectum | CRC | positive regulation of cell adhesion | 81/2078 | 437/18723 | 2.28e-06 | 1.10e-04 | 81 |
| GO:00720733 | Colorectum | CRC | kidney epithelium development | 34/2078 | 136/18723 | 3.87e-06 | 1.63e-04 | 34 |
| GO:00016552 | Colorectum | CRC | urogenital system development | 62/2078 | 338/18723 | 4.67e-05 | 1.10e-03 | 62 |
| GO:00720011 | Colorectum | CRC | renal system development | 56/2078 | 302/18723 | 7.85e-05 | 1.63e-03 | 56 |
| Page: 1 2 3 4 5 6 |
| Pathway ID | Tissue | Disease Stage | Description | Gene Ratio | Bg Ratio | pvalue | p.adjust | qvalue | Count |
| hsa048144 | Endometrium | AEH | Motor proteins | 42/1197 | 193/8465 | 2.41e-03 | 1.42e-02 | 1.04e-02 | 42 |
| hsa0481411 | Endometrium | AEH | Motor proteins | 42/1197 | 193/8465 | 2.41e-03 | 1.42e-02 | 1.04e-02 | 42 |
| hsa048142 | Endometrium | EEC | Motor proteins | 42/1237 | 193/8465 | 4.43e-03 | 2.39e-02 | 1.78e-02 | 42 |
| hsa048143 | Endometrium | EEC | Motor proteins | 42/1237 | 193/8465 | 4.43e-03 | 2.39e-02 | 1.78e-02 | 42 |
| Page: 1 |
Top |
Cell-cell communication analysis |
| Identification of potential cell-cell interactions between two cell types and their ligand-receptor pairs for different disease states |
| Ligand | Receptor | LRpair | Pathway | Tissue | Disease Stage |
| Page: 1 |
Top |
Single-cell gene regulatory network inference analysis |
| Find out the significant the regulons (TFs) and the target genes of each regulon across cell types for different disease states |
| TF | Cell Type | Tissue | Disease Stage | Target Gene | RSS | Regulon Activity |
| ∗The dot plots of a searched regulon are shown for all cell subpopulations in each disease state of each tissue based on the regulon specific score inferred using pySCENIC and by calculating the average expression. |
| Page: 1 |
Top |
Somatic mutation of malignant transformation related genes |
| Annotation of somatic variants for genes involved in malignant transformation |
| Hugo Symbol | Variant Class | Variant Classification | dbSNP RS | HGVSc | HGVSp | HGVSp Short | SWISSPROT | BIOTYPE | SIFT | PolyPhen | Tumor Sample Barcode | Tissue | Histology | Sex | Age | Stage | Therapy Types | Drugs | Outcome |
| KIF26B | SNV | Missense_Mutation | novel | c.4771N>G | p.Arg1591Gly | p.R1591G | Q2KJY2 | protein_coding | deleterious(0.02) | benign(0.313) | TCGA-3C-AALI-01 | Breast | breast invasive carcinoma | Female | <65 | I/II | Unspecific | Poly E | Complete Response |
| KIF26B | SNV | Missense_Mutation | c.3383N>A | p.Pro1128Gln | p.P1128Q | Q2KJY2 | protein_coding | deleterious(0) | probably_damaging(0.999) | TCGA-A8-A06X-01 | Breast | breast invasive carcinoma | Female | >=65 | I/II | Unknown | Unknown | SD | |
| KIF26B | SNV | Missense_Mutation | rs369084969 | c.706N>A | p.Val236Met | p.V236M | Q2KJY2 | protein_coding | tolerated(0.6) | benign(0.001) | TCGA-A8-A06Z-01 | Breast | breast invasive carcinoma | Female | >=65 | I/II | Unknown | Unknown | SD |
| KIF26B | SNV | Missense_Mutation | rs199933797 | c.6071G>A | p.Arg2024His | p.R2024H | Q2KJY2 | protein_coding | deleterious(0) | probably_damaging(0.997) | TCGA-A8-A08L-01 | Breast | breast invasive carcinoma | Female | >=65 | III/IV | Unknown | Unknown | SD |
| KIF26B | SNV | Missense_Mutation | novel | c.6133A>T | p.Thr2045Ser | p.T2045S | Q2KJY2 | protein_coding | deleterious(0) | probably_damaging(0.991) | TCGA-A8-A08P-01 | Breast | breast invasive carcinoma | Female | >=65 | III/IV | Chemotherapy | 5-fluorouracil | CR |
| KIF26B | SNV | Missense_Mutation | c.1455N>G | p.Asp485Glu | p.D485E | Q2KJY2 | protein_coding | tolerated(0.19) | benign(0.444) | TCGA-A8-A09E-01 | Breast | breast invasive carcinoma | Female | >=65 | III/IV | Hormone Therapy | anastrozole | SD | |
| KIF26B | SNV | Missense_Mutation | c.935N>G | p.His312Arg | p.H312R | Q2KJY2 | protein_coding | deleterious(0.01) | possibly_damaging(0.626) | TCGA-A8-A09Z-01 | Breast | breast invasive carcinoma | Female | >=65 | I/II | Unknown | Unknown | SD | |
| KIF26B | SNV | Missense_Mutation | novel | c.543N>G | p.Asp181Glu | p.D181E | Q2KJY2 | protein_coding | tolerated(1) | benign(0.094) | TCGA-AC-A2BK-01 | Breast | breast invasive carcinoma | Female | >=65 | III/IV | Chemotherapy | cytoxan | CR |
| KIF26B | SNV | Missense_Mutation | novel | c.3930N>A | p.Met1310Ile | p.M1310I | Q2KJY2 | protein_coding | deleterious(0.04) | benign(0.01) | TCGA-AC-A3HN-01 | Breast | breast invasive carcinoma | Female | >=65 | I/II | Unknown | Unknown | SD |
| KIF26B | SNV | Missense_Mutation | novel | c.1758G>T | p.Lys586Asn | p.K586N | Q2KJY2 | protein_coding | deleterious(0) | probably_damaging(0.992) | TCGA-AN-A046-01 | Breast | breast invasive carcinoma | Female | >=65 | I/II | Unknown | Unknown | SD |
| Page: 1 2 3 4 5 6 7 8 9 10 11 12 13 14 15 16 17 18 19 20 21 22 23 24 25 26 27 |
Top |
Related drugs of malignant transformation related genes |
| Identification of chemicals and drugs interact with genes involved in malignant transfromation |
| (DGIdb 4.0) |
| Entrez ID | Symbol | Category | Interaction Types | Drug Claim Name | Drug Name | PMIDs |
| Page: 1 |

Copyright 2023-Present -The University of Texas Health Science Center at Houston |