
|
|||||
|
 | |
| |
| |
| |
| |
| |
|
Gene: KIF23 |
Gene summary for KIF23 |
| Gene information | Species | Human | Gene symbol | KIF23 | Gene ID | 9493 |
| Gene name | kinesin family member 23 | |
| Gene Alias | CHO1 | |
| Cytomap | 15q23 | |
| Gene Type | protein-coding | GO ID | GO:0000022 | UniProtAcc | Q02241 |
Top |
Malignant transformation analysis |
| Identification of the aberrant gene expression in precancerous and cancerous lesions by comparing the gene expression of stem-like cells in diseased tissues with normal stem cells |
| Entrez ID | Symbol | Replicates | Species | Organ | Tissue | Adj P-value | Log2FC | Malignancy |
| 9493 | KIF23 | LZE21T | Human | Esophagus | ESCC | 6.52e-03 | 2.30e-01 | 0.0655 |
| 9493 | KIF23 | LZE6T | Human | Esophagus | ESCC | 2.96e-03 | 1.88e-01 | 0.0845 |
| 9493 | KIF23 | P2T-E | Human | Esophagus | ESCC | 4.12e-11 | 5.81e-01 | 0.1177 |
| 9493 | KIF23 | P4T-E | Human | Esophagus | ESCC | 2.23e-06 | 2.48e-01 | 0.1323 |
| 9493 | KIF23 | P5T-E | Human | Esophagus | ESCC | 9.53e-09 | 2.43e-01 | 0.1327 |
| 9493 | KIF23 | P8T-E | Human | Esophagus | ESCC | 3.50e-02 | 1.49e-01 | 0.0889 |
| 9493 | KIF23 | P9T-E | Human | Esophagus | ESCC | 1.45e-04 | 2.66e-01 | 0.1131 |
| 9493 | KIF23 | P10T-E | Human | Esophagus | ESCC | 4.40e-09 | 4.28e-01 | 0.116 |
| 9493 | KIF23 | P15T-E | Human | Esophagus | ESCC | 1.35e-04 | 2.36e-01 | 0.1149 |
| 9493 | KIF23 | P16T-E | Human | Esophagus | ESCC | 1.96e-05 | 2.22e-01 | 0.1153 |
| 9493 | KIF23 | P17T-E | Human | Esophagus | ESCC | 2.68e-03 | 2.84e-01 | 0.1278 |
| 9493 | KIF23 | P20T-E | Human | Esophagus | ESCC | 3.97e-02 | 1.59e-01 | 0.1124 |
| 9493 | KIF23 | P21T-E | Human | Esophagus | ESCC | 4.40e-09 | 2.83e-01 | 0.1617 |
| 9493 | KIF23 | P22T-E | Human | Esophagus | ESCC | 1.78e-03 | 2.18e-01 | 0.1236 |
| 9493 | KIF23 | P24T-E | Human | Esophagus | ESCC | 1.96e-05 | 2.76e-01 | 0.1287 |
| 9493 | KIF23 | P26T-E | Human | Esophagus | ESCC | 7.90e-03 | 1.46e-01 | 0.1276 |
| 9493 | KIF23 | P28T-E | Human | Esophagus | ESCC | 1.88e-04 | 1.44e-01 | 0.1149 |
| 9493 | KIF23 | P30T-E | Human | Esophagus | ESCC | 2.13e-03 | 3.06e-01 | 0.137 |
| 9493 | KIF23 | P31T-E | Human | Esophagus | ESCC | 2.02e-06 | 2.44e-01 | 0.1251 |
| 9493 | KIF23 | P32T-E | Human | Esophagus | ESCC | 6.56e-15 | 4.43e-01 | 0.1666 |
| Page: 1 2 3 |
| Tissue | Expression Dynamics | Abbreviation |
| Esophagus |  | ESCC: Esophageal squamous cell carcinoma |
| HGIN: High-grade intraepithelial neoplasias | ||
| LGIN: Low-grade intraepithelial neoplasias | ||
| Oral Cavity | 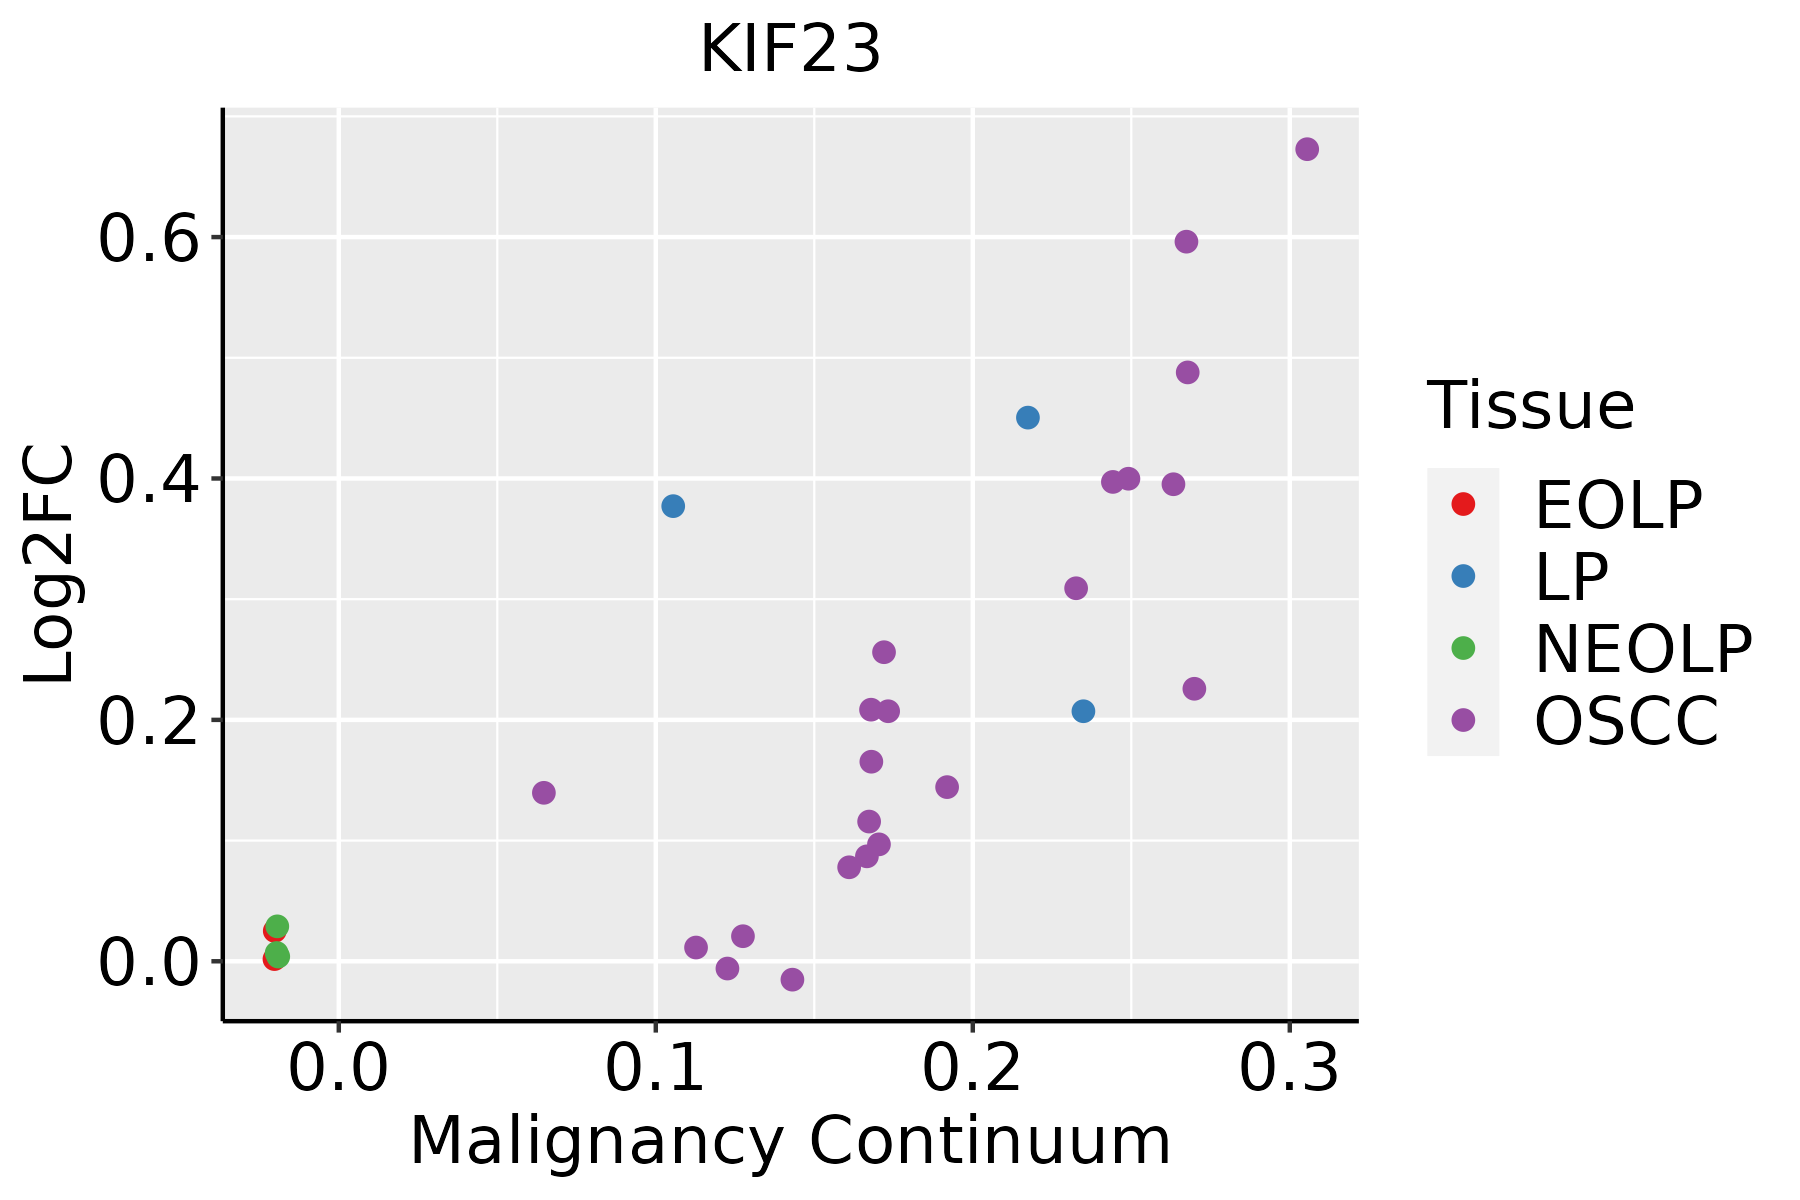 | EOLP: Erosive Oral lichen planus |
| LP: leukoplakia | ||
| NEOLP: Non-erosive oral lichen planus | ||
| OSCC: Oral squamous cell carcinoma | ||
| Skin |  | AK: Actinic keratosis |
| cSCC: Cutaneous squamous cell carcinoma | ||
| SCCIS:squamous cell carcinoma in situ | ||
| Thyroid | 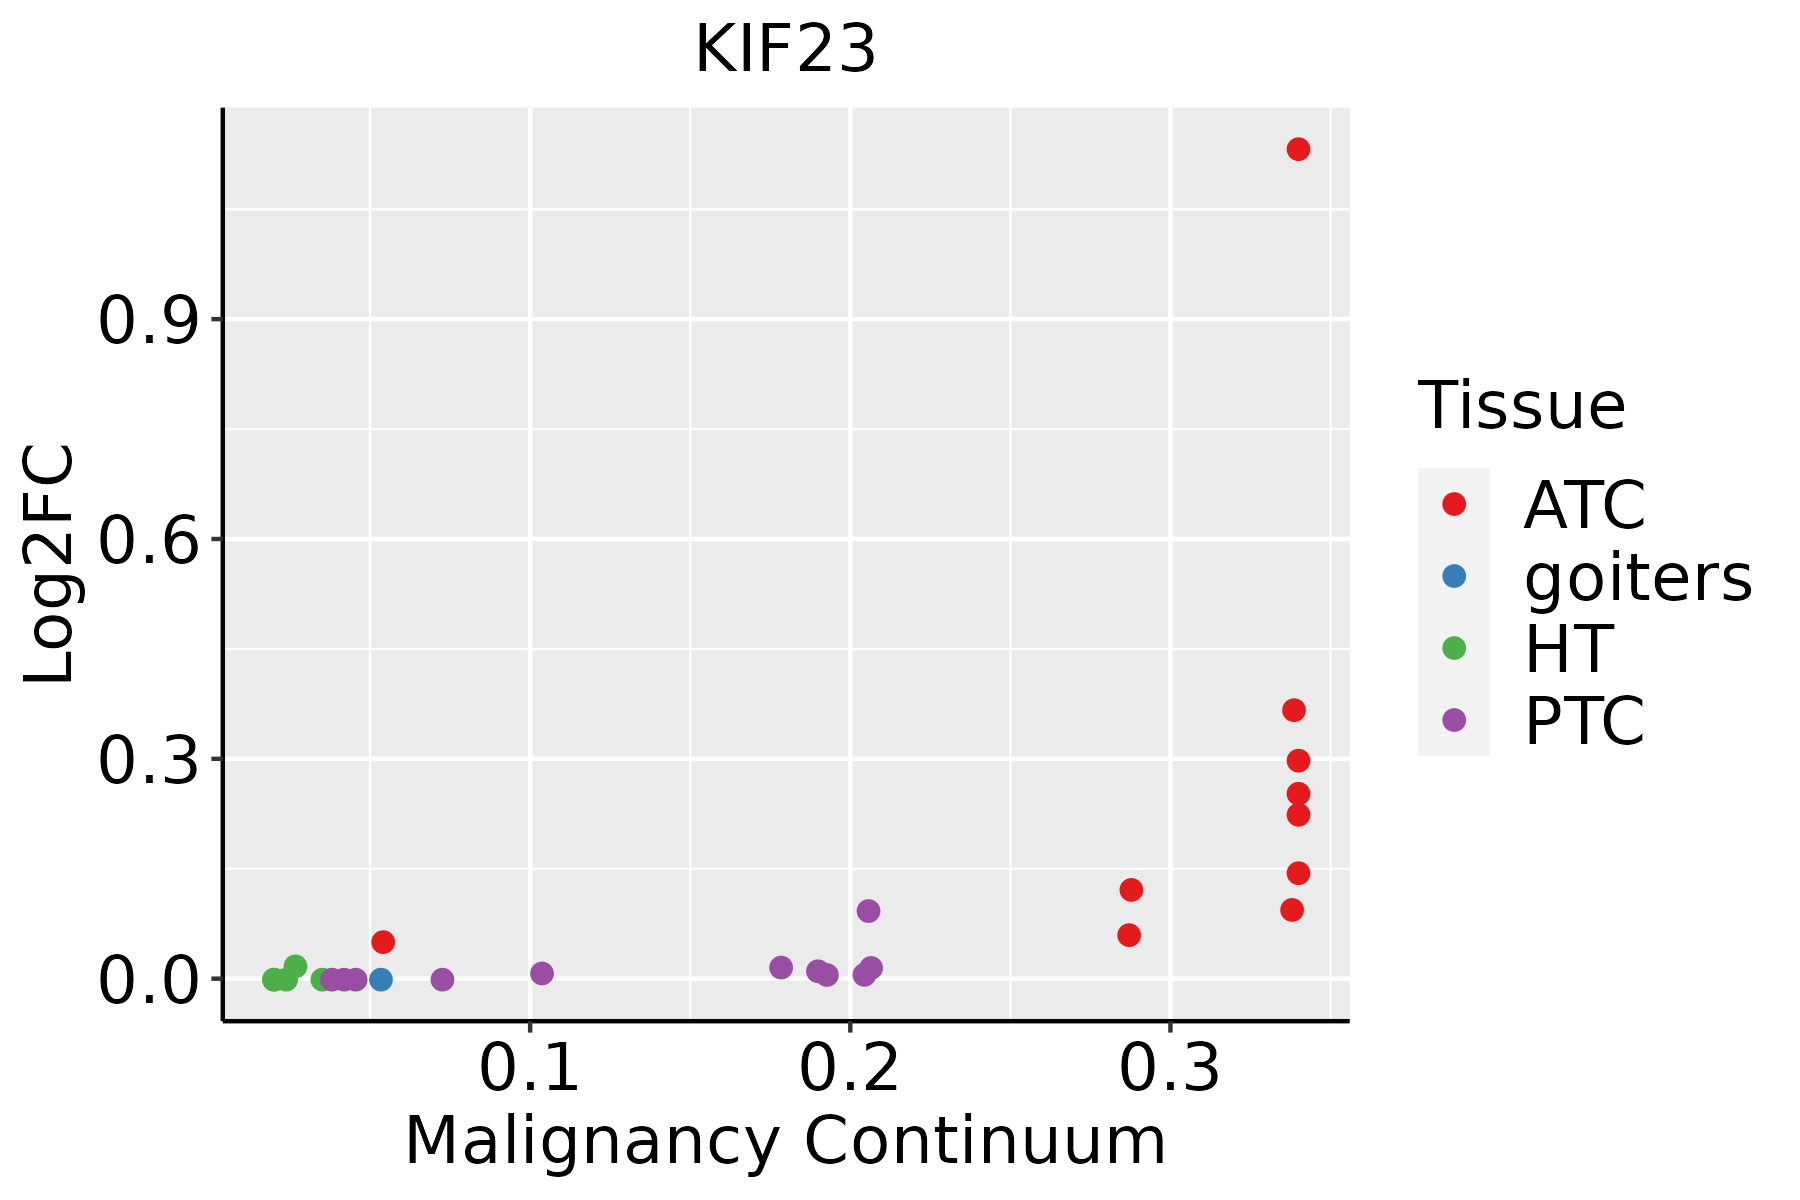 | ATC: Anaplastic thyroid cancer |
| HT: Hashimoto's thyroiditis | ||
| PTC: Papillary thyroid cancer |
| ∗log2FC in expression of this searched gene in stem-like cells from each diseased tissue sample relative to stem-like cells in normal samples in each tissue plotted against the malignancy continuum. Samples are colored based on if they are from different disease stage. |
Top |
Malignant transformation related pathway analysis |
| Find out the enriched GO biological processes and KEGG pathways involved in transition from healthy to precancer to cancer |
| Tissue | Disease Stage | Enriched GO biological Processes |
| Colorectum | AD |  |
| Colorectum | SER |  |
| Colorectum | MSS |  |
| Colorectum | MSI-H |  |
| Colorectum | FAP |  |
| ∗Top 15 enriched GO BP terms are showed in the bar plot of each disease state in each tissue. Each row represents a significant GO biological process which is colored according to the -log10(p.adjust). |
| Page: 1 2 3 4 5 6 7 8 9 |
| GO ID | Tissue | Disease Stage | Description | Gene Ratio | Bg Ratio | pvalue | p.adjust | Count |
| GO:014001414 | Esophagus | ESCC | mitotic nuclear division | 218/8552 | 287/18723 | 6.17e-26 | 1.78e-23 | 218 |
| GO:000007011 | Esophagus | ESCC | mitotic sister chromatid segregation | 138/8552 | 168/18723 | 1.37e-22 | 2.63e-20 | 138 |
| GO:00008194 | Esophagus | ESCC | sister chromatid segregation | 157/8552 | 202/18723 | 8.41e-21 | 1.33e-18 | 157 |
| GO:000705911 | Esophagus | ESCC | chromosome segregation | 238/8552 | 346/18723 | 1.72e-18 | 1.82e-16 | 238 |
| GO:190285015 | Esophagus | ESCC | microtubule cytoskeleton organization involved in mitosis | 116/8552 | 147/18723 | 1.25e-16 | 9.91e-15 | 116 |
| GO:000705214 | Esophagus | ESCC | mitotic spindle organization | 97/8552 | 120/18723 | 2.17e-15 | 1.33e-13 | 97 |
| GO:000705114 | Esophagus | ESCC | spindle organization | 134/8552 | 184/18723 | 5.70e-14 | 2.87e-12 | 134 |
| GO:00482853 | Esophagus | ESCC | organelle fission | 301/8552 | 488/18723 | 4.64e-13 | 2.12e-11 | 301 |
| GO:00988133 | Esophagus | ESCC | nuclear chromosome segregation | 187/8552 | 281/18723 | 1.00e-12 | 4.36e-11 | 187 |
| GO:00002802 | Esophagus | ESCC | nuclear division | 270/8552 | 439/18723 | 1.17e-11 | 4.24e-10 | 270 |
| GO:000028115 | Esophagus | ESCC | mitotic cytokinesis | 58/8552 | 71/18723 | 4.34e-10 | 1.15e-08 | 58 |
| GO:004578710 | Esophagus | ESCC | positive regulation of cell cycle | 196/8552 | 313/18723 | 9.27e-10 | 2.24e-08 | 196 |
| GO:00512256 | Esophagus | ESCC | spindle assembly | 85/8552 | 117/18723 | 2.72e-09 | 5.98e-08 | 85 |
| GO:009030715 | Esophagus | ESCC | mitotic spindle assembly | 52/8552 | 65/18723 | 1.41e-08 | 2.77e-07 | 52 |
| GO:000091016 | Esophagus | ESCC | cytokinesis | 115/8552 | 173/18723 | 2.48e-08 | 4.68e-07 | 115 |
| GO:006164015 | Esophagus | ESCC | cytoskeleton-dependent cytokinesis | 72/8552 | 100/18723 | 8.10e-08 | 1.39e-06 | 72 |
| GO:00900689 | Esophagus | ESCC | positive regulation of cell cycle process | 142/8552 | 236/18723 | 4.79e-06 | 5.08e-05 | 142 |
| GO:00324653 | Esophagus | ESCC | regulation of cytokinesis | 57/8552 | 92/18723 | 1.20e-03 | 5.88e-03 | 57 |
| GO:00513025 | Esophagus | ESCC | regulation of cell division | 97/8552 | 177/18723 | 8.93e-03 | 3.12e-02 | 97 |
| GO:01400145 | Oral cavity | OSCC | mitotic nuclear division | 191/7305 | 287/18723 | 1.99e-21 | 3.70e-19 | 191 |
| Page: 1 2 3 4 |
| Pathway ID | Tissue | Disease Stage | Description | Gene Ratio | Bg Ratio | pvalue | p.adjust | qvalue | Count |
| Page: 1 |
Top |
Cell-cell communication analysis |
| Identification of potential cell-cell interactions between two cell types and their ligand-receptor pairs for different disease states |
| Ligand | Receptor | LRpair | Pathway | Tissue | Disease Stage |
| Page: 1 |
Top |
Single-cell gene regulatory network inference analysis |
| Find out the significant the regulons (TFs) and the target genes of each regulon across cell types for different disease states |
| TF | Cell Type | Tissue | Disease Stage | Target Gene | RSS | Regulon Activity |
| ∗The dot plots of a searched regulon are shown for all cell subpopulations in each disease state of each tissue based on the regulon specific score inferred using pySCENIC and by calculating the average expression. |
| Page: 1 |
Top |
Somatic mutation of malignant transformation related genes |
| Annotation of somatic variants for genes involved in malignant transformation |
| Hugo Symbol | Variant Class | Variant Classification | dbSNP RS | HGVSc | HGVSp | HGVSp Short | SWISSPROT | BIOTYPE | SIFT | PolyPhen | Tumor Sample Barcode | Tissue | Histology | Sex | Age | Stage | Therapy Types | Drugs | Outcome |
| KIF23 | SNV | Missense_Mutation | novel | c.2631G>T | p.Lys877Asn | p.K877N | Q02241 | protein_coding | deleterious(0) | probably_damaging(0.993) | TCGA-AN-A046-01 | Breast | breast invasive carcinoma | Female | >=65 | I/II | Unknown | Unknown | SD |
| KIF23 | SNV | Missense_Mutation | rs771100209 | c.1760G>A | p.Arg587His | p.R587H | Q02241 | protein_coding | deleterious(0.02) | possibly_damaging(0.8) | TCGA-AN-A0AK-01 | Breast | breast invasive carcinoma | Female | >=65 | I/II | Unknown | Unknown | SD |
| KIF23 | SNV | Missense_Mutation | novel | c.592N>G | p.Met198Val | p.M198V | Q02241 | protein_coding | deleterious(0.03) | benign(0.031) | TCGA-BH-A18G-01 | Breast | breast invasive carcinoma | Female | >=65 | I/II | Unknown | Unknown | SD |
| KIF23 | SNV | Missense_Mutation | c.2186N>C | p.Trp729Ser | p.W729S | Q02241 | protein_coding | deleterious(0.02) | probably_damaging(0.996) | TCGA-D8-A1JC-01 | Breast | breast invasive carcinoma | Female | <65 | III/IV | Chemotherapy | adriamycin | SD | |
| KIF23 | insertion | Frame_Shift_Ins | novel | c.1258_1259insGTGTGTGTGCTGTCTGTCA | p.Tyr420CysfsTer8 | p.Y420Cfs*8 | Q02241 | protein_coding | TCGA-A2-A0EQ-01 | Breast | breast invasive carcinoma | Female | <65 | I/II | Chemotherapy | adriamycin | SD | ||
| KIF23 | insertion | Frame_Shift_Ins | novel | c.2055_2056insAT | p.Ser686IlefsTer21 | p.S686Ifs*21 | Q02241 | protein_coding | TCGA-A7-A26I-01 | Breast | breast invasive carcinoma | Female | >=65 | I/II | Chemotherapy | cytoxan | SD | ||
| KIF23 | deletion | Frame_Shift_Del | novel | c.1703_1707delNNNNN | p.Glu569Ter | p.E569* | Q02241 | protein_coding | TCGA-AC-A8OS-01 | Breast | breast invasive carcinoma | Female | >=65 | I/II | Unknown | Unknown | SD | ||
| KIF23 | insertion | Frame_Shift_Ins | novel | c.932_933insACATGTTGGTGTGAGAT | p.Ala312HisfsTer25 | p.A312Hfs*25 | Q02241 | protein_coding | TCGA-AO-A03R-01 | Breast | breast invasive carcinoma | Female | <65 | I/II | Chemotherapy | doxorubicin | SD | ||
| KIF23 | insertion | Frame_Shift_Ins | novel | c.1472_1473insCAATGGATTATTTTGTGAGAGATTTGAAGAT | p.Glu491AspfsTer19 | p.E491Dfs*19 | Q02241 | protein_coding | TCGA-BH-A0BD-01 | Breast | breast invasive carcinoma | Female | <65 | I/II | Chemotherapy | doxorubicin | SD | ||
| KIF23 | deletion | Frame_Shift_Del | novel | c.1242delN | p.Lys416ArgfsTer12 | p.K416Rfs*12 | Q02241 | protein_coding | TCGA-EW-A2FV-01 | Breast | breast invasive carcinoma | Female | <65 | III/IV | Chemotherapy | docetaxel | SD |
| Page: 1 2 3 4 5 6 7 8 9 |
Top |
Related drugs of malignant transformation related genes |
| Identification of chemicals and drugs interact with genes involved in malignant transfromation |
| (DGIdb 4.0) |
| Entrez ID | Symbol | Category | Interaction Types | Drug Claim Name | Drug Name | PMIDs |
| Page: 1 |

Copyright 2023-Present -The University of Texas Health Science Center at Houston |