Schematic overview of the cellular and molecular mechanisms involved in the cancer progression, including the proposed cellular and molecular mechanisms in cancer cells trajectory. AT1: alveolar type 1 cells; AT2: alveolar type 2 cells; AAH: atypical adenomatous hyperplasia; AIS: adenocarcinoma in situ; MIA: minimally invasive adenocarcinoma; IA: invasive adenocarcinoma; EMT: epithelial-mesenchymal transition

Home

Download

Statistics

Help

Contact

Center for Computational Systems Medicine
leaf

Gene summary

leaf

Malignant transformation analysis

leaf

Malignant transformation related pathway analysis

leaf

Cell-cell communication analysis

leaf

Single-cell gene regulatory network inference analysis

leaf

Somatic mutation of malignant transformation related genes

leaf

Related drugs of malignant transformation related genes

Gene: KIF22

Gene summary for KIF22

check button Gene summary.

Gene informationSpeciesHuman
Gene symbol

KIF22

Gene ID

3835

Gene namekinesin family member 22
Gene AliasA-328A3.2
Cytomap16p11.2
Gene Typeprotein-coding
GO ID

GO:0000070

UniProtAcc

A0A024R632


Top

Malignant transformation analysis

check button Identification of the aberrant gene expression in precancerous and cancerous lesions by comparing the gene expression of stem-like cells in diseased tissues with normal stem cells
check button Malignant transformation involving gene list.
Entrez IDSymbolReplicatesSpeciesOrganTissueAdj P-valueLog2FCMalignancy
3835KIF22GSM4909290HumanBreastIDC1.28e-094.00e-010.2096
3835KIF22GSM4909291HumanBreastIDC9.01e-083.94e-010.1753
3835KIF22GSM4909293HumanBreastIDC2.13e-154.48e-010.1581
3835KIF22GSM4909294HumanBreastIDC1.77e-022.31e-010.2022
3835KIF22GSM4909296HumanBreastIDC4.51e-052.96e-010.1524
3835KIF22GSM4909301HumanBreastIDC4.90e-277.12e-010.1577
3835KIF22GSM4909304HumanBreastIDC3.99e-336.54e-010.1636
3835KIF22GSM4909306HumanBreastIDC5.94e-499.21e-010.1564
3835KIF22GSM4909307HumanBreastIDC2.53e-032.97e-010.1569
3835KIF22GSM4909311HumanBreastIDC9.05e-121.41e-010.1534
3835KIF22GSM4909313HumanBreastIDC2.04e-032.08e-010.0391
3835KIF22GSM4909317HumanBreastIDC2.37e-022.17e-010.1355
3835KIF22GSM4909319HumanBreastIDC3.44e-101.49e-010.1563
3835KIF22GSM4909321HumanBreastIDC1.52e-052.60e-010.1559
3835KIF22M2HumanBreastIDC4.12e-033.30e-010.21
3835KIF22DCIS2HumanBreastDCIS4.18e-277.54e-020.0085
3835KIF22HTA11_347_2000001011HumanColorectumAD6.48e-113.15e-01-0.1954
3835KIF22HTA11_696_2000001011HumanColorectumAD7.10e-083.41e-01-0.1464
3835KIF22HTA11_1391_2000001011HumanColorectumAD9.52e-032.28e-01-0.059
3835KIF22LZE4THumanEsophagusESCC1.56e-042.66e-010.0811
Page: 1 2 3 4 5 6 7 

check button Transcriptomic changes along malignancy continuum.
TissueExpression DynamicsAbbreviation
BreastThe image shows the transcriptomic changes along malignancy continuum.log2FC in expression of this searched gene in stem-like cells from each diseased tissue sample relative to stem-like cells in normal samples in each tissue plotted against the malignancy continuum. Samples are colored based on if they are from different disease stage.
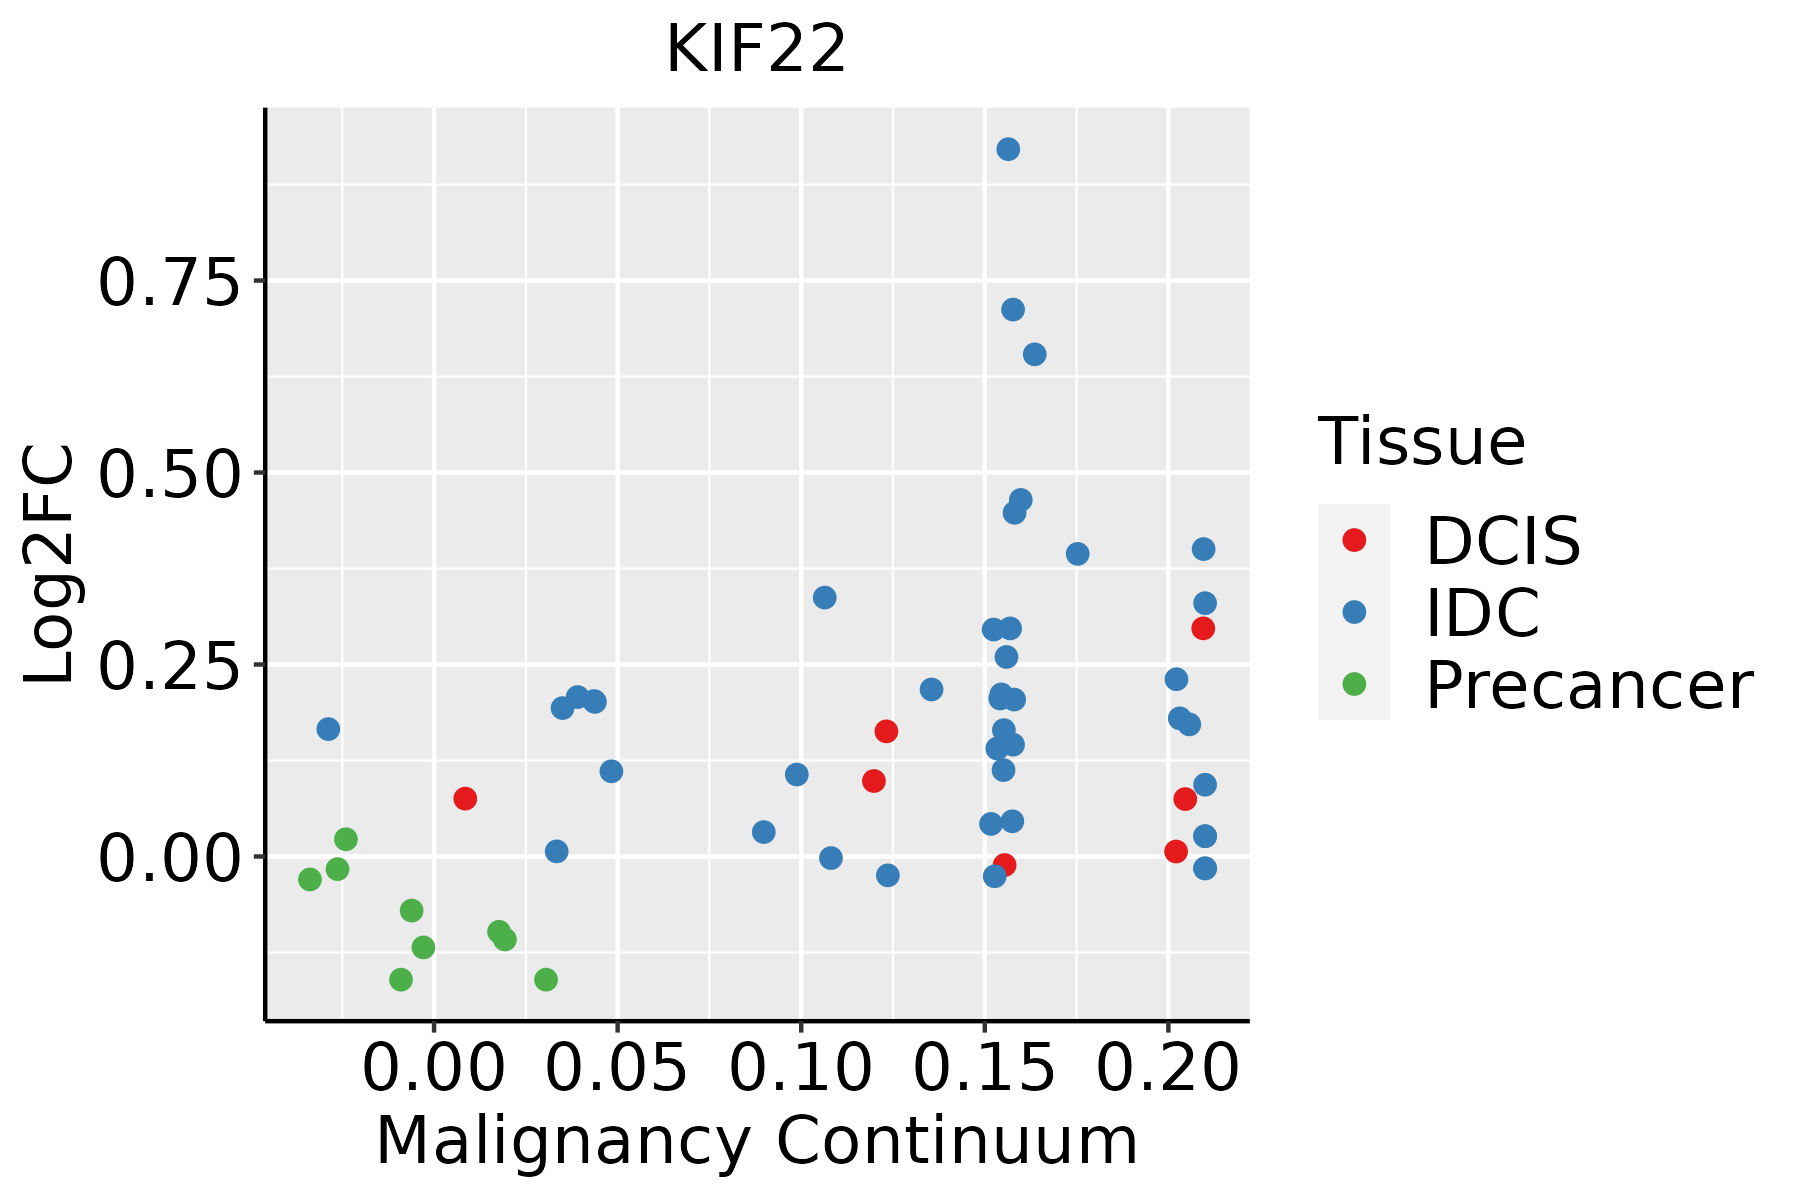
IDC: Invasive ductal carcinoma
DCIS: Ductal carcinoma in situ
Precancer(BRCA1-mut): Precancerous lesion from BRCA1 mutation carriers
Colorectum (GSE201348)The image shows the transcriptomic changes along malignancy continuum.log2FC in expression of this searched gene in stem-like cells from each diseased tissue sample relative to stem-like cells in normal samples in each tissue plotted against the malignancy continuum. Samples are colored based on if they are from different disease stage.FAP: Familial adenomatous polyposis
CRC: Colorectal cancer
Colorectum (HTA11)The image shows the transcriptomic changes along malignancy continuum.log2FC in expression of this searched gene in stem-like cells from each diseased tissue sample relative to stem-like cells in normal samples in each tissue plotted against the malignancy continuum. Samples are colored based on if they are from different disease stage.AD: Adenomas
SER: Sessile serrated lesions
MSI-H: Microsatellite-high colorectal cancer
MSS: Microsatellite stable colorectal cancer
EsophagusThe image shows the transcriptomic changes along malignancy continuum.log2FC in expression of this searched gene in stem-like cells from each diseased tissue sample relative to stem-like cells in normal samples in each tissue plotted against the malignancy continuum. Samples are colored based on if they are from different disease stage.
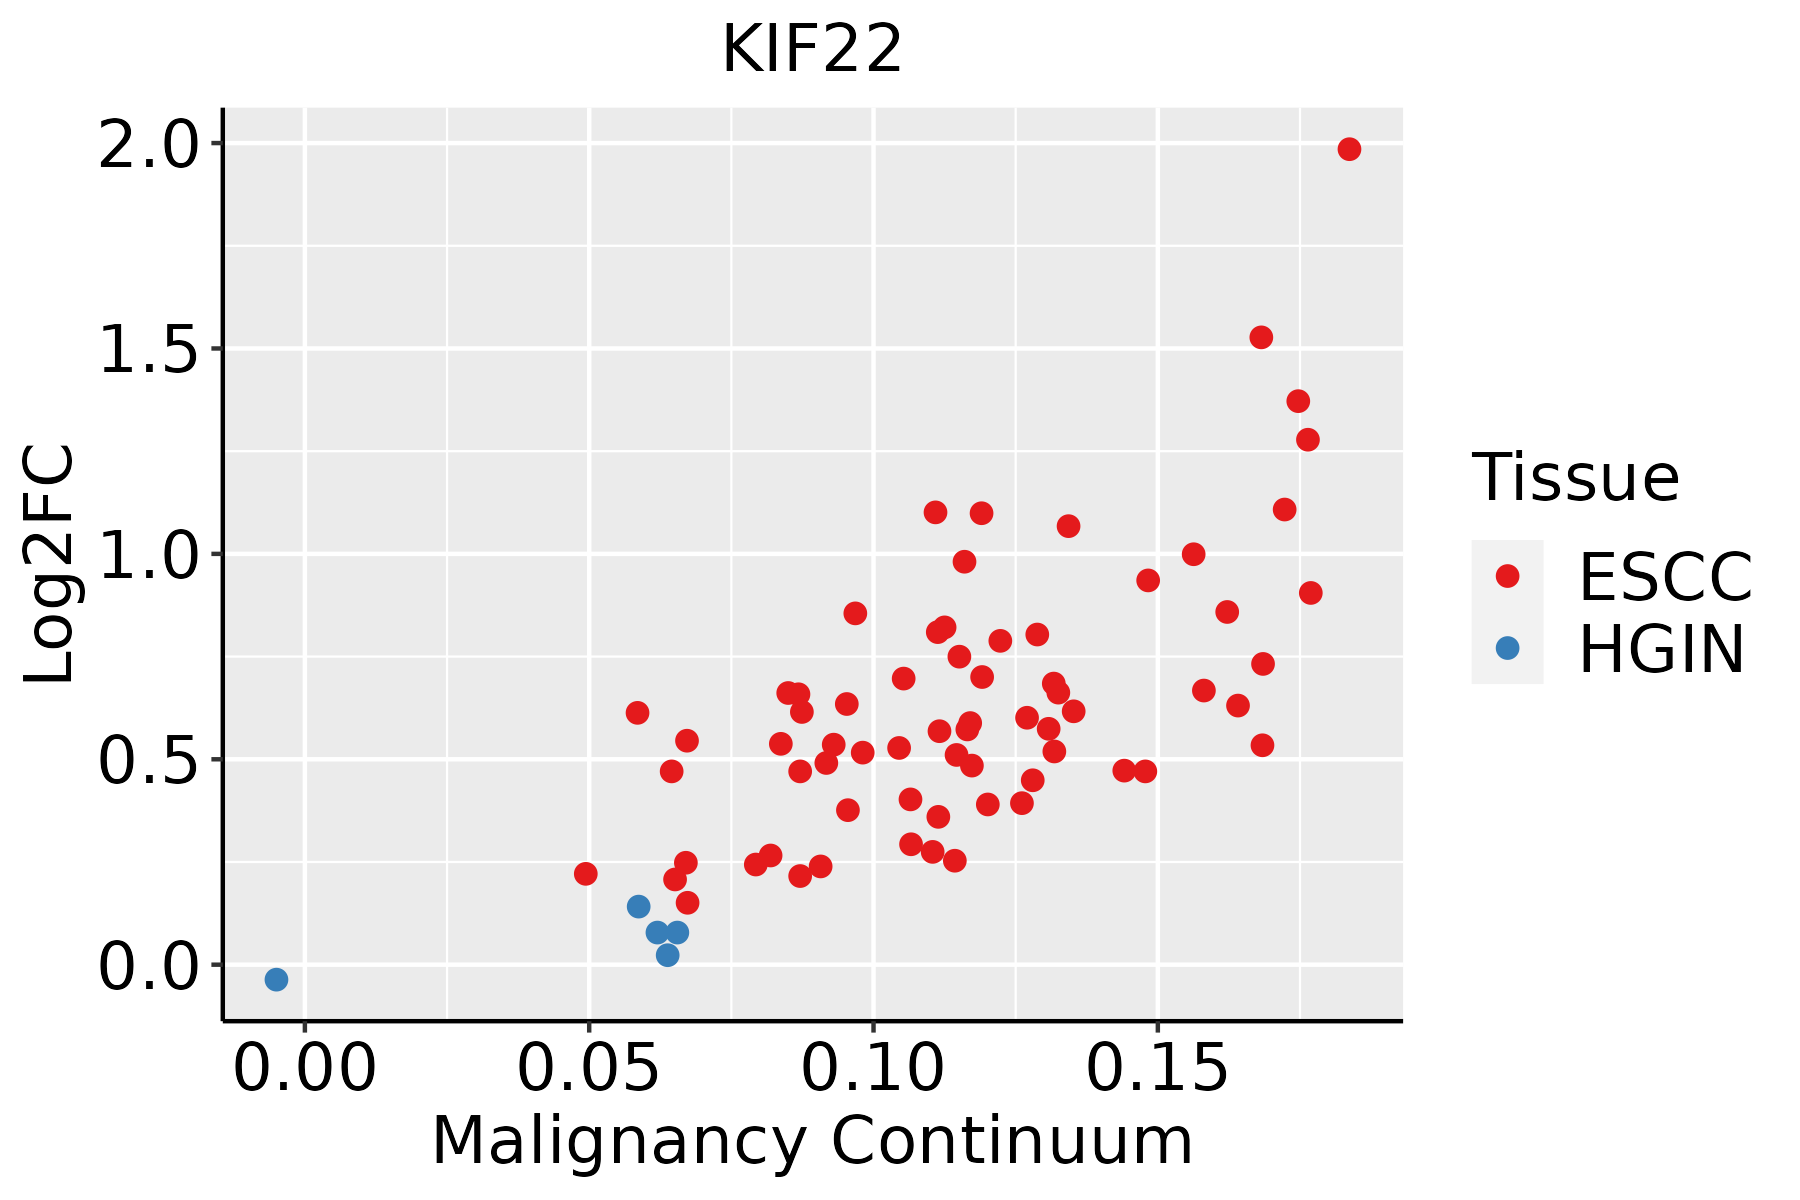
ESCC: Esophageal squamous cell carcinoma
HGIN: High-grade intraepithelial neoplasias
LGIN: Low-grade intraepithelial neoplasias
LiverThe image shows the transcriptomic changes along malignancy continuum.log2FC in expression of this searched gene in stem-like cells from each diseased tissue sample relative to stem-like cells in normal samples in each tissue plotted against the malignancy continuum. Samples are colored based on if they are from different disease stage.HCC: Hepatocellular carcinoma
NAFLD: Non-alcoholic fatty liver disease
Oral CavityThe image shows the transcriptomic changes along malignancy continuum.log2FC in expression of this searched gene in stem-like cells from each diseased tissue sample relative to stem-like cells in normal samples in each tissue plotted against the malignancy continuum. Samples are colored based on if they are from different disease stage.EOLP: Erosive Oral lichen planus
LP: leukoplakia
NEOLP: Non-erosive oral lichen planus
OSCC: Oral squamous cell carcinoma
ProstateThe image shows the transcriptomic changes along malignancy continuum.log2FC in expression of this searched gene in stem-like cells from each diseased tissue sample relative to stem-like cells in normal samples in each tissue plotted against the malignancy continuum. Samples are colored based on if they are from different disease stage.
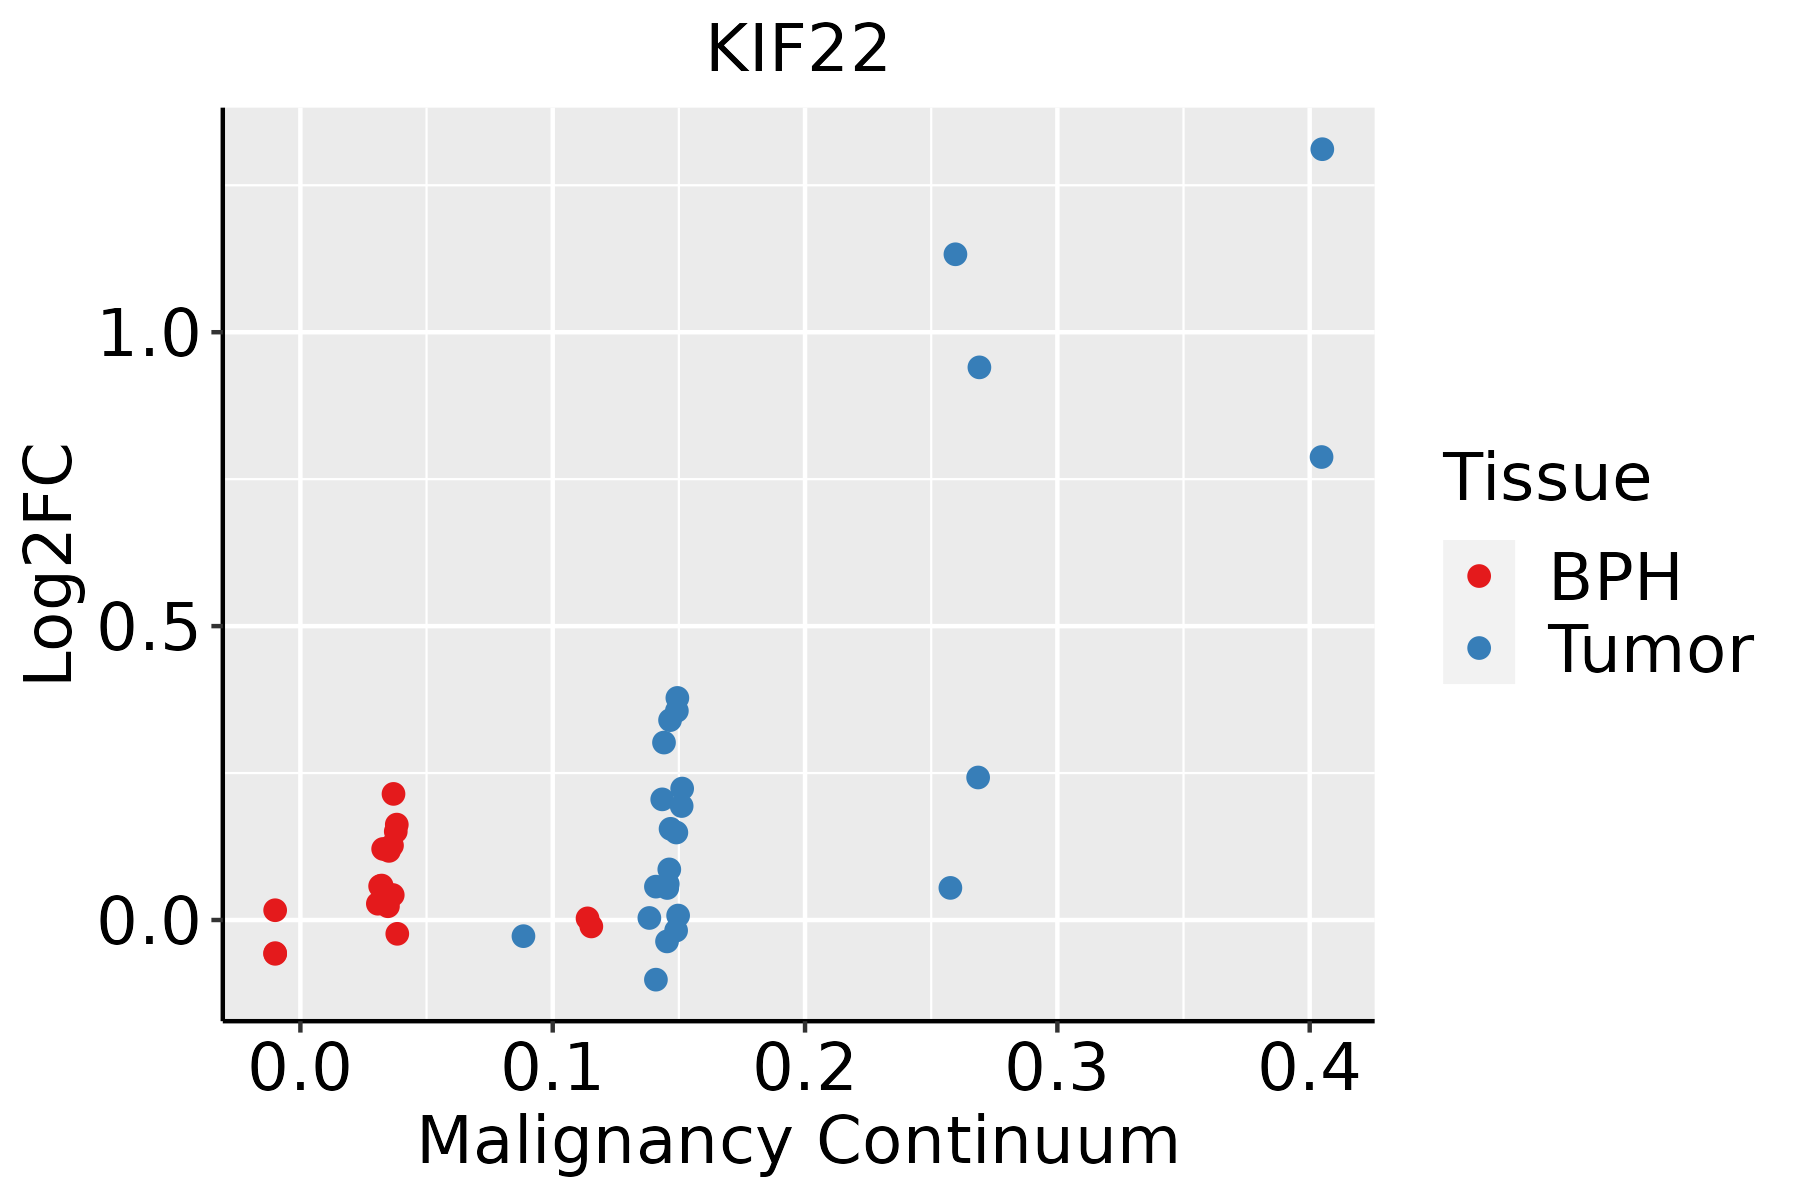
BPH: Benign Prostatic Hyperplasia
SkinThe image shows the transcriptomic changes along malignancy continuum.log2FC in expression of this searched gene in stem-like cells from each diseased tissue sample relative to stem-like cells in normal samples in each tissue plotted against the malignancy continuum. Samples are colored based on if they are from different disease stage.AK: Actinic keratosis
cSCC: Cutaneous squamous cell carcinoma
SCCIS:squamous cell carcinoma in situ
ThyroidThe image shows the transcriptomic changes along malignancy continuum.log2FC in expression of this searched gene in stem-like cells from each diseased tissue sample relative to stem-like cells in normal samples in each tissue plotted against the malignancy continuum. Samples are colored based on if they are from different disease stage.
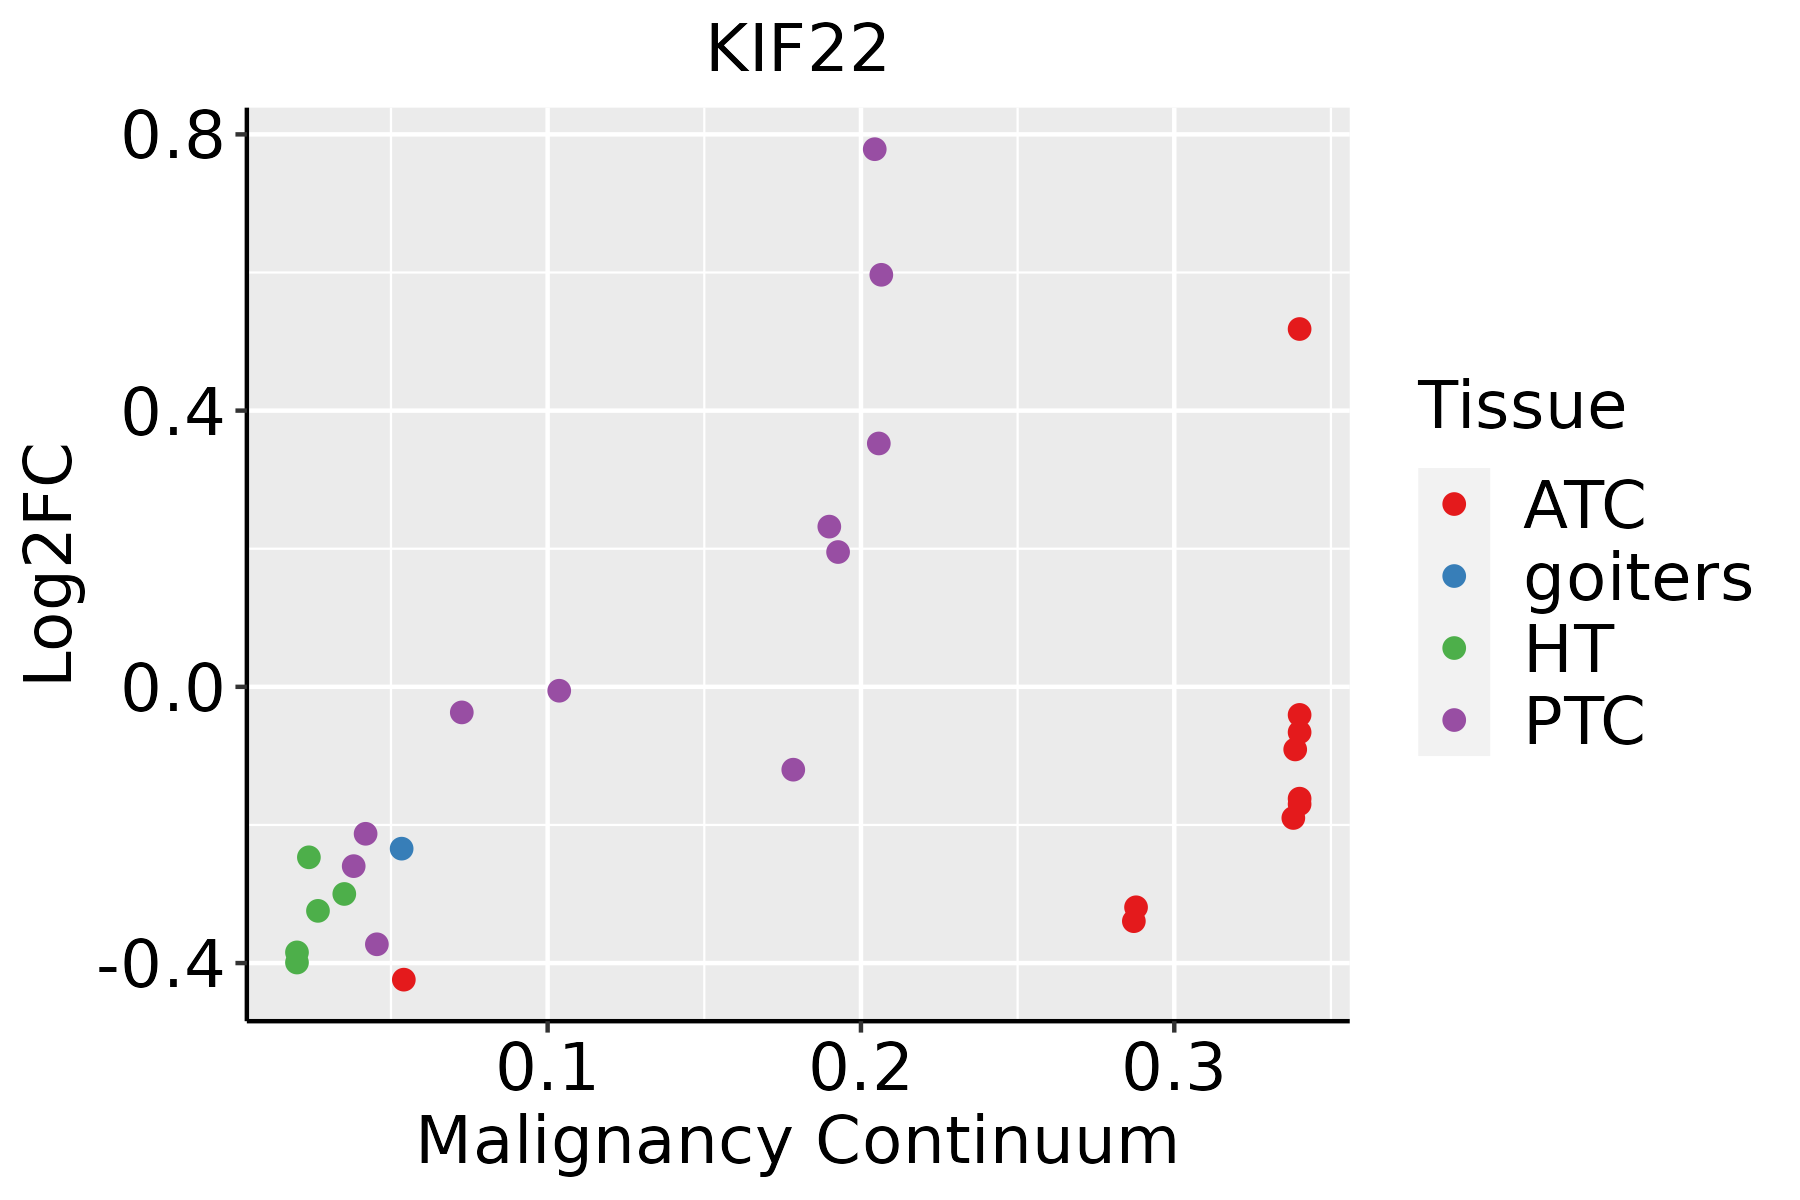
ATC: Anaplastic thyroid cancer
HT: Hashimoto's thyroiditis
PTC: Papillary thyroid cancer
∗log2FC in expression of this searched gene in stem-like cells from each diseased tissue sample relative to stem-like cells in normal samples in each tissue plotted against the malignancy continuum. Samples are colored based on if they are from different disease stage.

Top

Malignant transformation related pathway analysis

check buttonFind out the enriched GO biological processes and KEGG pathways involved in transition from healthy to precancer to cancer
check button Figure of enriched GO biological processes.
TissueDisease StageEnriched GO biological Processes
ColorectumADGO analysis - Figure of enriched GO biological processes: Top 15 enriched GO BP terms are showed in the bar plot of each disease state in each tissue. Each row represents a significant GO biological process which is colored according to the -log10(p.adjust).
ColorectumSERGO analysis - Figure of enriched GO biological processes: Top 15 enriched GO BP terms are showed in the bar plot of each disease state in each tissue. Each row represents a significant GO biological process which is colored according to the -log10(p.adjust).
ColorectumMSSGO analysis - Figure of enriched GO biological processes: Top 15 enriched GO BP terms are showed in the bar plot of each disease state in each tissue. Each row represents a significant GO biological process which is colored according to the -log10(p.adjust).
ColorectumMSI-HGO analysis - Figure of enriched GO biological processes: Top 15 enriched GO BP terms are showed in the bar plot of each disease state in each tissue. Each row represents a significant GO biological process which is colored according to the -log10(p.adjust).
ColorectumFAPGO analysis - Figure of enriched GO biological processes: Top 15 enriched GO BP terms are showed in the bar plot of each disease state in each tissue. Each row represents a significant GO biological process which is colored according to the -log10(p.adjust).
∗Top 15 enriched GO BP terms are showed in the bar plot of each disease state in each tissue. Each row represents a significant GO biological process which is colored according to the -log10(p.adjust).
Page: 1 2 3 4 5 6 7 8 9 

check button Enriched GO biological processes.
GO IDTissueDisease StageDescriptionGene RatioBg Ratiopvaluep.adjustCount
GO:0051656ColorectumADestablishment of organelle localization131/3918390/187233.00e-092.06e-07131
GO:0007062ColorectumADsister chromatid cohesion23/391862/187232.51e-031.92e-0223
GO:0140014ColorectumADmitotic nuclear division78/3918287/187236.48e-034.05e-0278
GO:005165616EsophagusHGINestablishment of organelle localization90/2587390/187234.27e-071.94e-0590
GO:00500003EsophagusHGINchromosome localization24/258782/187232.07e-043.82e-0324
GO:01400146EsophagusHGINmitotic nuclear division61/2587287/187233.38e-045.55e-0361
GO:00070593EsophagusHGINchromosome segregation71/2587346/187233.47e-045.62e-0371
GO:00513033EsophagusHGINestablishment of chromosome localization23/258780/187233.71e-045.77e-0323
GO:00070803EsophagusHGINmitotic metaphase plate congression15/258750/187232.35e-032.39e-0215
GO:00513103EsophagusHGINmetaphase plate congression18/258765/187232.46e-032.45e-0218
GO:00000703EsophagusHGINmitotic sister chromatid segregation36/2587168/187234.42e-033.87e-0236
GO:014001414EsophagusESCCmitotic nuclear division218/8552287/187236.17e-261.78e-23218
GO:005165617EsophagusESCCestablishment of organelle localization273/8552390/187239.13e-231.81e-20273
GO:000007011EsophagusESCCmitotic sister chromatid segregation138/8552168/187231.37e-222.63e-20138
GO:00008194EsophagusESCCsister chromatid segregation157/8552202/187238.41e-211.33e-18157
GO:000705911EsophagusESCCchromosome segregation238/8552346/187231.72e-181.82e-16238
GO:005131011EsophagusESCCmetaphase plate congression58/855265/187231.81e-138.63e-1258
GO:000708011EsophagusESCCmitotic metaphase plate congression47/855250/187233.15e-131.47e-1147
GO:00482853EsophagusESCCorganelle fission301/8552488/187234.64e-132.12e-11301
GO:00988133EsophagusESCCnuclear chromosome segregation187/8552281/187231.00e-124.36e-11187
Page: 1 2 3 4 5 6 

check button Enriched KEGG pathways.
Pathway IDTissueDisease StageDescriptionGene RatioBg Ratiopvaluep.adjustqvalueCount
Page: 1 

Top

Cell-cell communication analysis

check buttonIdentification of potential cell-cell interactions between two cell types and their ligand-receptor pairs for different disease states
LigandReceptorLRpairPathwayTissueDisease Stage
Page: 1 

Top

Single-cell gene regulatory network inference analysis

check buttonFind out the significant the regulons (TFs) and the target genes of each regulon across cell types for different disease states
TFCell TypeTissueDisease StageTarget GeneRSSRegulon Activity
∗The dot plots of a searched regulon are shown for all cell subpopulations in each disease state of each tissue based on the regulon specific score inferred using pySCENIC and by calculating the average expression.
Page: 1 

Top

Somatic mutation of malignant transformation related genes

check buttonAnnotation of somatic variants for genes involved in malignant transformation
Hugo SymbolVariant ClassVariant ClassificationdbSNP RSHGVScHGVSpHGVSp ShortSWISSPROTBIOTYPESIFTPolyPhenTumor Sample BarcodeTissueHistologySexAgeStageTherapy TypesDrugsOutcome
KIF22SNVMissense_Mutationrs775371597c.689G>Ap.Arg230Glnp.R230QQ14807protein_codingtolerated(0.64)benign(0.003)TCGA-AN-A046-01Breastbreast invasive carcinomaFemale>=65I/IIUnknownUnknownSD
KIF22SNVMissense_Mutationc.341N>Gp.His114Argp.H114RQ14807protein_codingdeleterious(0.03)possibly_damaging(0.451)TCGA-BH-A0HA-01Breastbreast invasive carcinomaFemale<65I/IIUnknownUnknownSD
KIF22SNVMissense_Mutationrs766845044c.1334N>Ap.Ser445Asnp.S445NQ14807protein_codingtolerated(0.21)benign(0.003)TCGA-BH-A0HP-01Breastbreast invasive carcinomaFemale>=65III/IVChemotherapydoxorubicinSD
KIF22SNVMissense_Mutationc.1639N>Ap.Glu547Lysp.E547KQ14807protein_codingtolerated(0.51)benign(0)TCGA-D8-A1JD-01Breastbreast invasive carcinomaFemale<65I/IIChemotherapyadriamycinSD
KIF22SNVMissense_Mutationnovelc.1938N>Tp.Glu646Aspp.E646DQ14807protein_codingtolerated(0.45)benign(0.035)TCGA-LL-A73Z-01Breastbreast invasive carcinomaFemale<65III/IVChemotherapyadriamycinPD
KIF22insertionNonsense_Mutationnovelc.154_155insACTTCCCCTTCCCCTTAGATTGATCAp.Pro52HisfsTer8p.P52Hfs*8Q14807protein_codingTCGA-AO-A0JB-01Breastbreast invasive carcinomaFemale<65III/IVChemotherapycyclophosphamideSD
KIF22SNVMissense_Mutationnovelc.1766G>Ap.Arg589Hisp.R589HQ14807protein_codingtolerated(0.07)possibly_damaging(0.614)TCGA-2W-A8YY-01Cervixcervical & endocervical cancerFemale<65I/IIChemotherapycisplatinCR
KIF22SNVMissense_Mutationnovelc.1378N>Gp.Leu460Valp.L460VQ14807protein_codingtolerated(0.17)benign(0.001)TCGA-C5-A1MH-01Cervixcervical & endocervical cancerFemale>=65III/IVChemotherapycisplatinPD
KIF22SNVMissense_Mutationrs780221407c.1208G>Ap.Arg403Glnp.R403QQ14807protein_codingtolerated(0.17)benign(0.01)TCGA-EK-A2RB-01Cervixcervical & endocervical cancerFemale<65I/IIUnknownUnknownSD
KIF22SNVMissense_Mutationc.1792N>Cp.Glu598Glnp.E598QQ14807protein_codingtolerated(0.39)benign(0.058)TCGA-JW-A5VL-01Cervixcervical & endocervical cancerFemale<65I/IIUnknownUnknownSD
Page: 1 2 3 4 5 6 7 

Top

Related drugs of malignant transformation related genes

check buttonIdentification of chemicals and drugs interact with genes involved in malignant transfromation
(DGIdb 4.0)
Entrez IDSymbolCategoryInteraction TypesDrug Claim NameDrug NamePMIDs
Page: 1