
|
|||||
|
 | |
| |
| |
| |
| |
| |
|
Gene: KIF21A |
Gene summary for KIF21A |
| Gene information | Species | Human | Gene symbol | KIF21A | Gene ID | 55605 |
| Gene name | kinesin family member 21A | |
| Gene Alias | CFEOM1 | |
| Cytomap | 12q12 | |
| Gene Type | protein-coding | GO ID | GO:0006928 | UniProtAcc | Q7Z4S6 |
Top |
Malignant transformation analysis |
| Identification of the aberrant gene expression in precancerous and cancerous lesions by comparing the gene expression of stem-like cells in diseased tissues with normal stem cells |
| Entrez ID | Symbol | Replicates | Species | Organ | Tissue | Adj P-value | Log2FC | Malignancy |
| 55605 | KIF21A | LZE2T | Human | Esophagus | ESCC | 1.56e-04 | 9.14e-01 | 0.082 |
| 55605 | KIF21A | LZE4T | Human | Esophagus | ESCC | 1.07e-06 | 3.55e-01 | 0.0811 |
| 55605 | KIF21A | LZE7T | Human | Esophagus | ESCC | 9.55e-03 | 2.65e-01 | 0.0667 |
| 55605 | KIF21A | LZE20T | Human | Esophagus | ESCC | 1.21e-03 | 1.86e-01 | 0.0662 |
| 55605 | KIF21A | LZE22T | Human | Esophagus | ESCC | 1.59e-02 | 2.50e-01 | 0.068 |
| 55605 | KIF21A | LZE24T | Human | Esophagus | ESCC | 2.30e-09 | 4.48e-01 | 0.0596 |
| 55605 | KIF21A | P1T-E | Human | Esophagus | ESCC | 8.99e-13 | 4.40e-01 | 0.0875 |
| 55605 | KIF21A | P2T-E | Human | Esophagus | ESCC | 6.18e-29 | 6.23e-01 | 0.1177 |
| 55605 | KIF21A | P4T-E | Human | Esophagus | ESCC | 3.37e-12 | 5.29e-01 | 0.1323 |
| 55605 | KIF21A | P5T-E | Human | Esophagus | ESCC | 2.48e-20 | 5.05e-01 | 0.1327 |
| 55605 | KIF21A | P8T-E | Human | Esophagus | ESCC | 2.73e-12 | 2.85e-01 | 0.0889 |
| 55605 | KIF21A | P9T-E | Human | Esophagus | ESCC | 4.15e-17 | 5.41e-01 | 0.1131 |
| 55605 | KIF21A | P10T-E | Human | Esophagus | ESCC | 2.45e-34 | 7.25e-01 | 0.116 |
| 55605 | KIF21A | P11T-E | Human | Esophagus | ESCC | 1.10e-05 | 4.64e-01 | 0.1426 |
| 55605 | KIF21A | P12T-E | Human | Esophagus | ESCC | 2.00e-89 | 1.82e+00 | 0.1122 |
| 55605 | KIF21A | P15T-E | Human | Esophagus | ESCC | 7.49e-21 | 6.55e-01 | 0.1149 |
| 55605 | KIF21A | P16T-E | Human | Esophagus | ESCC | 8.90e-08 | 1.50e-01 | 0.1153 |
| 55605 | KIF21A | P20T-E | Human | Esophagus | ESCC | 7.20e-28 | 6.95e-01 | 0.1124 |
| 55605 | KIF21A | P21T-E | Human | Esophagus | ESCC | 1.06e-09 | 2.09e-01 | 0.1617 |
| 55605 | KIF21A | P22T-E | Human | Esophagus | ESCC | 2.48e-15 | 2.82e-01 | 0.1236 |
| Page: 1 2 3 4 5 6 |
| Tissue | Expression Dynamics | Abbreviation |
| Esophagus | 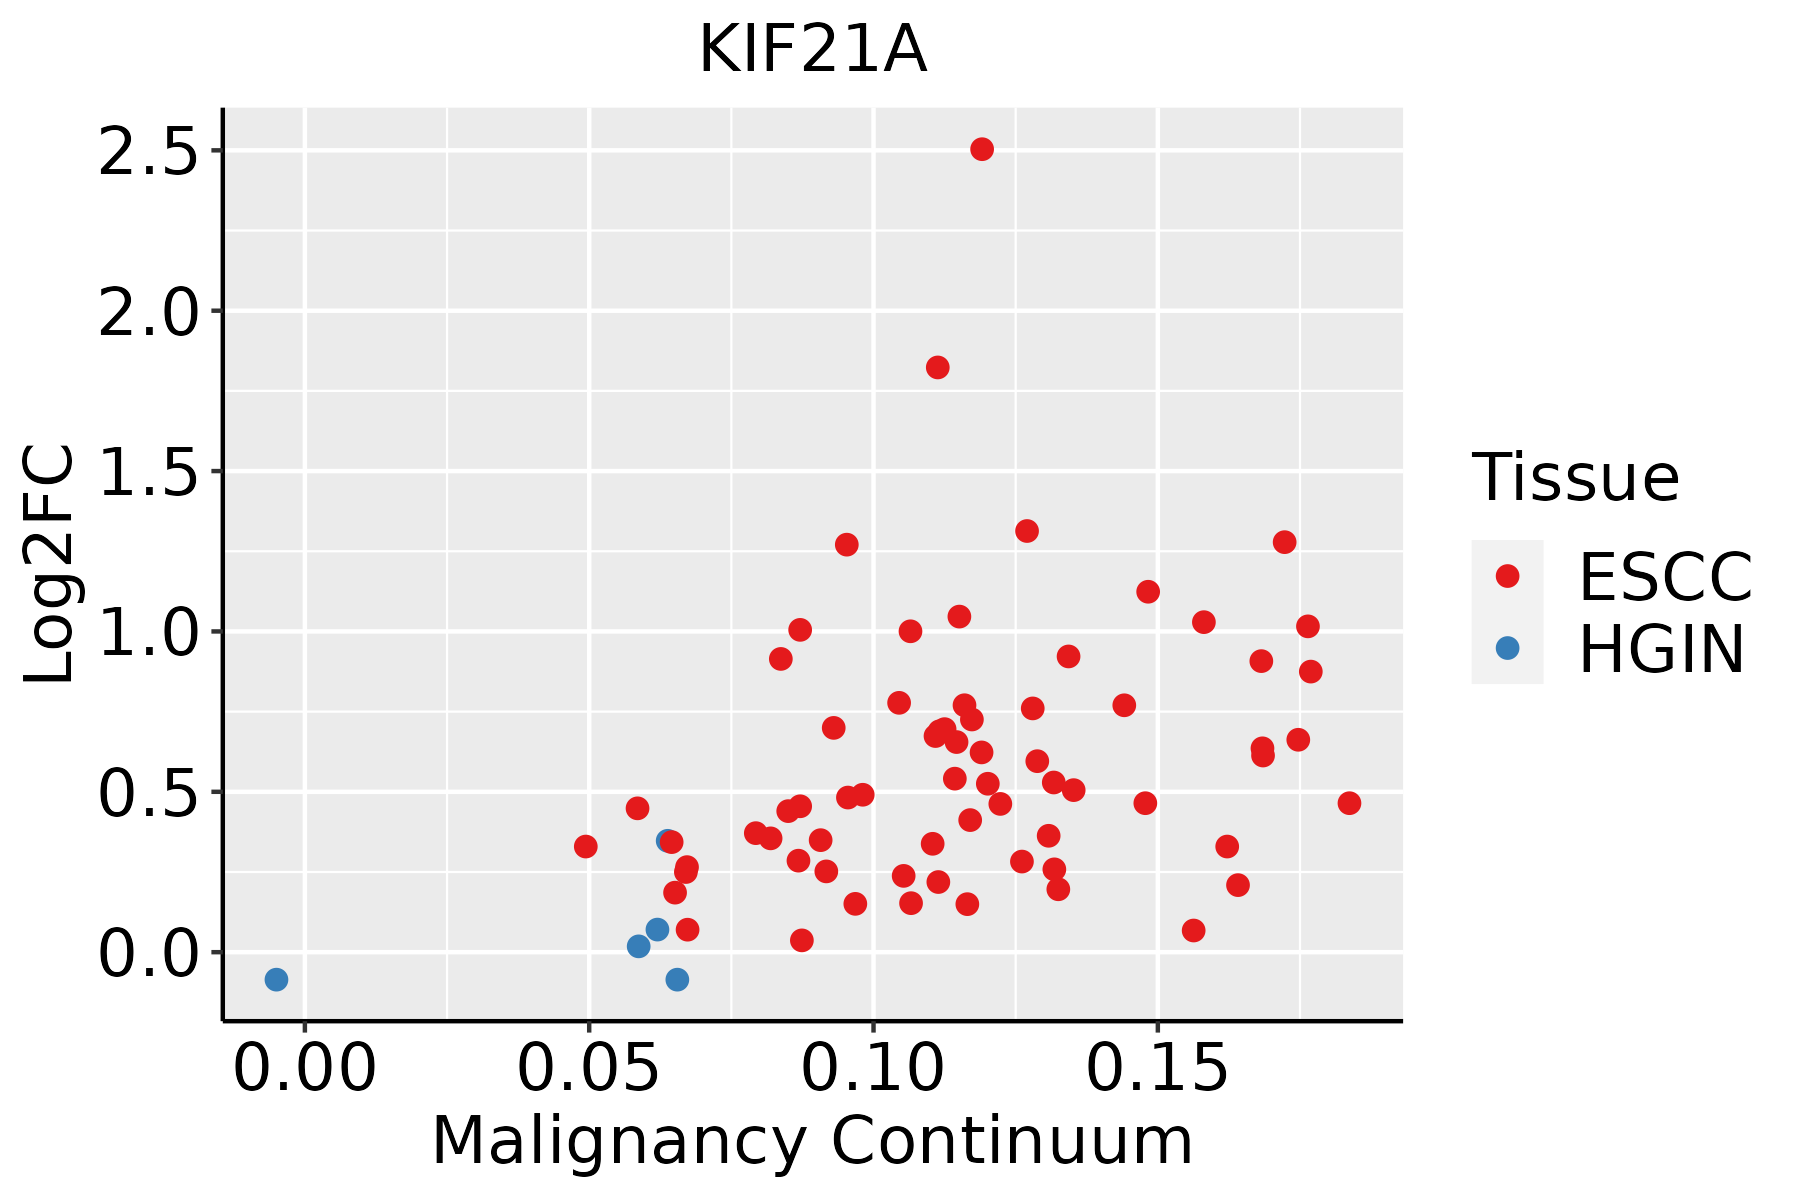 | ESCC: Esophageal squamous cell carcinoma |
| HGIN: High-grade intraepithelial neoplasias | ||
| LGIN: Low-grade intraepithelial neoplasias | ||
| Liver | 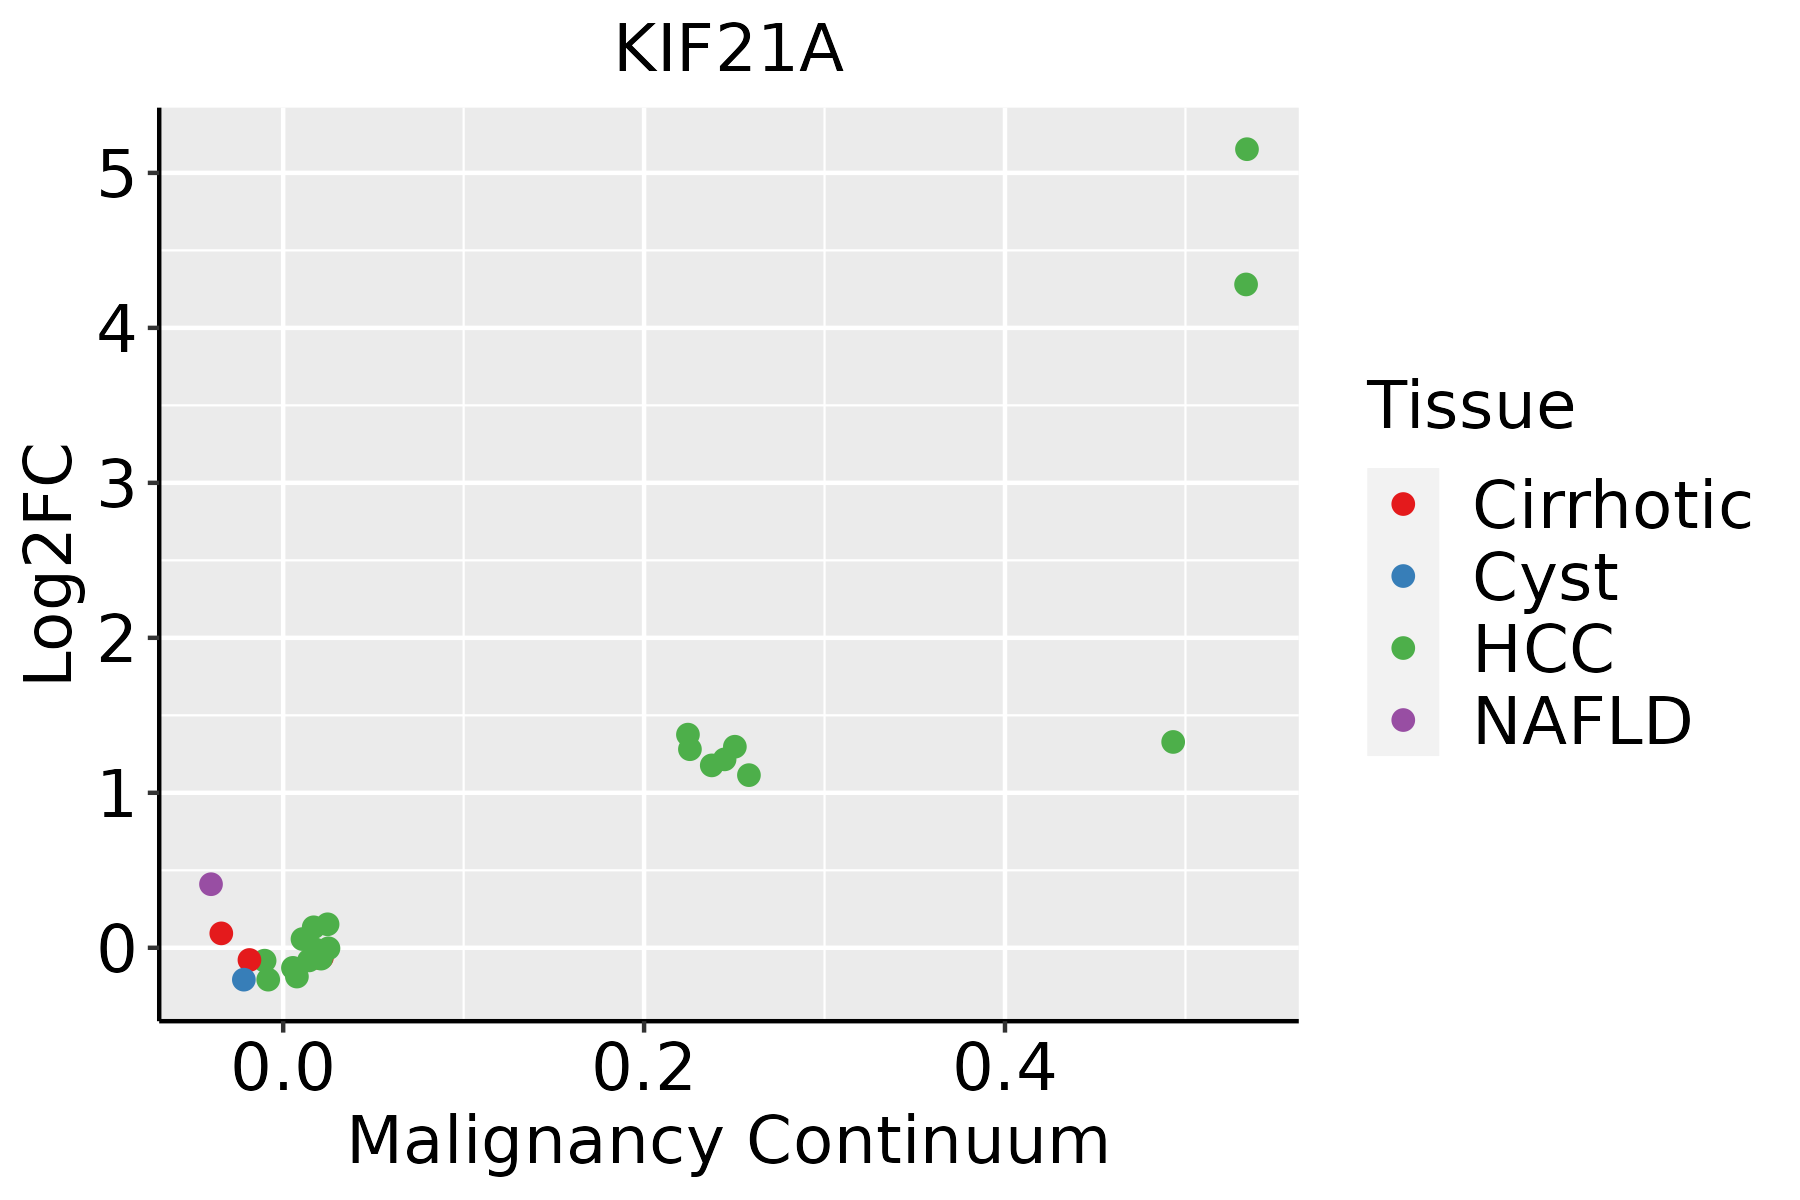 | HCC: Hepatocellular carcinoma |
| NAFLD: Non-alcoholic fatty liver disease | ||
| Oral Cavity | 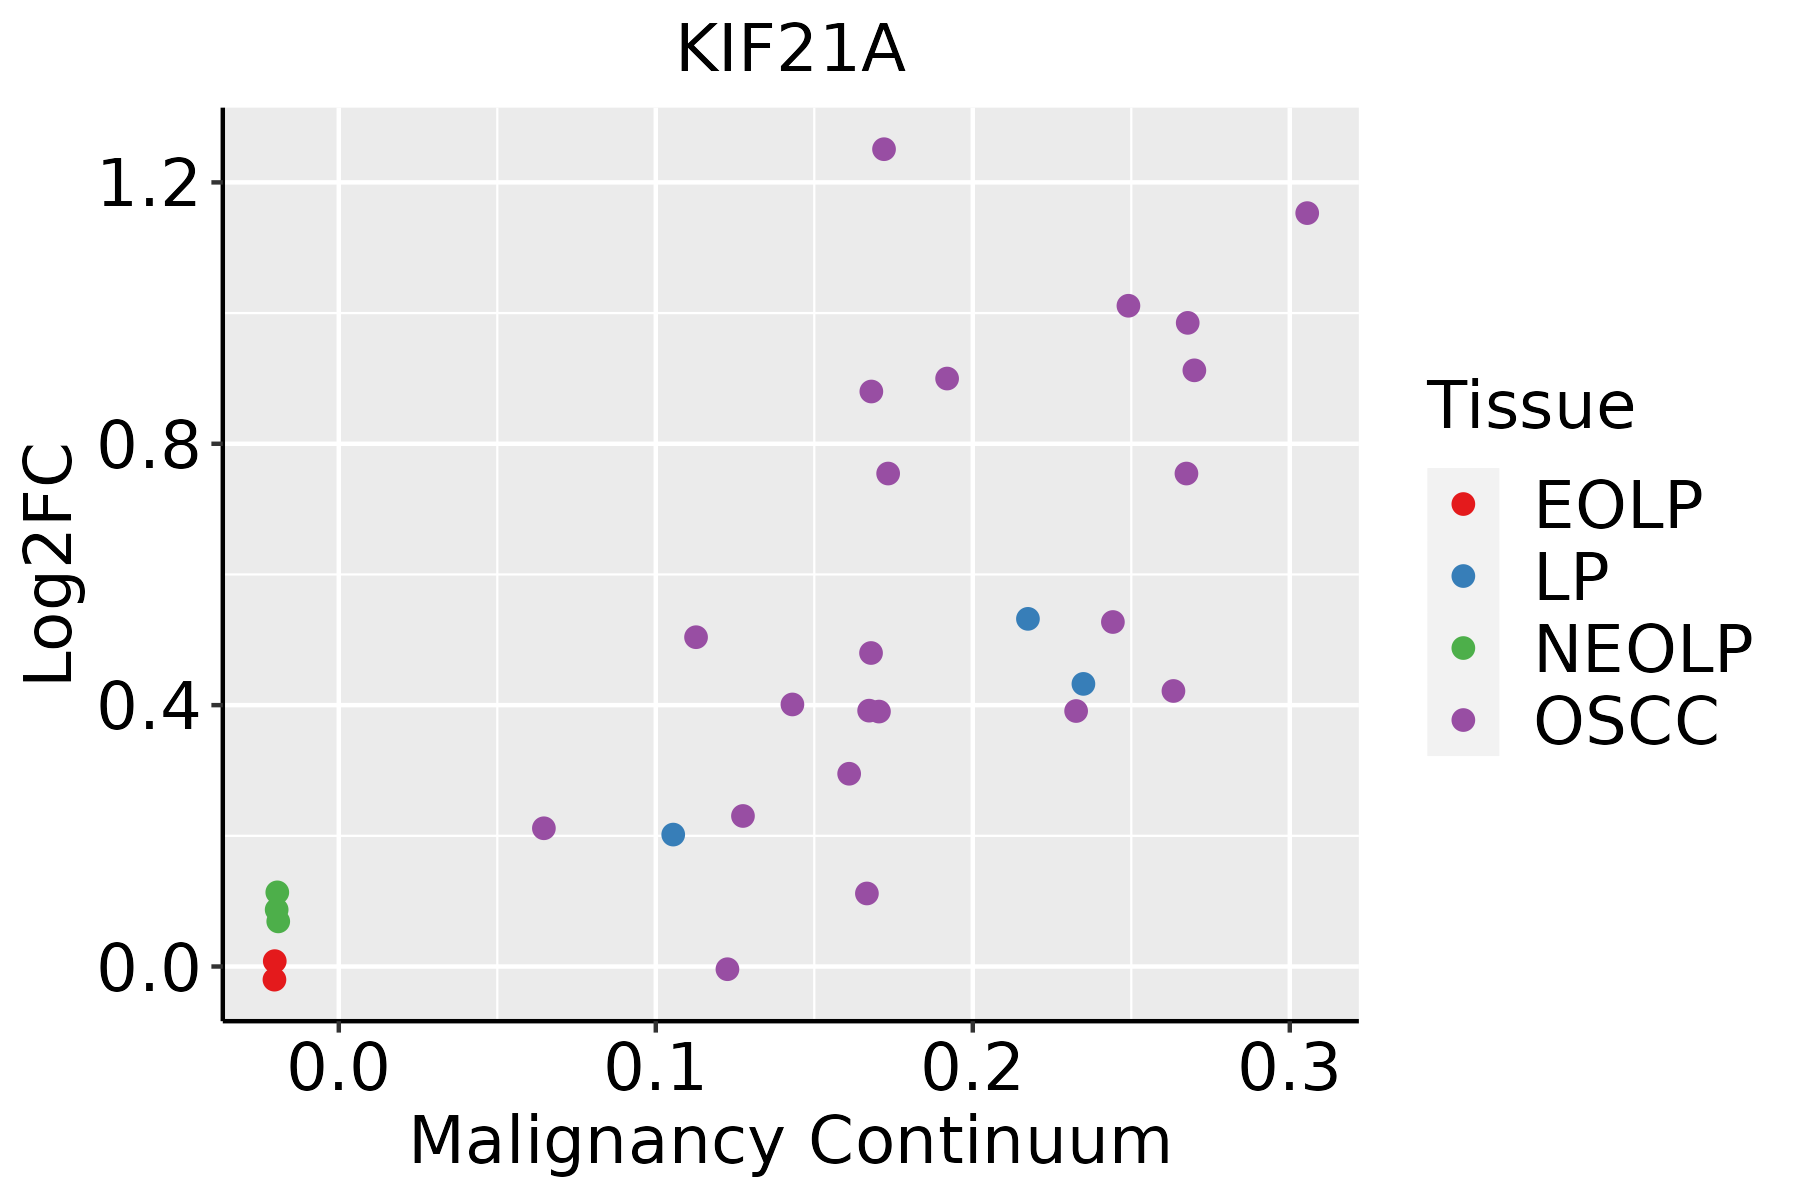 | EOLP: Erosive Oral lichen planus |
| LP: leukoplakia | ||
| NEOLP: Non-erosive oral lichen planus | ||
| OSCC: Oral squamous cell carcinoma | ||
| Thyroid | 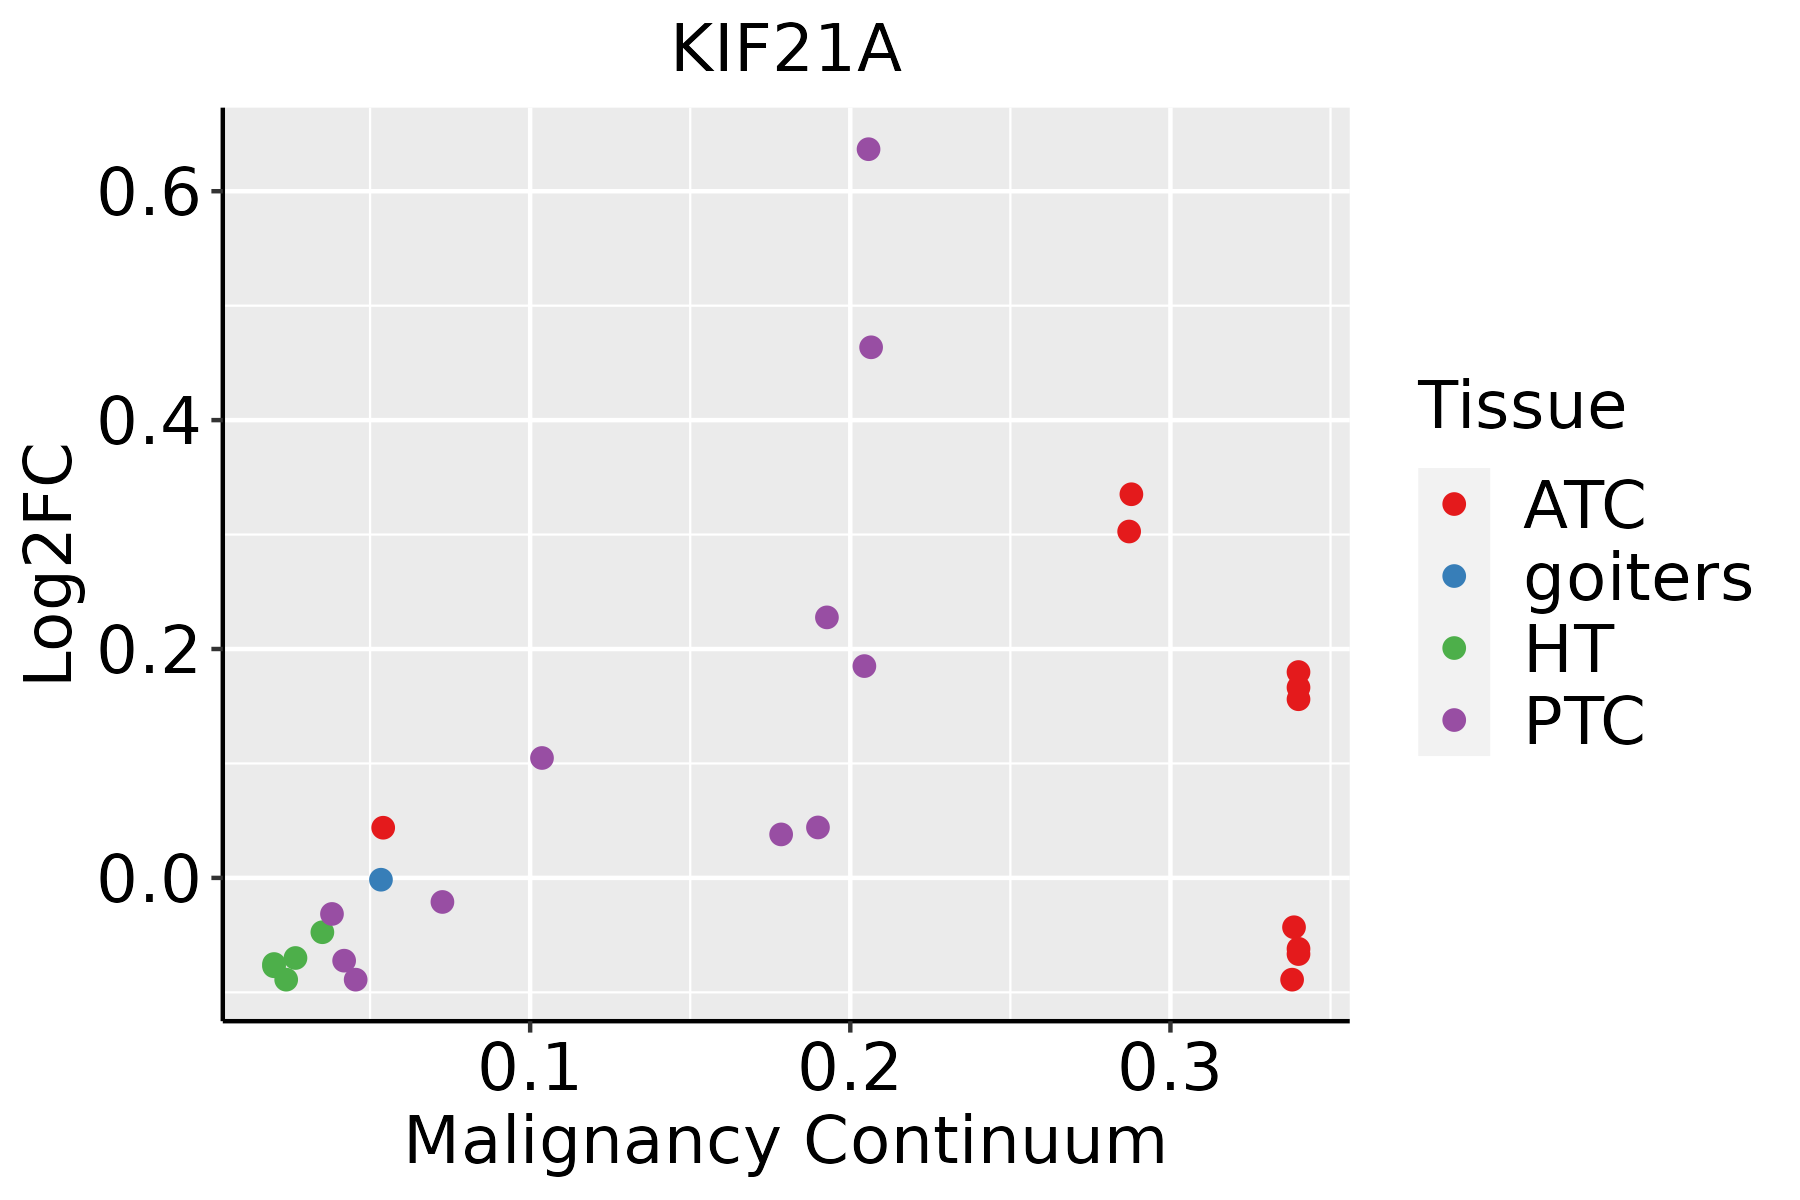 | ATC: Anaplastic thyroid cancer |
| HT: Hashimoto's thyroiditis | ||
| PTC: Papillary thyroid cancer |
| ∗log2FC in expression of this searched gene in stem-like cells from each diseased tissue sample relative to stem-like cells in normal samples in each tissue plotted against the malignancy continuum. Samples are colored based on if they are from different disease stage. |
Top |
Malignant transformation related pathway analysis |
| Find out the enriched GO biological processes and KEGG pathways involved in transition from healthy to precancer to cancer |
| Tissue | Disease Stage | Enriched GO biological Processes |
| Colorectum | AD |  |
| Colorectum | SER |  |
| Colorectum | MSS |  |
| Colorectum | MSI-H |  |
| Colorectum | FAP |  |
| ∗Top 15 enriched GO BP terms are showed in the bar plot of each disease state in each tissue. Each row represents a significant GO biological process which is colored according to the -log10(p.adjust). |
| Page: 1 2 3 4 5 6 7 8 9 |
| GO ID | Tissue | Disease Stage | Description | Gene Ratio | Bg Ratio | pvalue | p.adjust | Count |
| Page: 1 |
| Pathway ID | Tissue | Disease Stage | Description | Gene Ratio | Bg Ratio | pvalue | p.adjust | qvalue | Count |
| hsa048145 | Oral cavity | NEOLP | Motor proteins | 37/1112 | 193/8465 | 1.06e-02 | 3.54e-02 | 2.22e-02 | 37 |
| hsa0481412 | Oral cavity | NEOLP | Motor proteins | 37/1112 | 193/8465 | 1.06e-02 | 3.54e-02 | 2.22e-02 | 37 |
| Page: 1 |
Top |
Cell-cell communication analysis |
| Identification of potential cell-cell interactions between two cell types and their ligand-receptor pairs for different disease states |
| Ligand | Receptor | LRpair | Pathway | Tissue | Disease Stage |
| Page: 1 |
Top |
Single-cell gene regulatory network inference analysis |
| Find out the significant the regulons (TFs) and the target genes of each regulon across cell types for different disease states |
| TF | Cell Type | Tissue | Disease Stage | Target Gene | RSS | Regulon Activity |
| ∗The dot plots of a searched regulon are shown for all cell subpopulations in each disease state of each tissue based on the regulon specific score inferred using pySCENIC and by calculating the average expression. |
| Page: 1 |
Top |
Somatic mutation of malignant transformation related genes |
| Annotation of somatic variants for genes involved in malignant transformation |
| Hugo Symbol | Variant Class | Variant Classification | dbSNP RS | HGVSc | HGVSp | HGVSp Short | SWISSPROT | BIOTYPE | SIFT | PolyPhen | Tumor Sample Barcode | Tissue | Histology | Sex | Age | Stage | Therapy Types | Drugs | Outcome |
| KIF21A | SNV | Missense_Mutation | c.3662T>C | p.Ile1221Thr | p.I1221T | Q7Z4S6 | protein_coding | tolerated(0.39) | benign(0) | TCGA-A1-A0SI-01 | Breast | breast invasive carcinoma | Female | <65 | I/II | Unknown | Unknown | SD | |
| KIF21A | SNV | Missense_Mutation | c.3893N>T | p.Ser1298Leu | p.S1298L | Q7Z4S6 | protein_coding | tolerated(0.27) | benign(0.06) | TCGA-AC-A23H-01 | Breast | breast invasive carcinoma | Female | >=65 | I/II | Unknown | Unknown | PD | |
| KIF21A | SNV | Missense_Mutation | rs139695269 | c.3836G>A | p.Arg1279Gln | p.R1279Q | Q7Z4S6 | protein_coding | tolerated(0.12) | possibly_damaging(0.765) | TCGA-B6-A1KI-01 | Breast | breast invasive carcinoma | Female | <65 | I/II | Unknown | Unknown | SD |
| KIF21A | SNV | Missense_Mutation | c.1181N>T | p.Thr394Ile | p.T394I | Q7Z4S6 | protein_coding | deleterious(0.01) | benign(0.287) | TCGA-BH-A0HF-01 | Breast | breast invasive carcinoma | Female | >=65 | I/II | Hormone Therapy | arimidex | SD | |
| KIF21A | SNV | Missense_Mutation | novel | c.1969N>G | p.Lys657Glu | p.K657E | Q7Z4S6 | protein_coding | deleterious(0.01) | probably_damaging(0.998) | TCGA-BH-A18G-01 | Breast | breast invasive carcinoma | Female | >=65 | I/II | Unknown | Unknown | SD |
| KIF21A | SNV | Missense_Mutation | novel | c.2176C>A | p.Gln726Lys | p.Q726K | Q7Z4S6 | protein_coding | tolerated(0.95) | benign(0) | TCGA-BH-A1F5-01 | Breast | breast invasive carcinoma | Female | <65 | I/II | Unknown | Unknown | SD |
| KIF21A | SNV | Missense_Mutation | novel | c.2176C>A | p.Gln726Lys | p.Q726K | Q7Z4S6 | protein_coding | tolerated(0.95) | benign(0) | TCGA-D8-A1JA-01 | Breast | breast invasive carcinoma | Female | <65 | III/IV | Chemotherapy | adriamycin | PD |
| KIF21A | SNV | Missense_Mutation | novel | c.3802N>C | p.Ala1268Pro | p.A1268P | Q7Z4S6 | protein_coding | tolerated(0.14) | benign(0.003) | TCGA-HN-A2NL-01 | Breast | breast invasive carcinoma | Female | <65 | I/II | Chemotherapy | cyclophosphamide | SD |
| KIF21A | insertion | Frame_Shift_Ins | novel | c.1804-1_1804insA | p.Glu602ArgfsTer8 | p.E602Rfs*8 | Q7Z4S6 | protein_coding | TCGA-AO-A128-01 | Breast | breast invasive carcinoma | Female | <65 | I/II | Chemotherapy | doxorubicin | SD | ||
| KIF21A | insertion | Frame_Shift_Ins | novel | c.387_388insA | p.His130ThrfsTer5 | p.H130Tfs*5 | Q7Z4S6 | protein_coding | TCGA-B6-A0RL-01 | Breast | breast invasive carcinoma | Female | <65 | I/II | Unknown | Unknown | SD |
| Page: 1 2 3 4 5 6 7 8 9 10 11 12 13 14 15 16 17 18 19 20 21 22 23 24 25 |
Top |
Related drugs of malignant transformation related genes |
| Identification of chemicals and drugs interact with genes involved in malignant transfromation |
| (DGIdb 4.0) |
| Entrez ID | Symbol | Category | Interaction Types | Drug Claim Name | Drug Name | PMIDs |
| Page: 1 |

Copyright 2023-Present -The University of Texas Health Science Center at Houston |