
|
|||||
|
 | |
| |
| |
| |
| |
| |
|
Gene: KIF20A |
Gene summary for KIF20A |
| Gene information | Species | Human | Gene symbol | KIF20A | Gene ID | 10112 |
| Gene name | kinesin family member 20A | |
| Gene Alias | MKLP2 | |
| Cytomap | 5q31.2 | |
| Gene Type | protein-coding | GO ID | GO:0000226 | UniProtAcc | O95235 |
Top |
Malignant transformation analysis |
| Identification of the aberrant gene expression in precancerous and cancerous lesions by comparing the gene expression of stem-like cells in diseased tissues with normal stem cells |
| Entrez ID | Symbol | Replicates | Species | Organ | Tissue | Adj P-value | Log2FC | Malignancy |
| 10112 | KIF20A | P2T-E | Human | Esophagus | ESCC | 9.20e-06 | 3.46e-01 | 0.1177 |
| 10112 | KIF20A | P4T-E | Human | Esophagus | ESCC | 6.27e-06 | 2.54e-01 | 0.1323 |
| 10112 | KIF20A | P5T-E | Human | Esophagus | ESCC | 4.44e-08 | 2.40e-01 | 0.1327 |
| 10112 | KIF20A | P9T-E | Human | Esophagus | ESCC | 5.23e-05 | 2.66e-01 | 0.1131 |
| 10112 | KIF20A | P10T-E | Human | Esophagus | ESCC | 4.17e-05 | 1.68e-01 | 0.116 |
| 10112 | KIF20A | P15T-E | Human | Esophagus | ESCC | 3.26e-02 | 1.40e-01 | 0.1149 |
| 10112 | KIF20A | P17T-E | Human | Esophagus | ESCC | 1.49e-02 | 5.85e-01 | 0.1278 |
| 10112 | KIF20A | P19T-E | Human | Esophagus | ESCC | 5.57e-05 | 5.45e-01 | 0.1662 |
| 10112 | KIF20A | P20T-E | Human | Esophagus | ESCC | 2.32e-06 | 4.48e-01 | 0.1124 |
| 10112 | KIF20A | P21T-E | Human | Esophagus | ESCC | 4.31e-06 | 3.06e-01 | 0.1617 |
| 10112 | KIF20A | P24T-E | Human | Esophagus | ESCC | 9.56e-08 | 2.91e-01 | 0.1287 |
| 10112 | KIF20A | P26T-E | Human | Esophagus | ESCC | 3.50e-02 | 1.42e-01 | 0.1276 |
| 10112 | KIF20A | P28T-E | Human | Esophagus | ESCC | 7.90e-03 | 1.28e-01 | 0.1149 |
| 10112 | KIF20A | P31T-E | Human | Esophagus | ESCC | 4.31e-06 | 2.25e-01 | 0.1251 |
| 10112 | KIF20A | P32T-E | Human | Esophagus | ESCC | 1.13e-16 | 5.95e-01 | 0.1666 |
| 10112 | KIF20A | P37T-E | Human | Esophagus | ESCC | 9.96e-06 | 2.04e-01 | 0.1371 |
| 10112 | KIF20A | P48T-E | Human | Esophagus | ESCC | 1.78e-03 | 1.18e-01 | 0.0959 |
| 10112 | KIF20A | P52T-E | Human | Esophagus | ESCC | 9.56e-08 | 2.70e-01 | 0.1555 |
| 10112 | KIF20A | P62T-E | Human | Esophagus | ESCC | 1.21e-03 | 1.91e-01 | 0.1302 |
| 10112 | KIF20A | P74T-E | Human | Esophagus | ESCC | 2.03e-13 | 9.66e-01 | 0.1479 |
| Page: 1 2 |
| Tissue | Expression Dynamics | Abbreviation |
| Esophagus | 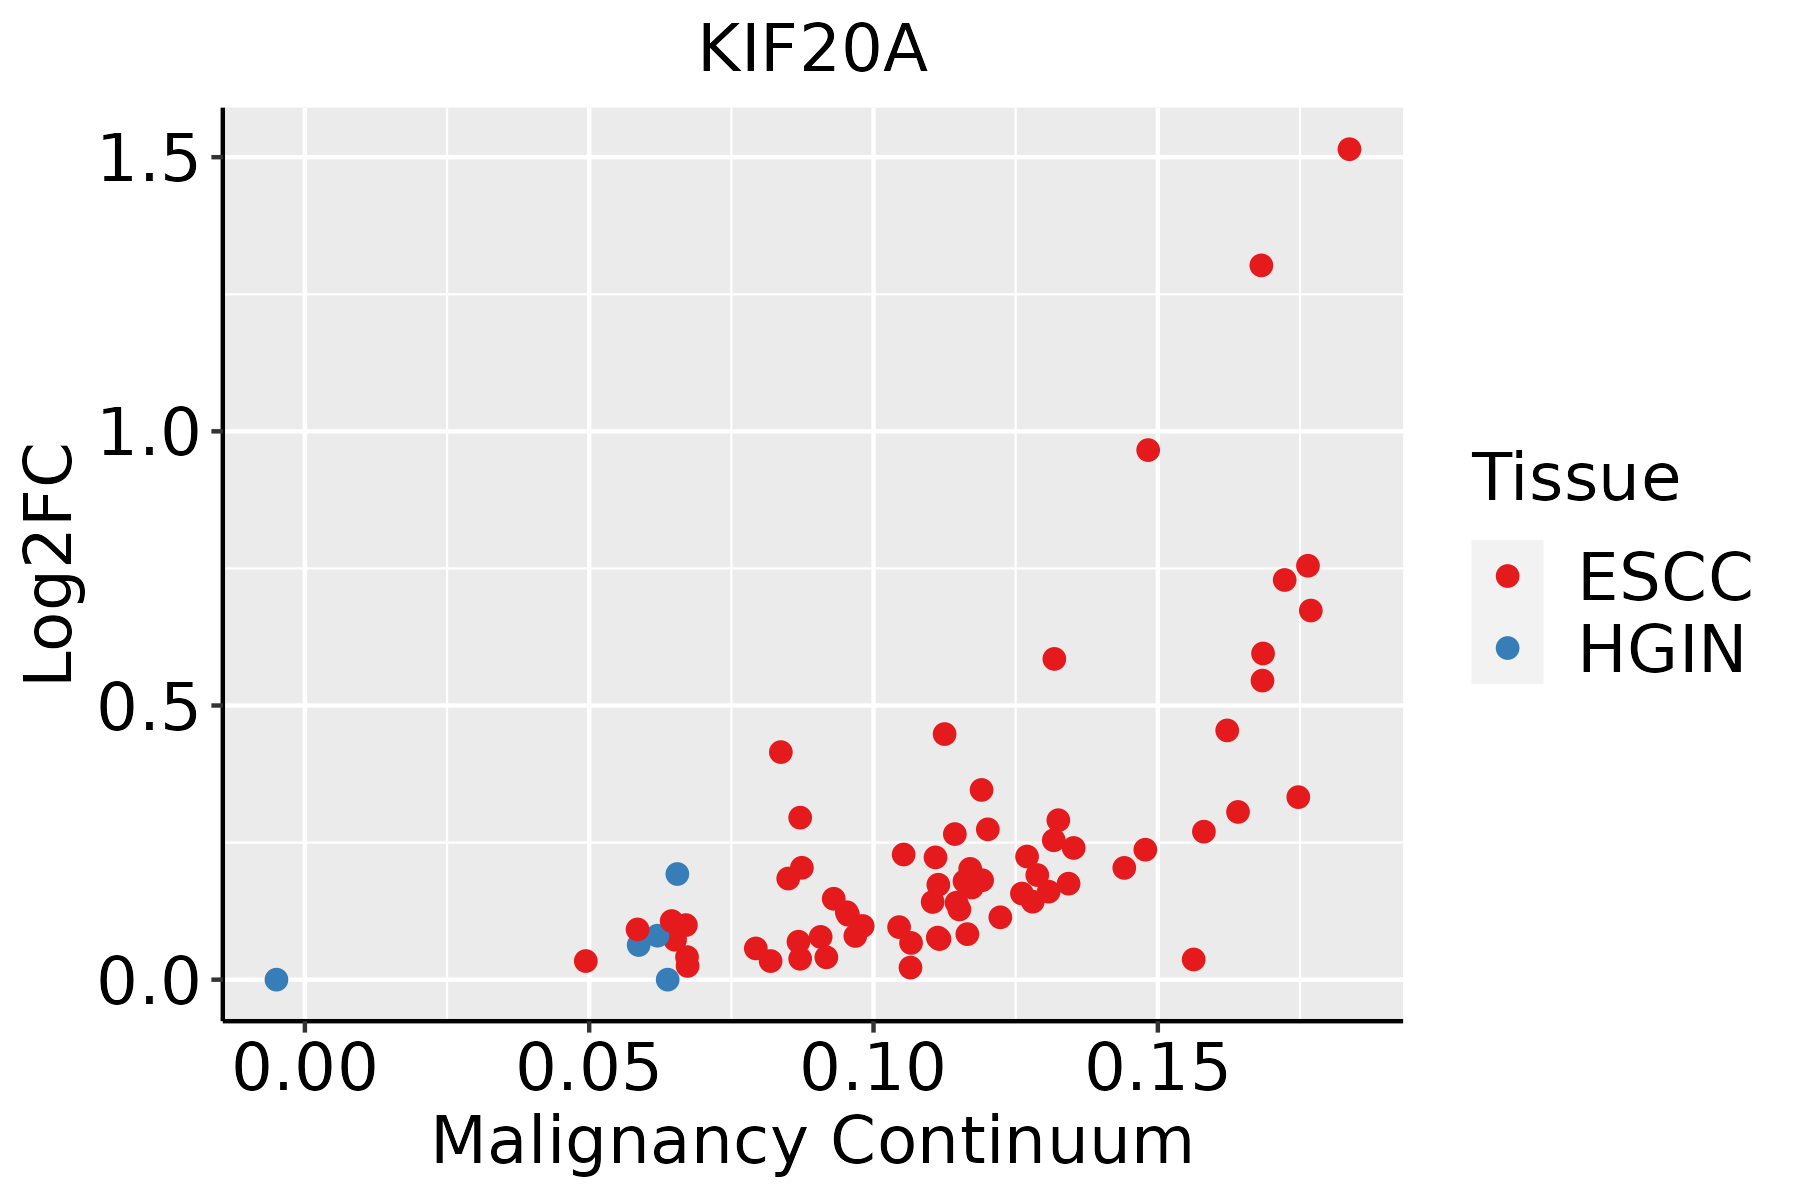 | ESCC: Esophageal squamous cell carcinoma |
| HGIN: High-grade intraepithelial neoplasias | ||
| LGIN: Low-grade intraepithelial neoplasias | ||
| Skin | 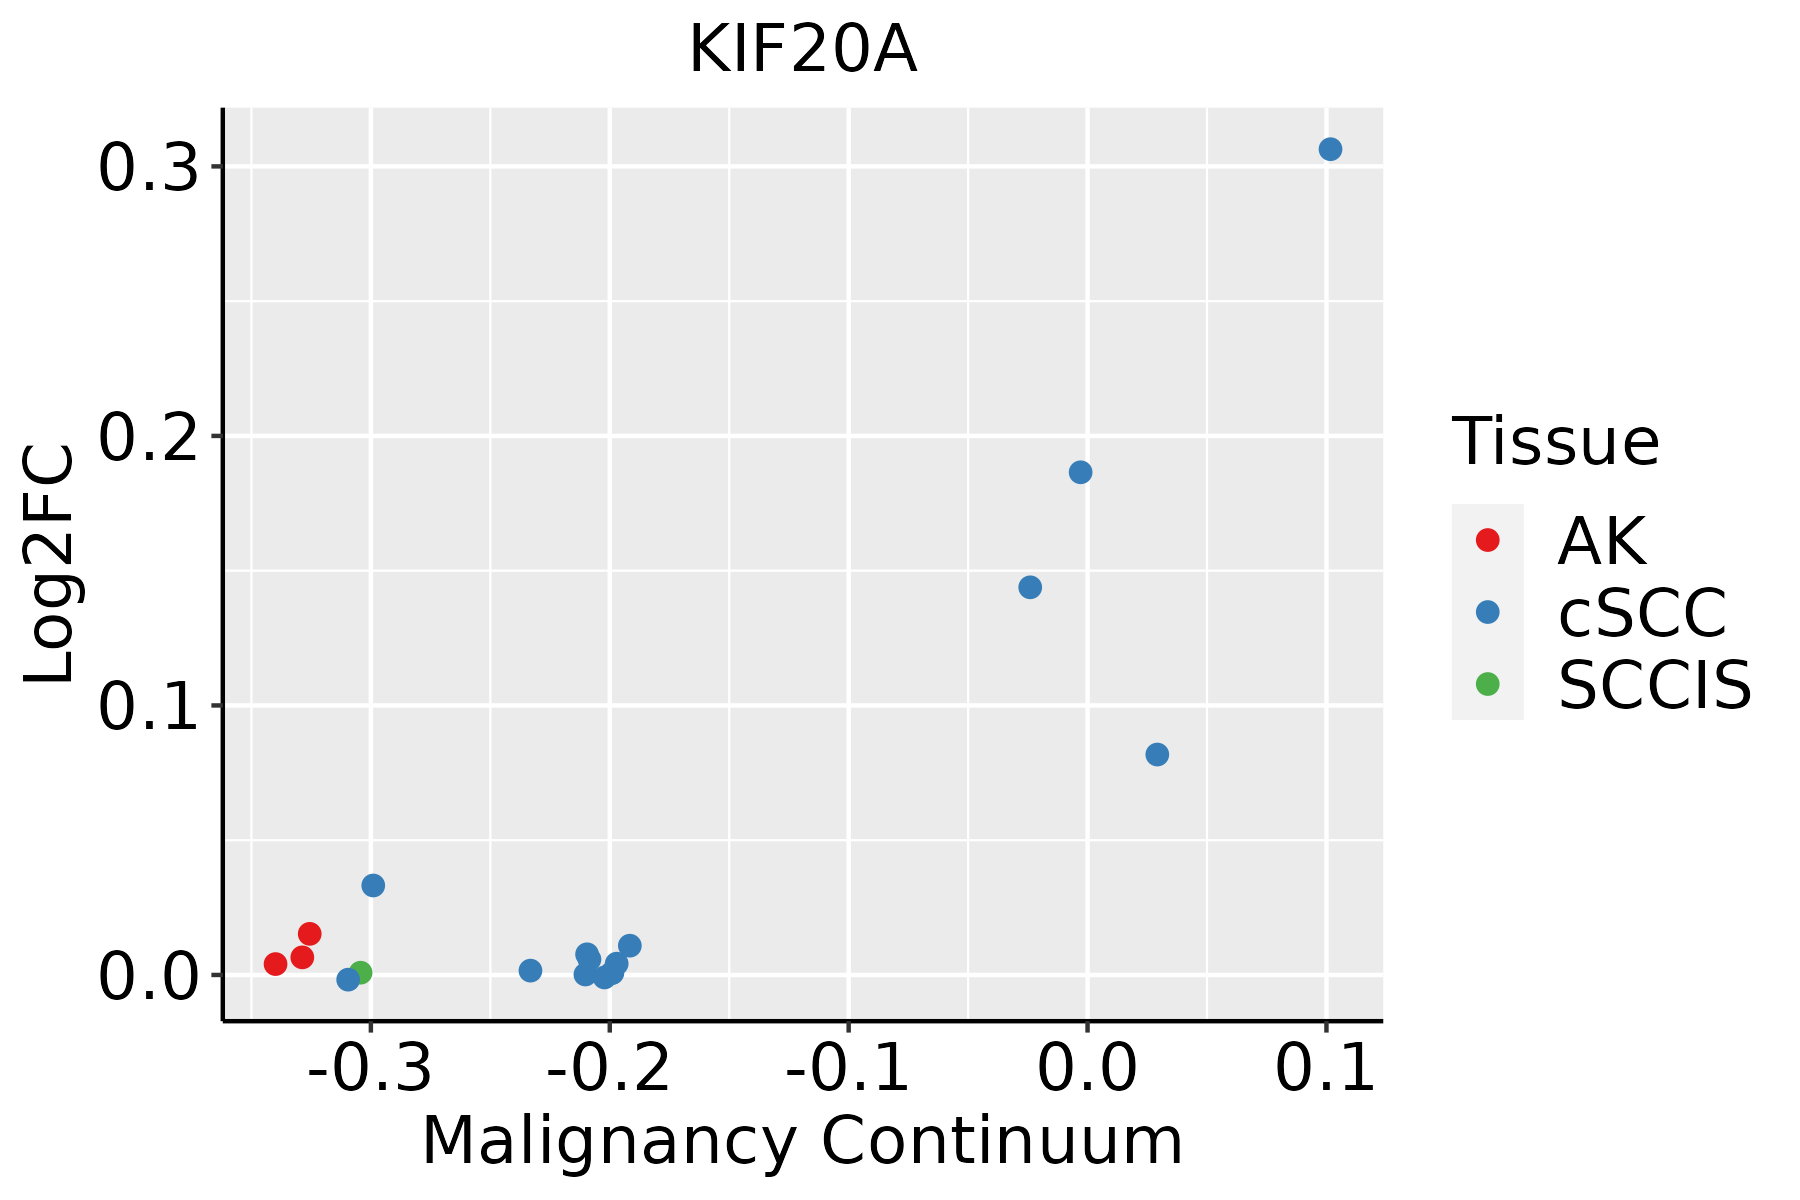 | AK: Actinic keratosis |
| cSCC: Cutaneous squamous cell carcinoma | ||
| SCCIS:squamous cell carcinoma in situ | ||
| Thyroid | 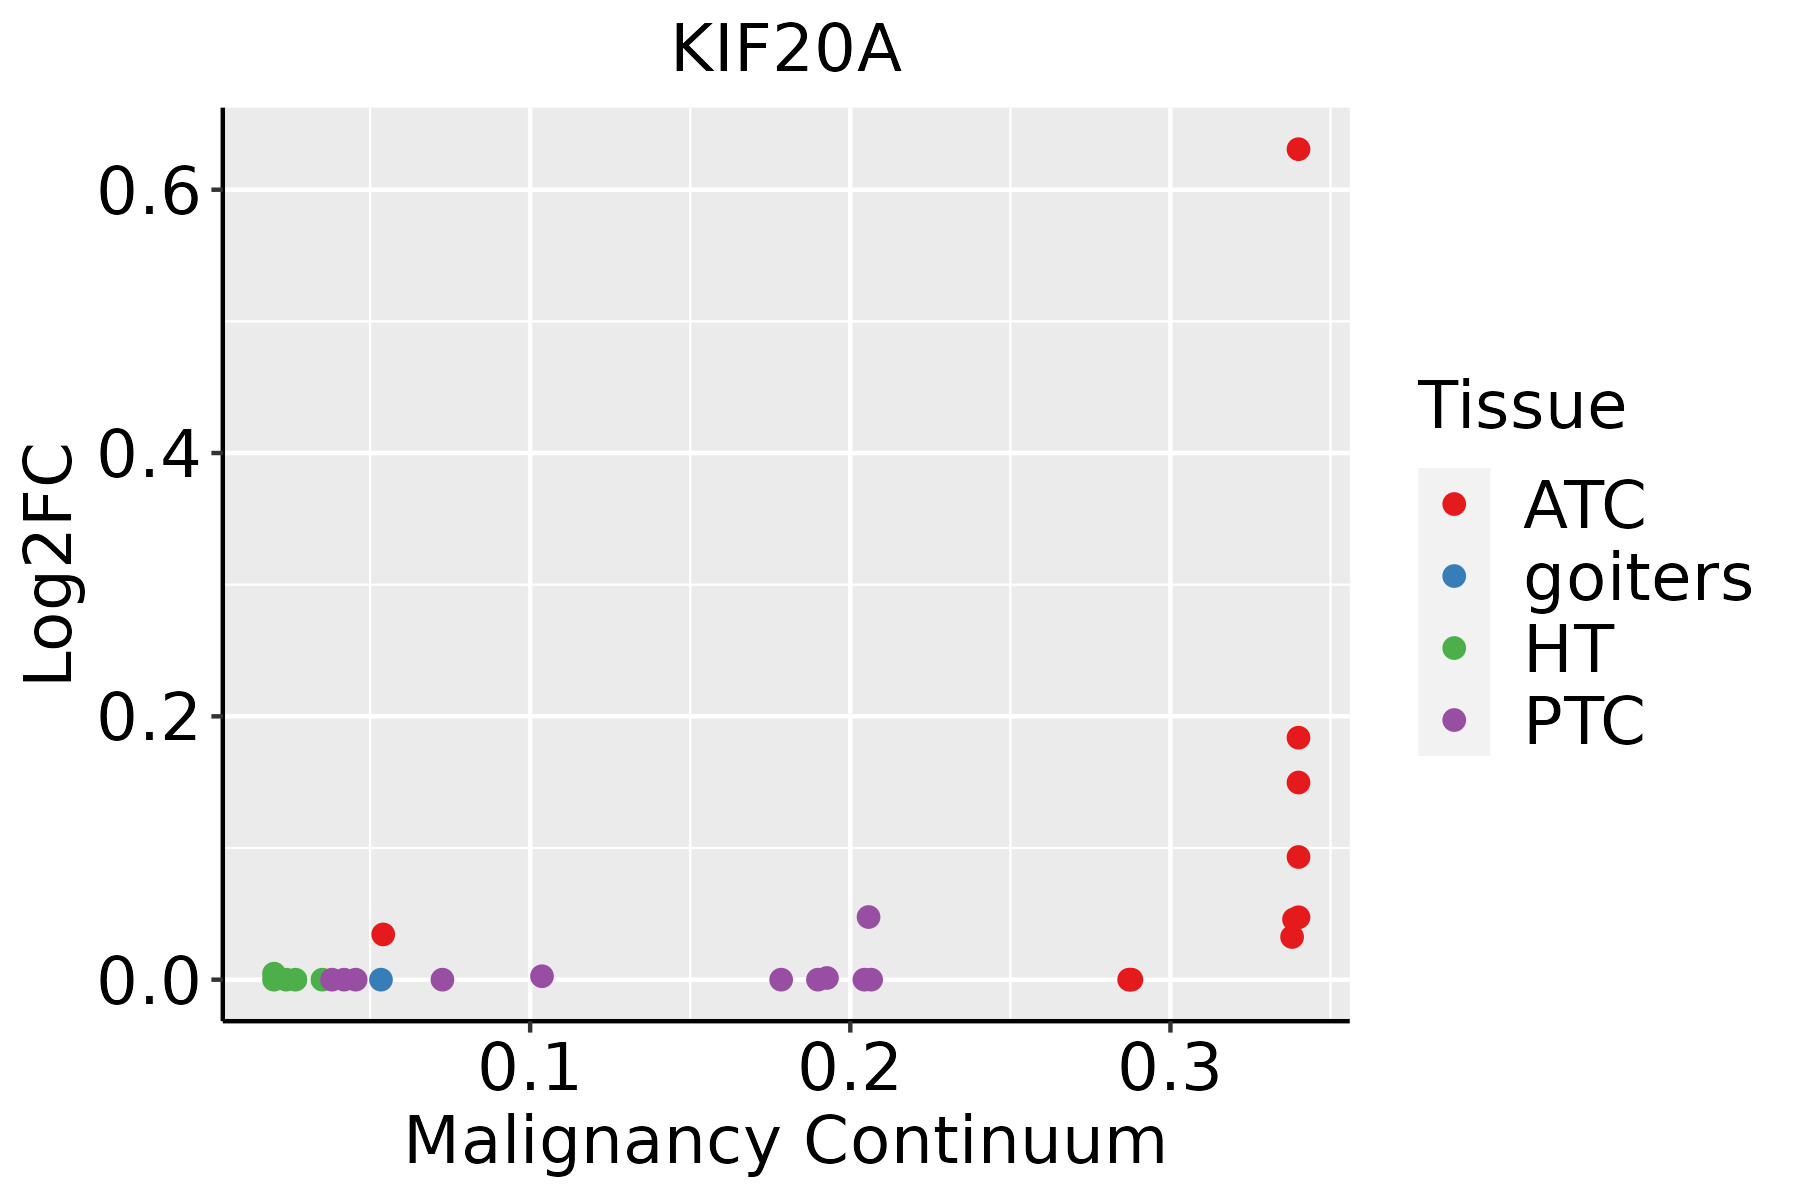 | ATC: Anaplastic thyroid cancer |
| HT: Hashimoto's thyroiditis | ||
| PTC: Papillary thyroid cancer |
| ∗log2FC in expression of this searched gene in stem-like cells from each diseased tissue sample relative to stem-like cells in normal samples in each tissue plotted against the malignancy continuum. Samples are colored based on if they are from different disease stage. |
Top |
Malignant transformation related pathway analysis |
| Find out the enriched GO biological processes and KEGG pathways involved in transition from healthy to precancer to cancer |
| Tissue | Disease Stage | Enriched GO biological Processes |
| Colorectum | AD |  |
| Colorectum | SER |  |
| Colorectum | MSS |  |
| Colorectum | MSI-H |  |
| Colorectum | FAP |  |
| ∗Top 15 enriched GO BP terms are showed in the bar plot of each disease state in each tissue. Each row represents a significant GO biological process which is colored according to the -log10(p.adjust). |
| Page: 1 2 3 4 5 6 7 8 9 |
| GO ID | Tissue | Disease Stage | Description | Gene Ratio | Bg Ratio | pvalue | p.adjust | Count |
| GO:000028115 | Esophagus | ESCC | mitotic cytokinesis | 58/8552 | 71/18723 | 4.34e-10 | 1.15e-08 | 58 |
| GO:003250614 | Esophagus | ESCC | cytokinetic process | 35/8552 | 39/18723 | 9.38e-09 | 1.90e-07 | 35 |
| GO:000091016 | Esophagus | ESCC | cytokinesis | 115/8552 | 173/18723 | 2.48e-08 | 4.68e-07 | 115 |
| GO:006164015 | Esophagus | ESCC | cytoskeleton-dependent cytokinesis | 72/8552 | 100/18723 | 8.10e-08 | 1.39e-06 | 72 |
| GO:190241014 | Esophagus | ESCC | mitotic cytokinetic process | 22/8552 | 23/18723 | 4.17e-07 | 5.71e-06 | 22 |
| GO:006195214 | Esophagus | ESCC | midbody abscission | 17/8552 | 17/18723 | 1.63e-06 | 1.95e-05 | 17 |
| GO:00324653 | Esophagus | ESCC | regulation of cytokinesis | 57/8552 | 92/18723 | 1.20e-03 | 5.88e-03 | 57 |
| GO:00513025 | Esophagus | ESCC | regulation of cell division | 97/8552 | 177/18723 | 8.93e-03 | 3.12e-02 | 97 |
| GO:000028116 | Skin | cSCC | mitotic cytokinesis | 47/4864 | 71/18723 | 1.29e-12 | 7.21e-11 | 47 |
| GO:006164016 | Skin | cSCC | cytoskeleton-dependent cytokinesis | 57/4864 | 100/18723 | 4.65e-11 | 2.21e-09 | 57 |
| GO:000091021 | Skin | cSCC | cytokinesis | 84/4864 | 173/18723 | 1.36e-10 | 6.04e-09 | 84 |
| GO:00325067 | Skin | cSCC | cytokinetic process | 27/4864 | 39/18723 | 1.87e-08 | 5.53e-07 | 27 |
| GO:19024109 | Skin | cSCC | mitotic cytokinetic process | 19/4864 | 23/18723 | 2.11e-08 | 6.08e-07 | 19 |
| GO:00619526 | Skin | cSCC | midbody abscission | 15/4864 | 17/18723 | 1.27e-07 | 2.93e-06 | 15 |
| GO:00324654 | Skin | cSCC | regulation of cytokinesis | 37/4864 | 92/18723 | 1.94e-03 | 1.17e-02 | 37 |
| GO:00513026 | Skin | cSCC | regulation of cell division | 61/4864 | 177/18723 | 7.34e-03 | 3.47e-02 | 61 |
| GO:000028117 | Thyroid | ATC | mitotic cytokinesis | 50/6293 | 71/18723 | 2.46e-10 | 7.10e-09 | 50 |
| GO:0000910110 | Thyroid | ATC | cytokinesis | 93/6293 | 173/18723 | 3.59e-08 | 6.67e-07 | 93 |
| GO:003250615 | Thyroid | ATC | cytokinetic process | 28/6293 | 39/18723 | 1.22e-06 | 1.57e-05 | 28 |
| GO:006164017 | Thyroid | ATC | cytoskeleton-dependent cytokinesis | 57/6293 | 100/18723 | 1.29e-06 | 1.65e-05 | 57 |
| Page: 1 2 |
| Pathway ID | Tissue | Disease Stage | Description | Gene Ratio | Bg Ratio | pvalue | p.adjust | qvalue | Count |
| Page: 1 |
Top |
Cell-cell communication analysis |
| Identification of potential cell-cell interactions between two cell types and their ligand-receptor pairs for different disease states |
| Ligand | Receptor | LRpair | Pathway | Tissue | Disease Stage |
| Page: 1 |
Top |
Single-cell gene regulatory network inference analysis |
| Find out the significant the regulons (TFs) and the target genes of each regulon across cell types for different disease states |
| TF | Cell Type | Tissue | Disease Stage | Target Gene | RSS | Regulon Activity |
| ∗The dot plots of a searched regulon are shown for all cell subpopulations in each disease state of each tissue based on the regulon specific score inferred using pySCENIC and by calculating the average expression. |
| Page: 1 |
Top |
Somatic mutation of malignant transformation related genes |
| Annotation of somatic variants for genes involved in malignant transformation |
| Hugo Symbol | Variant Class | Variant Classification | dbSNP RS | HGVSc | HGVSp | HGVSp Short | SWISSPROT | BIOTYPE | SIFT | PolyPhen | Tumor Sample Barcode | Tissue | Histology | Sex | Age | Stage | Therapy Types | Drugs | Outcome |
| KIF20A | SNV | Missense_Mutation | c.2277G>C | p.Glu759Asp | p.E759D | O95235 | protein_coding | deleterious(0.04) | benign(0.029) | TCGA-A2-A0EQ-01 | Breast | breast invasive carcinoma | Female | <65 | I/II | Chemotherapy | adriamycin | SD | |
| KIF20A | SNV | Missense_Mutation | novel | c.1082T>G | p.Val361Gly | p.V361G | O95235 | protein_coding | deleterious(0) | possibly_damaging(0.697) | TCGA-A2-A0T2-01 | Breast | breast invasive carcinoma | Female | >=65 | III/IV | Chemotherapy | xeloda | PD |
| KIF20A | SNV | Missense_Mutation | c.1976N>C | p.Arg659Thr | p.R659T | O95235 | protein_coding | tolerated(0.08) | benign(0) | TCGA-AC-A23H-01 | Breast | breast invasive carcinoma | Female | >=65 | I/II | Unknown | Unknown | PD | |
| KIF20A | SNV | Missense_Mutation | c.1639N>A | p.Asp547Asn | p.D547N | O95235 | protein_coding | deleterious(0.04) | benign(0) | TCGA-BH-A0HF-01 | Breast | breast invasive carcinoma | Female | >=65 | I/II | Hormone Therapy | arimidex | SD | |
| KIF20A | insertion | Frame_Shift_Ins | novel | c.1056_1057insTCTTCTCCAGAAACAAGTCATCGATGGGCACA | p.Glu353SerfsTer18 | p.E353Sfs*18 | O95235 | protein_coding | TCGA-A8-A08H-01 | Breast | breast invasive carcinoma | Female | >=65 | I/II | Unknown | Unknown | SD | ||
| KIF20A | insertion | Frame_Shift_Ins | novel | c.111_112insGTTAATTTTATAGTATGTGAATTATATCTCAATAAAGCTGTTT | p.Asn38ValfsTer15 | p.N38Vfs*15 | O95235 | protein_coding | TCGA-A8-A09X-01 | Breast | breast invasive carcinoma | Female | <65 | III/IV | Unknown | Unknown | SD | ||
| KIF20A | insertion | Frame_Shift_Ins | novel | c.714_715insTTTGCCCATTTGCTCAGAGGTA | p.Thr239PhefsTer43 | p.T239Ffs*43 | O95235 | protein_coding | TCGA-B6-A0IK-01 | Breast | breast invasive carcinoma | Female | <65 | III/IV | Unknown | Unknown | PD | ||
| KIF20A | deletion | Frame_Shift_Del | c.2314delN | p.Arg772ValfsTer4 | p.R772Vfs*4 | O95235 | protein_coding | TCGA-D8-A27V-01 | Breast | breast invasive carcinoma | Female | <65 | I/II | Hormone Therapy | tamoxiphen | SD | |||
| KIF20A | SNV | Missense_Mutation | c.1606N>C | p.Glu536Gln | p.E536Q | O95235 | protein_coding | tolerated(0.52) | benign(0.022) | TCGA-IR-A3LK-01 | Cervix | cervical & endocervical cancer | Female | >=65 | I/II | Chemotherapy | cisplatin | PD | |
| KIF20A | SNV | Missense_Mutation | novel | c.1936N>A | p.Glu646Lys | p.E646K | O95235 | protein_coding | tolerated(0.12) | benign(0.091) | TCGA-MA-AA41-01 | Cervix | cervical & endocervical cancer | Female | <65 | I/II | Unknown | Unknown | SD |
| Page: 1 2 3 4 5 6 7 |
Top |
Related drugs of malignant transformation related genes |
| Identification of chemicals and drugs interact with genes involved in malignant transfromation |
| (DGIdb 4.0) |
| Entrez ID | Symbol | Category | Interaction Types | Drug Claim Name | Drug Name | PMIDs |
| Page: 1 |

Copyright 2023-Present -The University of Texas Health Science Center at Houston |