
|
|||||
|
 | |
| |
| |
| |
| |
| |
|
Gene: KIF1BP |
Gene summary for KIF1BP |
| Gene information | Species | Human | Gene symbol | KIF1BP | Gene ID | 26128 |
| Gene name | kinesin family binding protein | |
| Gene Alias | KBP | |
| Cytomap | 10q22.1 | |
| Gene Type | protein-coding | GO ID | GO:0001701 | UniProtAcc | Q96EK5 |
Top |
Malignant transformation analysis |
| Identification of the aberrant gene expression in precancerous and cancerous lesions by comparing the gene expression of stem-like cells in diseased tissues with normal stem cells |
| Entrez ID | Symbol | Replicates | Species | Organ | Tissue | Adj P-value | Log2FC | Malignancy |
| 26128 | KIF1BP | LZE4T | Human | Esophagus | ESCC | 4.64e-11 | 2.54e-01 | 0.0811 |
| 26128 | KIF1BP | LZE24T | Human | Esophagus | ESCC | 5.96e-11 | 2.28e-01 | 0.0596 |
| 26128 | KIF1BP | P2T-E | Human | Esophagus | ESCC | 1.59e-19 | 2.67e-01 | 0.1177 |
| 26128 | KIF1BP | P4T-E | Human | Esophagus | ESCC | 8.51e-19 | 3.52e-01 | 0.1323 |
| 26128 | KIF1BP | P5T-E | Human | Esophagus | ESCC | 3.13e-08 | 1.89e-01 | 0.1327 |
| 26128 | KIF1BP | P8T-E | Human | Esophagus | ESCC | 1.22e-10 | 1.73e-01 | 0.0889 |
| 26128 | KIF1BP | P9T-E | Human | Esophagus | ESCC | 6.92e-11 | 9.90e-02 | 0.1131 |
| 26128 | KIF1BP | P10T-E | Human | Esophagus | ESCC | 8.06e-12 | 7.60e-02 | 0.116 |
| 26128 | KIF1BP | P11T-E | Human | Esophagus | ESCC | 2.85e-09 | 3.26e-01 | 0.1426 |
| 26128 | KIF1BP | P12T-E | Human | Esophagus | ESCC | 4.77e-18 | 3.33e-01 | 0.1122 |
| 26128 | KIF1BP | P15T-E | Human | Esophagus | ESCC | 9.58e-17 | 2.26e-01 | 0.1149 |
| 26128 | KIF1BP | P16T-E | Human | Esophagus | ESCC | 8.13e-16 | 2.09e-01 | 0.1153 |
| 26128 | KIF1BP | P17T-E | Human | Esophagus | ESCC | 4.24e-04 | 1.27e-01 | 0.1278 |
| 26128 | KIF1BP | P20T-E | Human | Esophagus | ESCC | 2.06e-08 | 8.93e-02 | 0.1124 |
| 26128 | KIF1BP | P21T-E | Human | Esophagus | ESCC | 5.58e-14 | 2.31e-01 | 0.1617 |
| 26128 | KIF1BP | P22T-E | Human | Esophagus | ESCC | 7.03e-10 | 1.93e-01 | 0.1236 |
| 26128 | KIF1BP | P23T-E | Human | Esophagus | ESCC | 2.18e-15 | 2.40e-01 | 0.108 |
| 26128 | KIF1BP | P24T-E | Human | Esophagus | ESCC | 4.38e-19 | 3.53e-01 | 0.1287 |
| 26128 | KIF1BP | P26T-E | Human | Esophagus | ESCC | 1.32e-17 | 3.01e-01 | 0.1276 |
| 26128 | KIF1BP | P27T-E | Human | Esophagus | ESCC | 1.81e-14 | 2.72e-01 | 0.1055 |
| Page: 1 2 3 4 |
| Tissue | Expression Dynamics | Abbreviation |
| Esophagus | 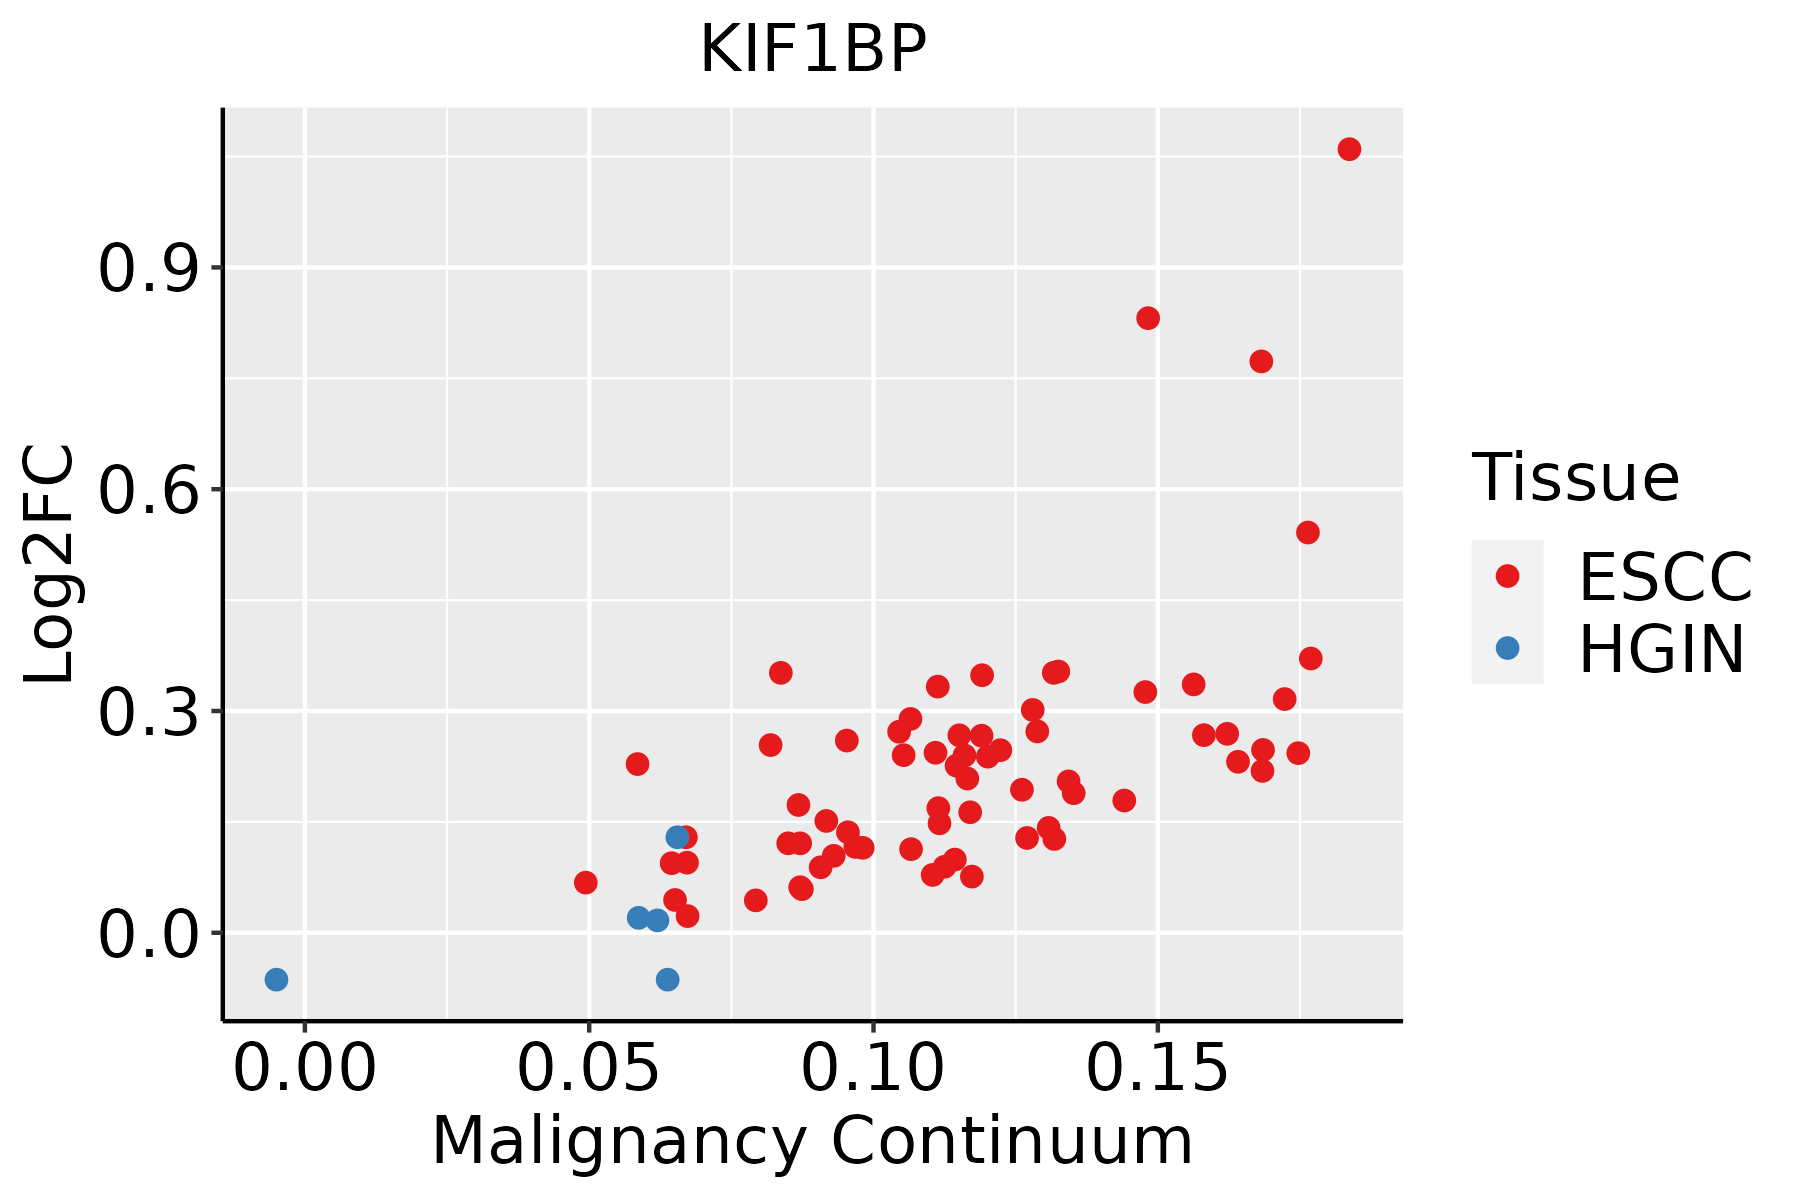 | ESCC: Esophageal squamous cell carcinoma |
| HGIN: High-grade intraepithelial neoplasias | ||
| LGIN: Low-grade intraepithelial neoplasias | ||
| Thyroid |  | ATC: Anaplastic thyroid cancer |
| HT: Hashimoto's thyroiditis | ||
| PTC: Papillary thyroid cancer |
| ∗log2FC in expression of this searched gene in stem-like cells from each diseased tissue sample relative to stem-like cells in normal samples in each tissue plotted against the malignancy continuum. Samples are colored based on if they are from different disease stage. |
Top |
Malignant transformation related pathway analysis |
| Find out the enriched GO biological processes and KEGG pathways involved in transition from healthy to precancer to cancer |
| Tissue | Disease Stage | Enriched GO biological Processes |
| Colorectum | AD |  |
| Colorectum | SER |  |
| Colorectum | MSS |  |
| Colorectum | MSI-H |  |
| Colorectum | FAP |  |
| ∗Top 15 enriched GO BP terms are showed in the bar plot of each disease state in each tissue. Each row represents a significant GO biological process which is colored according to the -log10(p.adjust). |
| Page: 1 2 3 4 5 6 7 8 9 |
| GO ID | Tissue | Disease Stage | Description | Gene Ratio | Bg Ratio | pvalue | p.adjust | Count |
| Page: 1 |
| Pathway ID | Tissue | Disease Stage | Description | Gene Ratio | Bg Ratio | pvalue | p.adjust | qvalue | Count |
| Page: 1 |
Top |
Cell-cell communication analysis |
| Identification of potential cell-cell interactions between two cell types and their ligand-receptor pairs for different disease states |
| Ligand | Receptor | LRpair | Pathway | Tissue | Disease Stage |
| Page: 1 |
Top |
Single-cell gene regulatory network inference analysis |
| Find out the significant the regulons (TFs) and the target genes of each regulon across cell types for different disease states |
| TF | Cell Type | Tissue | Disease Stage | Target Gene | RSS | Regulon Activity |
| ∗The dot plots of a searched regulon are shown for all cell subpopulations in each disease state of each tissue based on the regulon specific score inferred using pySCENIC and by calculating the average expression. |
| Page: 1 |
Top |
Somatic mutation of malignant transformation related genes |
| Annotation of somatic variants for genes involved in malignant transformation |
| Hugo Symbol | Variant Class | Variant Classification | dbSNP RS | HGVSc | HGVSp | HGVSp Short | SWISSPROT | BIOTYPE | SIFT | PolyPhen | Tumor Sample Barcode | Tissue | Histology | Sex | Age | Stage | Therapy Types | Drugs | Outcome |
| KIF1BP | SNV | Missense_Mutation | c.1786N>C | p.Glu596Gln | p.E596Q | Q96EK5 | protein_coding | deleterious(0) | probably_damaging(1) | TCGA-A8-A06Q-01 | Breast | breast invasive carcinoma | Female | <65 | III/IV | Unknown | Unknown | SD | |
| KIF1BP | SNV | Missense_Mutation | novel | c.1689N>T | p.Lys563Asn | p.K563N | Q96EK5 | protein_coding | tolerated(0.34) | benign(0.01) | TCGA-AN-A046-01 | Breast | breast invasive carcinoma | Female | >=65 | I/II | Unknown | Unknown | SD |
| KIF1BP | SNV | Missense_Mutation | c.566C>T | p.Pro189Leu | p.P189L | Q96EK5 | protein_coding | tolerated(0.1) | benign(0.163) | TCGA-AO-A128-01 | Breast | breast invasive carcinoma | Female | <65 | I/II | Chemotherapy | doxorubicin | SD | |
| KIF1BP | SNV | Missense_Mutation | rs757109189 | c.526N>T | p.Val176Phe | p.V176F | Q96EK5 | protein_coding | tolerated(0.08) | benign(0.033) | TCGA-AR-A0TR-01 | Breast | breast invasive carcinoma | Female | >=65 | I/II | Hormone Therapy | tamoxiphen | SD |
| KIF1BP | SNV | Missense_Mutation | rs374074903 | c.1621N>T | p.Arg541Cys | p.R541C | Q96EK5 | protein_coding | deleterious(0) | probably_damaging(0.999) | TCGA-D8-A27W-01 | Breast | breast invasive carcinoma | Female | <65 | III/IV | Chemotherapy | doxorubicine+cyclophosphamide | SD |
| KIF1BP | insertion | Frame_Shift_Ins | novel | c.298_299insGT | p.His100ArgfsTer5 | p.H100Rfs*5 | Q96EK5 | protein_coding | TCGA-A8-A091-01 | Breast | breast invasive carcinoma | Female | <65 | I/II | Chemotherapy | 5-fluorouracil | PD | ||
| KIF1BP | insertion | Nonsense_Mutation | novel | c.299_300insCACAGCTGGTGCTTAATAGTTAAAATCTTCTATCACC | p.Leu101ThrfsTer5 | p.L101Tfs*5 | Q96EK5 | protein_coding | TCGA-A8-A091-01 | Breast | breast invasive carcinoma | Female | <65 | I/II | Chemotherapy | 5-fluorouracil | PD | ||
| KIF1BP | deletion | Frame_Shift_Del | novel | c.1754delA | p.Lys585SerfsTer9 | p.K585Sfs*9 | Q96EK5 | protein_coding | TCGA-EW-A2FV-01 | Breast | breast invasive carcinoma | Female | <65 | III/IV | Chemotherapy | docetaxel | SD | ||
| KIF1BP | SNV | Missense_Mutation | novel | c.1768N>C | p.Ala590Pro | p.A590P | Q96EK5 | protein_coding | tolerated(0.21) | benign(0.055) | TCGA-DS-A1OD-01 | Cervix | cervical & endocervical cancer | Female | <65 | I/II | Chemotherapy | cisplatin | SD |
| KIF1BP | SNV | Missense_Mutation | c.1213N>C | p.Glu405Gln | p.E405Q | Q96EK5 | protein_coding | tolerated(0.38) | benign(0.131) | TCGA-IR-A3LK-01 | Cervix | cervical & endocervical cancer | Female | >=65 | I/II | Chemotherapy | cisplatin | PD |
| Page: 1 2 3 4 5 6 |
Top |
Related drugs of malignant transformation related genes |
| Identification of chemicals and drugs interact with genes involved in malignant transfromation |
| (DGIdb 4.0) |
| Entrez ID | Symbol | Category | Interaction Types | Drug Claim Name | Drug Name | PMIDs |
| Page: 1 |

Copyright 2023-Present -The University of Texas Health Science Center at Houston |