
|
|||||
|
 | |
| |
| |
| |
| |
| |
|
Gene: KIF1B |
Gene summary for KIF1B |
| Gene information | Species | Human | Gene symbol | KIF1B | Gene ID | 23095 |
| Gene name | kinesin family member 1B | |
| Gene Alias | CMT2 | |
| Cytomap | 1p36.22 | |
| Gene Type | protein-coding | GO ID | GO:0006810 | UniProtAcc | O60333 |
Top |
Malignant transformation analysis |
| Identification of the aberrant gene expression in precancerous and cancerous lesions by comparing the gene expression of stem-like cells in diseased tissues with normal stem cells |
| Entrez ID | Symbol | Replicates | Species | Organ | Tissue | Adj P-value | Log2FC | Malignancy |
| 23095 | KIF1B | CCI_1 | Human | Cervix | CC | 1.04e-10 | 8.43e-01 | 0.528 |
| 23095 | KIF1B | CCI_2 | Human | Cervix | CC | 1.63e-10 | 1.18e+00 | 0.5249 |
| 23095 | KIF1B | CCI_3 | Human | Cervix | CC | 3.54e-08 | 9.00e-01 | 0.516 |
| 23095 | KIF1B | HTA11_3410_2000001011 | Human | Colorectum | AD | 4.26e-08 | -4.48e-01 | 0.0155 |
| 23095 | KIF1B | HTA11_347_2000001011 | Human | Colorectum | AD | 2.93e-02 | 3.36e-01 | -0.1954 |
| 23095 | KIF1B | HTA11_83_2000001011 | Human | Colorectum | SER | 4.08e-02 | 4.65e-01 | -0.1526 |
| 23095 | KIF1B | HTA11_99999973899_84307 | Human | Colorectum | MSS | 3.36e-03 | -5.43e-01 | 0.2585 |
| 23095 | KIF1B | HTA11_99999974143_84620 | Human | Colorectum | MSS | 1.16e-12 | -4.90e-01 | 0.3005 |
| 23095 | KIF1B | A002-C-010 | Human | Colorectum | FAP | 4.00e-02 | -2.08e-01 | 0.242 |
| 23095 | KIF1B | A015-C-203 | Human | Colorectum | FAP | 1.20e-30 | -4.15e-01 | -0.1294 |
| 23095 | KIF1B | A015-C-204 | Human | Colorectum | FAP | 6.74e-03 | -1.17e-01 | -0.0228 |
| 23095 | KIF1B | A014-C-040 | Human | Colorectum | FAP | 3.59e-03 | -3.39e-01 | -0.1184 |
| 23095 | KIF1B | A002-C-201 | Human | Colorectum | FAP | 5.89e-12 | -3.13e-01 | 0.0324 |
| 23095 | KIF1B | A002-C-203 | Human | Colorectum | FAP | 1.77e-04 | -1.89e-01 | 0.2786 |
| 23095 | KIF1B | A001-C-119 | Human | Colorectum | FAP | 4.74e-03 | -2.09e-01 | -0.1557 |
| 23095 | KIF1B | A001-C-108 | Human | Colorectum | FAP | 2.19e-17 | -3.06e-01 | -0.0272 |
| 23095 | KIF1B | A002-C-205 | Human | Colorectum | FAP | 2.39e-20 | -3.81e-01 | -0.1236 |
| 23095 | KIF1B | A001-C-104 | Human | Colorectum | FAP | 6.58e-07 | -2.86e-01 | 0.0184 |
| 23095 | KIF1B | A015-C-005 | Human | Colorectum | FAP | 5.37e-04 | -3.46e-01 | -0.0336 |
| 23095 | KIF1B | A015-C-006 | Human | Colorectum | FAP | 1.18e-15 | -4.42e-01 | -0.0994 |
| Page: 1 2 3 4 5 6 7 8 9 10 |
| Tissue | Expression Dynamics | Abbreviation |
| Cervix |  | CC: Cervix cancer |
| HSIL_HPV: HPV-infected high-grade squamous intraepithelial lesions | ||
| N_HPV: HPV-infected normal cervix | ||
| Colorectum (GSE201348) |  | FAP: Familial adenomatous polyposis |
| CRC: Colorectal cancer | ||
| Colorectum (HTA11) |  | AD: Adenomas |
| SER: Sessile serrated lesions | ||
| MSI-H: Microsatellite-high colorectal cancer | ||
| MSS: Microsatellite stable colorectal cancer | ||
| Endometrium | 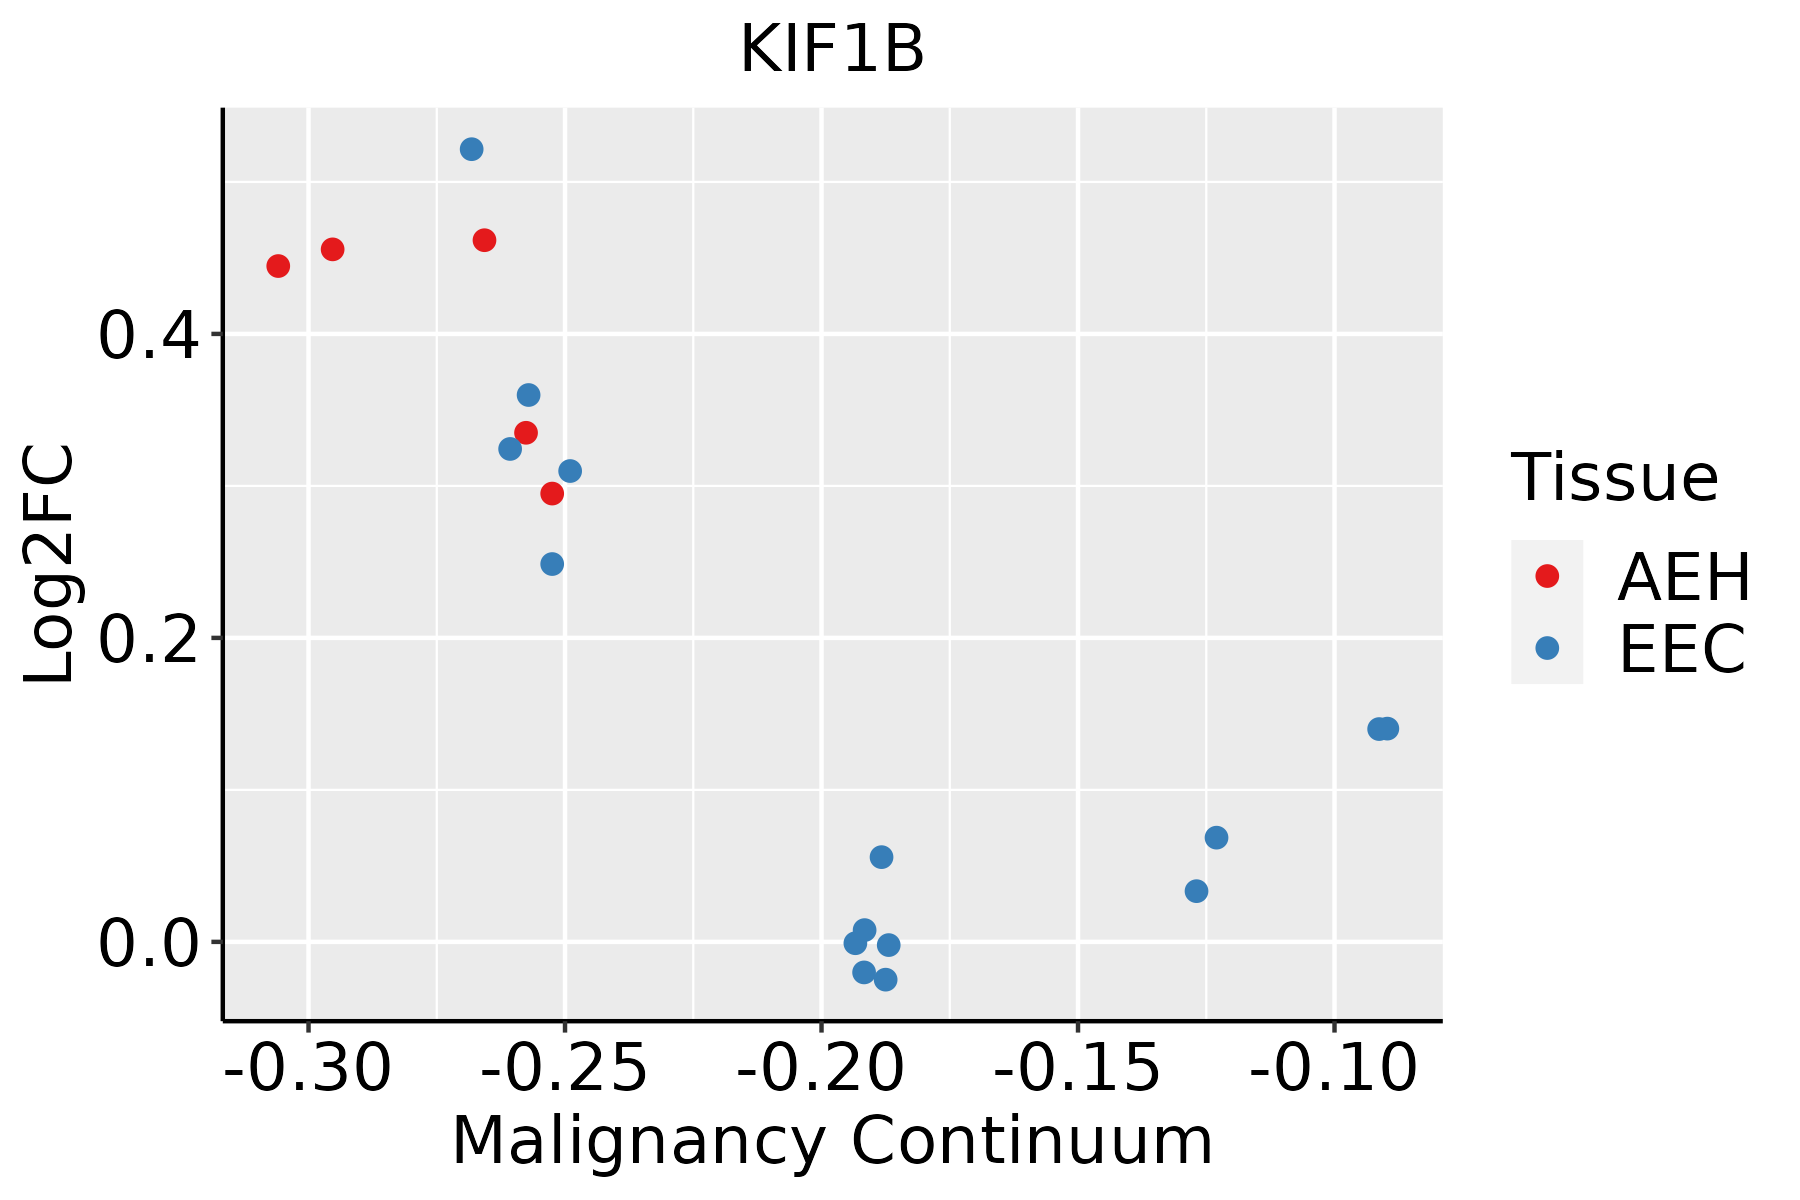 | AEH: Atypical endometrial hyperplasia |
| EEC: Endometrioid Cancer | ||
| Esophagus | 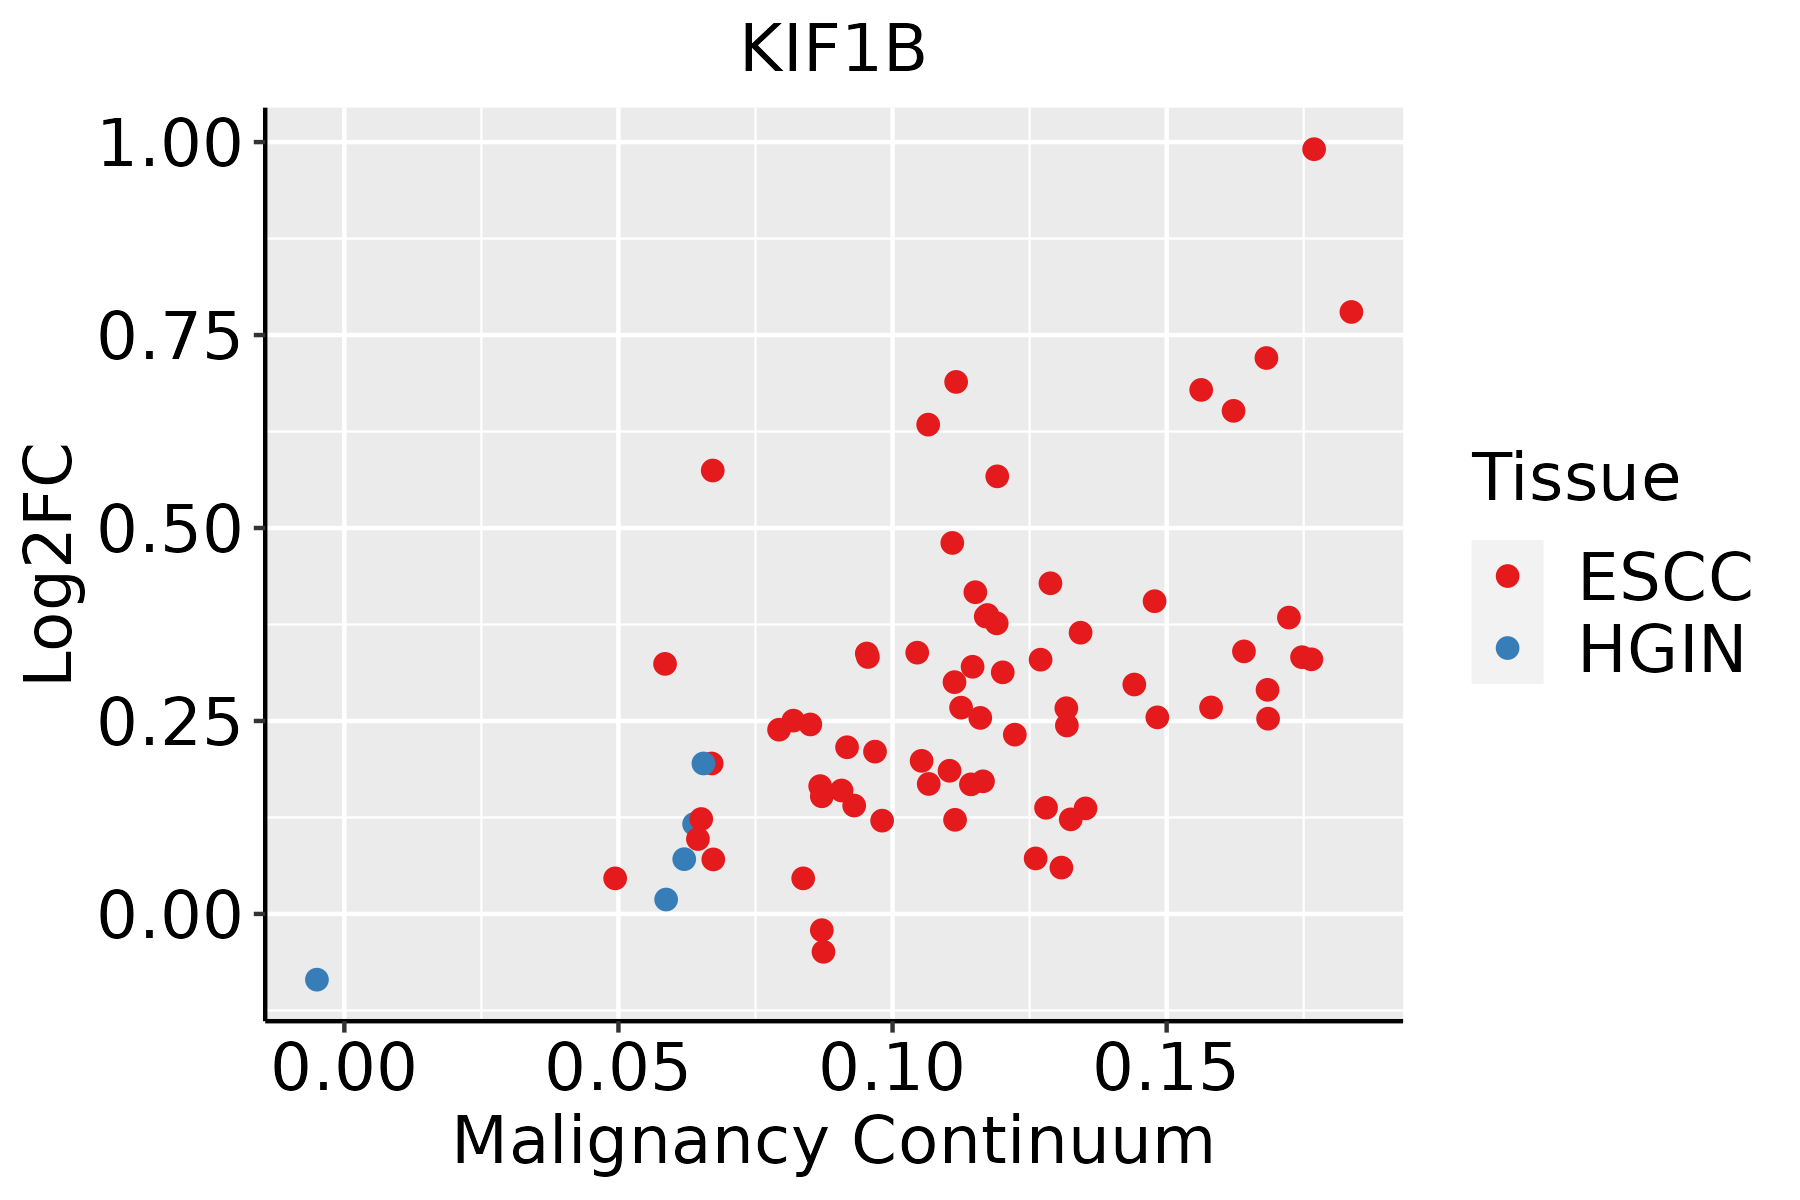 | ESCC: Esophageal squamous cell carcinoma |
| HGIN: High-grade intraepithelial neoplasias | ||
| LGIN: Low-grade intraepithelial neoplasias | ||
| Liver |  | HCC: Hepatocellular carcinoma |
| NAFLD: Non-alcoholic fatty liver disease | ||
| Lung |  | AAH: Atypical adenomatous hyperplasia |
| AIS: Adenocarcinoma in situ | ||
| IAC: Invasive lung adenocarcinoma | ||
| MIA: Minimally invasive adenocarcinoma | ||
| Oral Cavity | 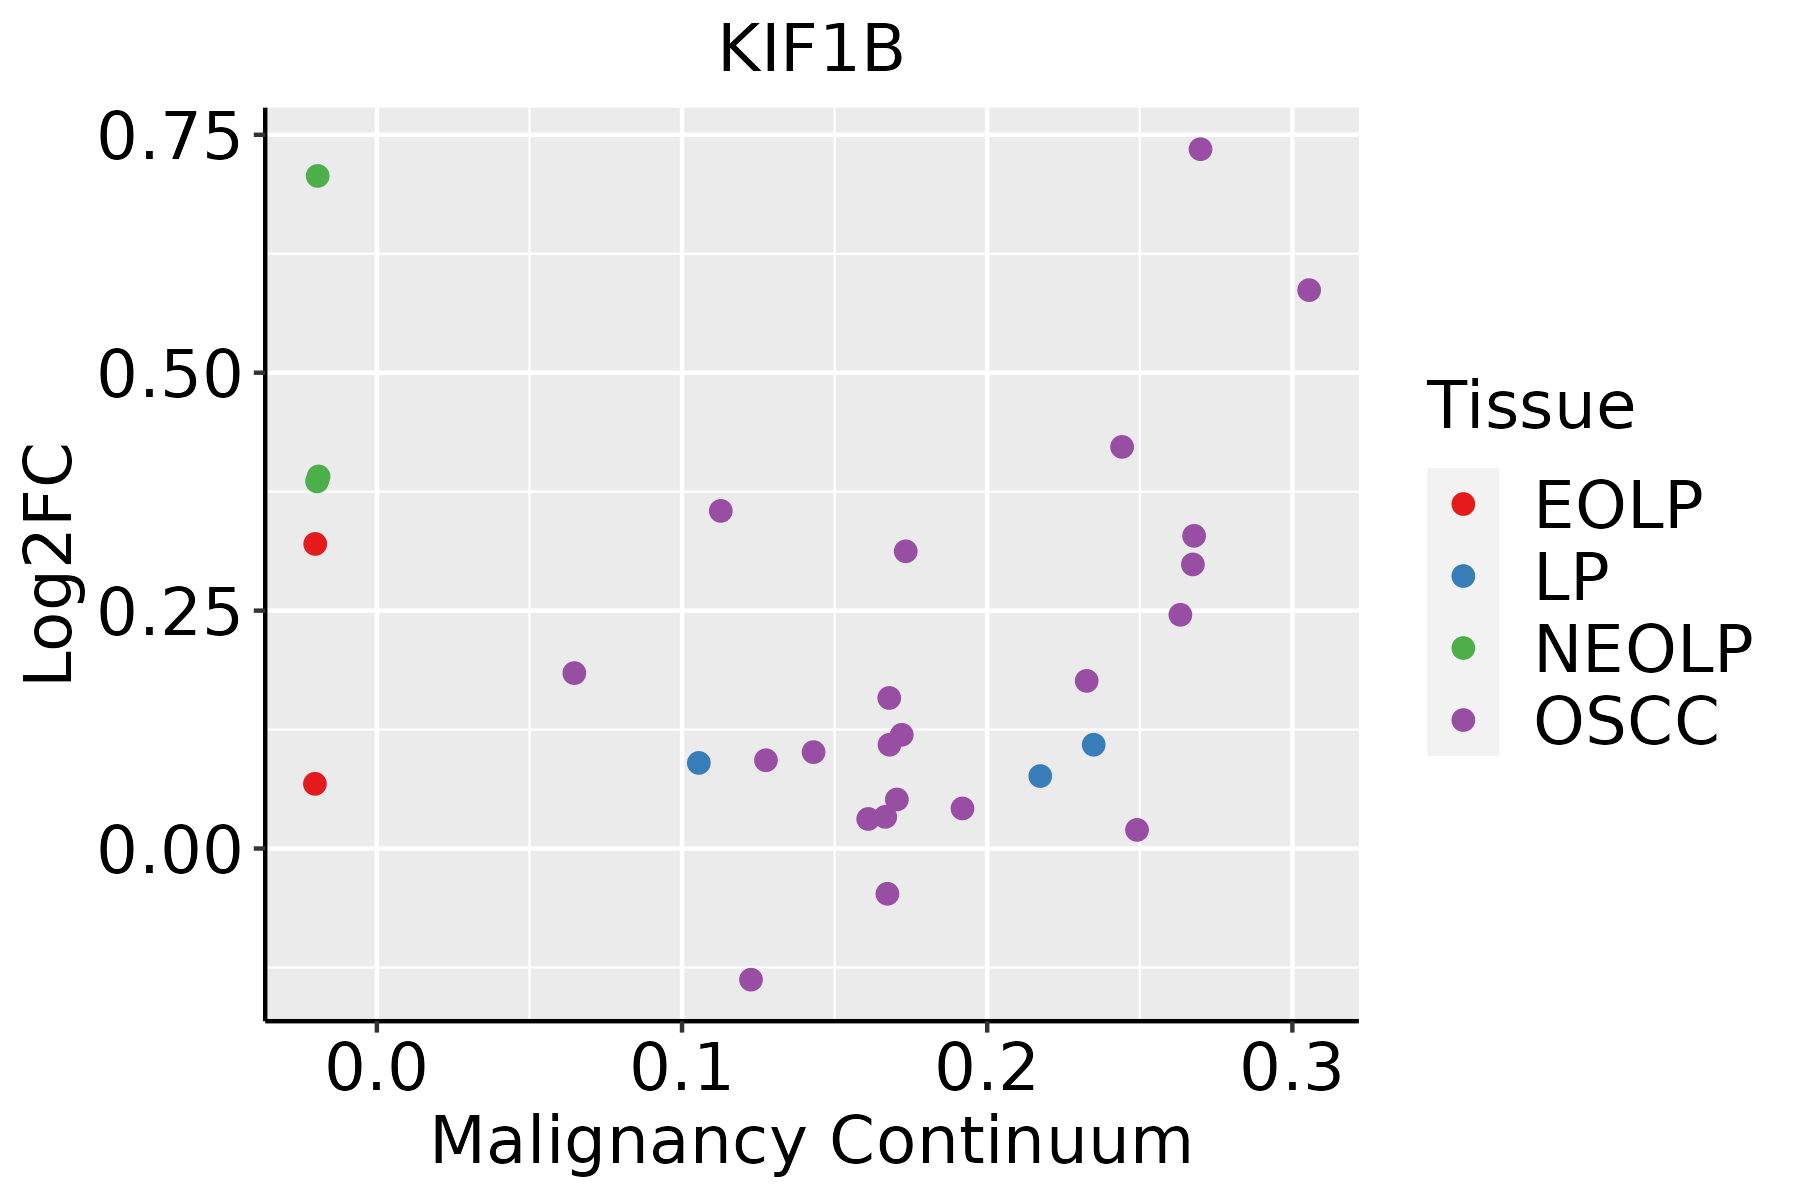 | EOLP: Erosive Oral lichen planus |
| LP: leukoplakia | ||
| NEOLP: Non-erosive oral lichen planus | ||
| OSCC: Oral squamous cell carcinoma | ||
| Prostate | 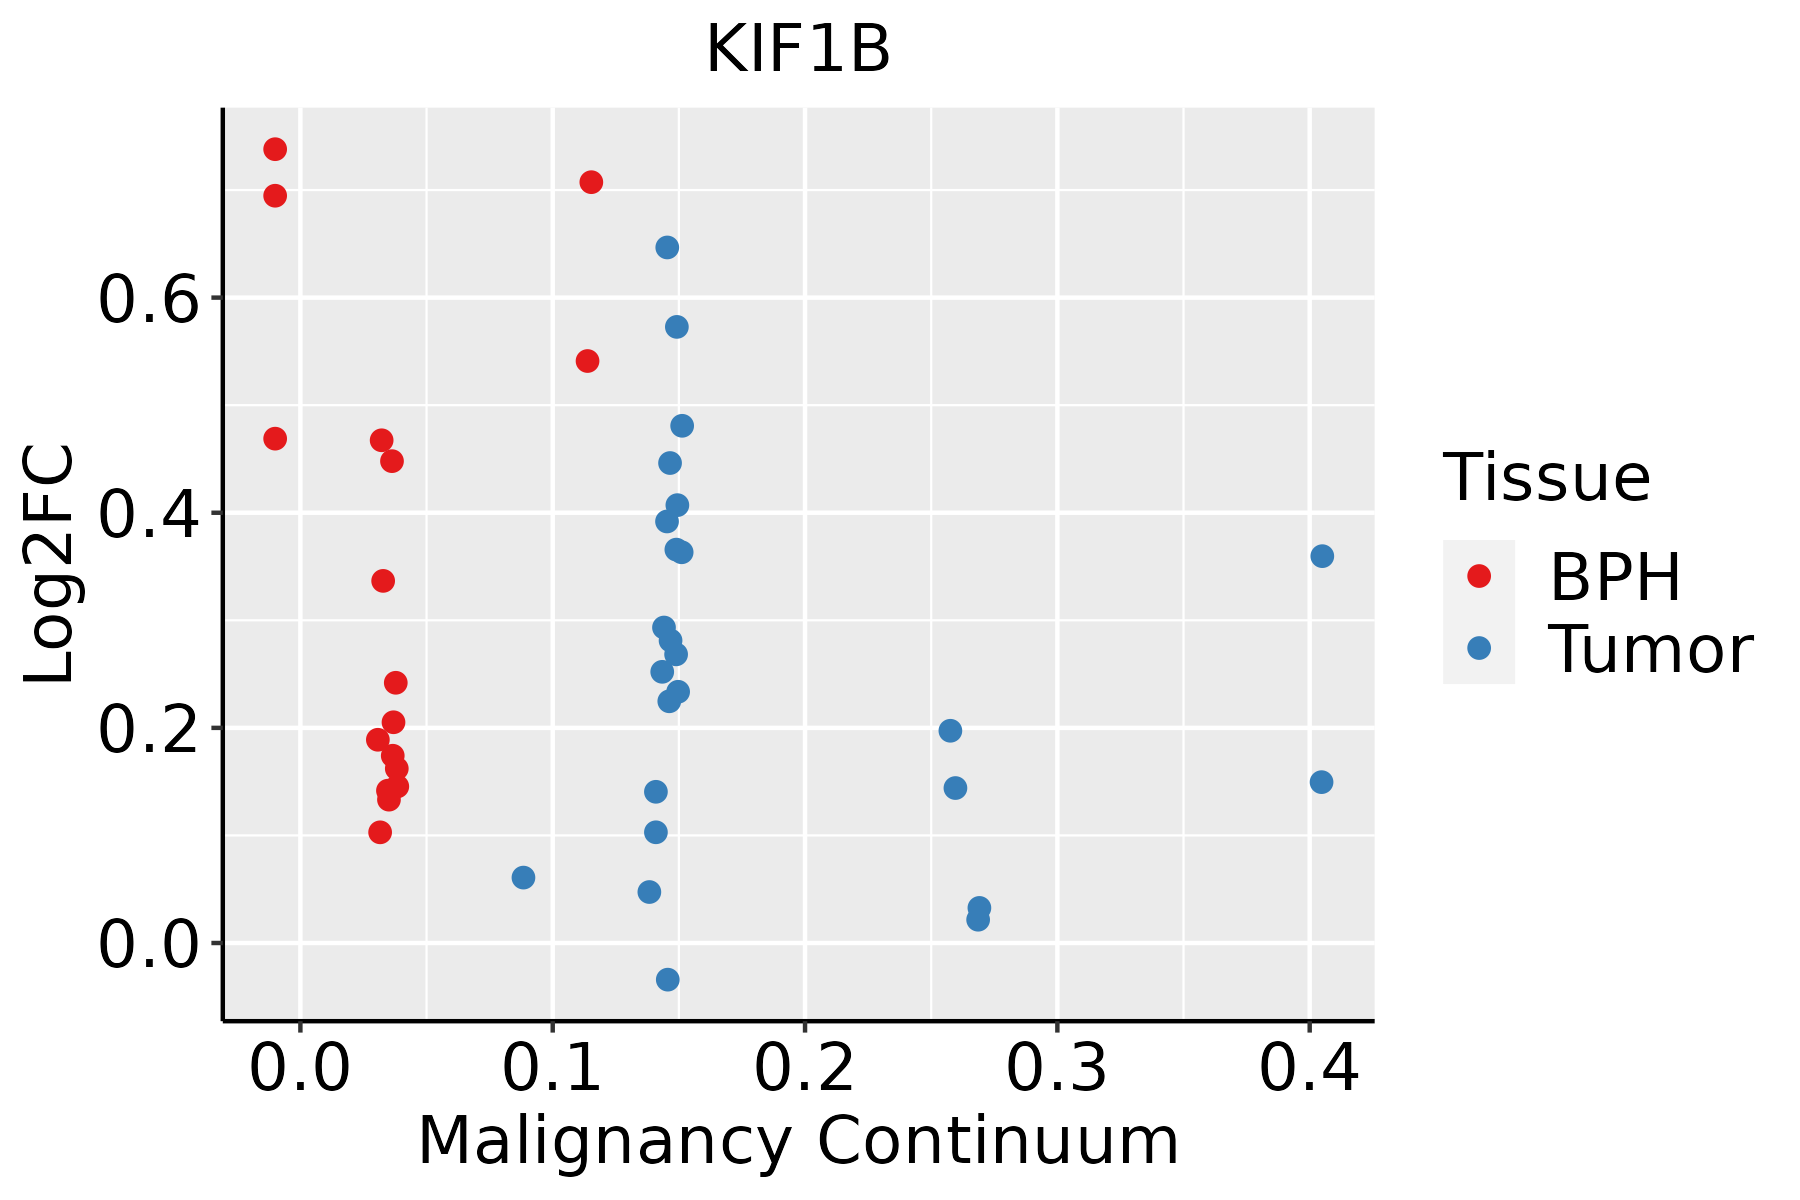 | BPH: Benign Prostatic Hyperplasia |
| Skin | 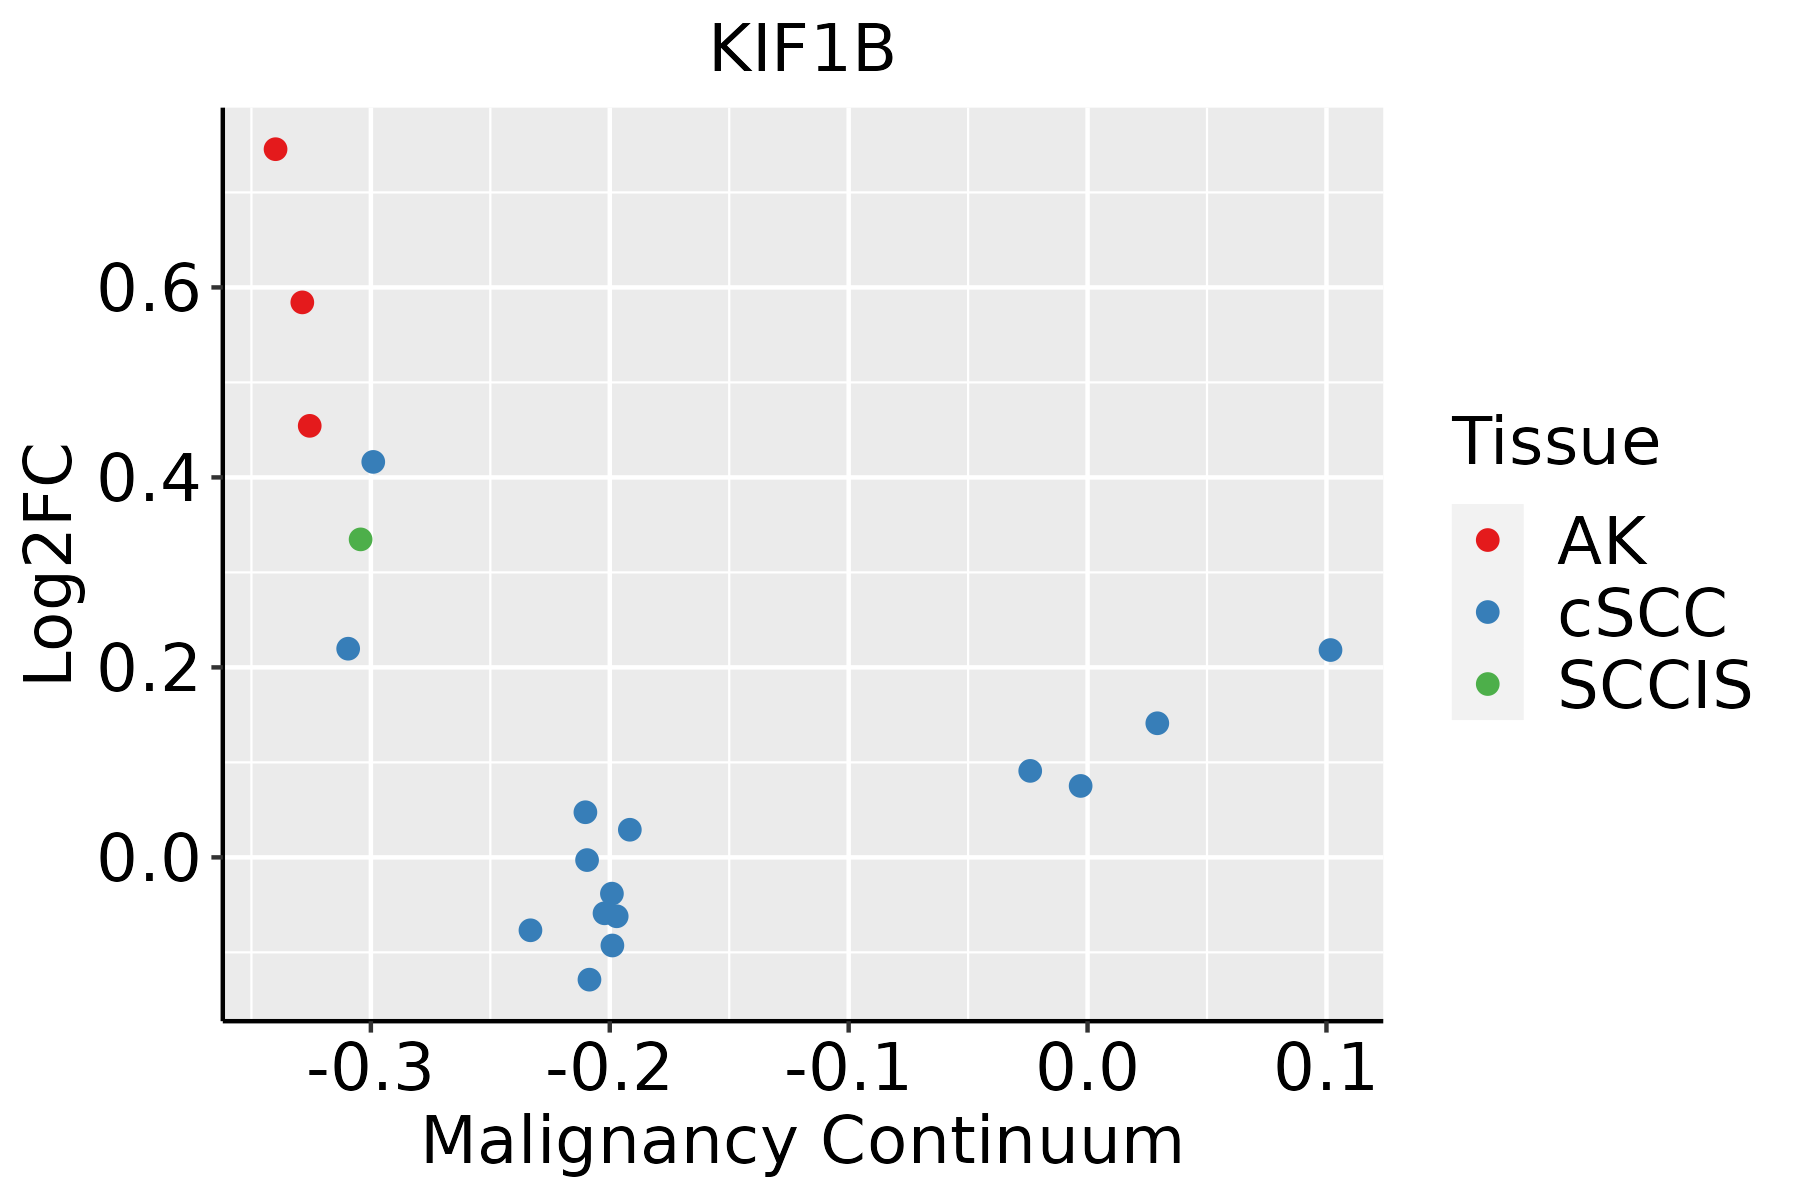 | AK: Actinic keratosis |
| cSCC: Cutaneous squamous cell carcinoma | ||
| SCCIS:squamous cell carcinoma in situ | ||
| Thyroid |  | ATC: Anaplastic thyroid cancer |
| HT: Hashimoto's thyroiditis | ||
| PTC: Papillary thyroid cancer |
| ∗log2FC in expression of this searched gene in stem-like cells from each diseased tissue sample relative to stem-like cells in normal samples in each tissue plotted against the malignancy continuum. Samples are colored based on if they are from different disease stage. |
Top |
Malignant transformation related pathway analysis |
| Find out the enriched GO biological processes and KEGG pathways involved in transition from healthy to precancer to cancer |
| Tissue | Disease Stage | Enriched GO biological Processes |
| Colorectum | AD |  |
| Colorectum | SER |  |
| Colorectum | MSS |  |
| Colorectum | MSI-H |  |
| Colorectum | FAP |  |
| ∗Top 15 enriched GO BP terms are showed in the bar plot of each disease state in each tissue. Each row represents a significant GO biological process which is colored according to the -log10(p.adjust). |
| Page: 1 2 3 4 5 6 7 8 9 |
| GO ID | Tissue | Disease Stage | Description | Gene Ratio | Bg Ratio | pvalue | p.adjust | Count |
| GO:00307057 | Cervix | CC | cytoskeleton-dependent intracellular transport | 40/2311 | 195/18723 | 7.92e-04 | 6.99e-03 | 40 |
| GO:00080886 | Cervix | CC | axo-dendritic transport | 17/2311 | 75/18723 | 8.87e-03 | 4.53e-02 | 17 |
| GO:0030705 | Colorectum | AD | cytoskeleton-dependent intracellular transport | 60/3918 | 195/18723 | 7.56e-04 | 7.59e-03 | 60 |
| GO:00307051 | Colorectum | SER | cytoskeleton-dependent intracellular transport | 44/2897 | 195/18723 | 5.53e-03 | 4.09e-02 | 44 |
| GO:00307052 | Colorectum | MSS | cytoskeleton-dependent intracellular transport | 52/3467 | 195/18723 | 3.07e-03 | 2.34e-02 | 52 |
| GO:00307053 | Colorectum | FAP | cytoskeleton-dependent intracellular transport | 47/2622 | 195/18723 | 1.06e-04 | 1.76e-03 | 47 |
| GO:0008088 | Colorectum | FAP | axo-dendritic transport | 19/2622 | 75/18723 | 6.44e-03 | 4.01e-02 | 19 |
| GO:00307054 | Colorectum | CRC | cytoskeleton-dependent intracellular transport | 45/2078 | 195/18723 | 1.29e-06 | 7.21e-05 | 45 |
| GO:0010970 | Colorectum | CRC | transport along microtubule | 30/2078 | 155/18723 | 1.67e-03 | 1.73e-02 | 30 |
| GO:00080881 | Colorectum | CRC | axo-dendritic transport | 17/2078 | 75/18723 | 3.04e-03 | 2.71e-02 | 17 |
| GO:00307058 | Endometrium | AEH | cytoskeleton-dependent intracellular transport | 38/2100 | 195/18723 | 4.72e-04 | 4.91e-03 | 38 |
| GO:00080887 | Endometrium | AEH | axo-dendritic transport | 16/2100 | 75/18723 | 8.13e-03 | 4.49e-02 | 16 |
| GO:003070514 | Endometrium | EEC | cytoskeleton-dependent intracellular transport | 39/2168 | 195/18723 | 4.40e-04 | 4.58e-03 | 39 |
| GO:000808813 | Endometrium | EEC | axo-dendritic transport | 17/2168 | 75/18723 | 4.71e-03 | 2.99e-02 | 17 |
| GO:003070518 | Esophagus | ESCC | cytoskeleton-dependent intracellular transport | 133/8552 | 195/18723 | 1.48e-10 | 4.27e-09 | 133 |
| GO:001097013 | Esophagus | ESCC | transport along microtubule | 107/8552 | 155/18723 | 3.17e-09 | 6.80e-08 | 107 |
| GO:000808810 | Esophagus | ESCC | axo-dendritic transport | 58/8552 | 75/18723 | 2.09e-08 | 4.02e-07 | 58 |
| GO:00989304 | Esophagus | ESCC | axonal transport | 49/8552 | 64/18723 | 4.54e-07 | 6.15e-06 | 49 |
| GO:00991114 | Esophagus | ESCC | microtubule-based transport | 115/8552 | 190/18723 | 2.54e-05 | 2.15e-04 | 115 |
| GO:00080892 | Esophagus | ESCC | anterograde axonal transport | 37/8552 | 50/18723 | 4.42e-05 | 3.51e-04 | 37 |
| Page: 1 2 3 4 5 |
| Pathway ID | Tissue | Disease Stage | Description | Gene Ratio | Bg Ratio | pvalue | p.adjust | qvalue | Count |
| hsa048144 | Endometrium | AEH | Motor proteins | 42/1197 | 193/8465 | 2.41e-03 | 1.42e-02 | 1.04e-02 | 42 |
| hsa0481411 | Endometrium | AEH | Motor proteins | 42/1197 | 193/8465 | 2.41e-03 | 1.42e-02 | 1.04e-02 | 42 |
| hsa048142 | Endometrium | EEC | Motor proteins | 42/1237 | 193/8465 | 4.43e-03 | 2.39e-02 | 1.78e-02 | 42 |
| hsa048143 | Endometrium | EEC | Motor proteins | 42/1237 | 193/8465 | 4.43e-03 | 2.39e-02 | 1.78e-02 | 42 |
| hsa04814 | Lung | MIAC | Motor proteins | 21/507 | 193/8465 | 5.64e-03 | 3.82e-02 | 2.76e-02 | 21 |
| hsa048141 | Lung | MIAC | Motor proteins | 21/507 | 193/8465 | 5.64e-03 | 3.82e-02 | 2.76e-02 | 21 |
| hsa048145 | Oral cavity | NEOLP | Motor proteins | 37/1112 | 193/8465 | 1.06e-02 | 3.54e-02 | 2.22e-02 | 37 |
| hsa0481412 | Oral cavity | NEOLP | Motor proteins | 37/1112 | 193/8465 | 1.06e-02 | 3.54e-02 | 2.22e-02 | 37 |
| Page: 1 |
Top |
Cell-cell communication analysis |
| Identification of potential cell-cell interactions between two cell types and their ligand-receptor pairs for different disease states |
| Ligand | Receptor | LRpair | Pathway | Tissue | Disease Stage |
| Page: 1 |
Top |
Single-cell gene regulatory network inference analysis |
| Find out the significant the regulons (TFs) and the target genes of each regulon across cell types for different disease states |
| TF | Cell Type | Tissue | Disease Stage | Target Gene | RSS | Regulon Activity |
| ∗The dot plots of a searched regulon are shown for all cell subpopulations in each disease state of each tissue based on the regulon specific score inferred using pySCENIC and by calculating the average expression. |
| Page: 1 |
Top |
Somatic mutation of malignant transformation related genes |
| Annotation of somatic variants for genes involved in malignant transformation |
| Hugo Symbol | Variant Class | Variant Classification | dbSNP RS | HGVSc | HGVSp | HGVSp Short | SWISSPROT | BIOTYPE | SIFT | PolyPhen | Tumor Sample Barcode | Tissue | Histology | Sex | Age | Stage | Therapy Types | Drugs | Outcome |
| KIF1B | SNV | Missense_Mutation | novel | c.206C>T | p.Ser69Phe | p.S69F | O60333 | protein_coding | deleterious(0) | probably_damaging(0.992) | TCGA-A2-A0CR-01 | Breast | breast invasive carcinoma | Female | <65 | I/II | Chemotherapy | adriamycin | CR |
| KIF1B | SNV | Missense_Mutation | novel | c.3659N>T | p.Glu1220Val | p.E1220V | O60333 | protein_coding | deleterious(0) | benign(0.095) | TCGA-A2-A0CT-01 | Breast | breast invasive carcinoma | Female | >=65 | I/II | Chemotherapy | cytoxan | SD |
| KIF1B | SNV | Missense_Mutation | rs764473301 | c.3820N>T | p.Arg1274Trp | p.R1274W | O60333 | protein_coding | deleterious(0) | probably_damaging(0.992) | TCGA-A8-A06Q-01 | Breast | breast invasive carcinoma | Female | <65 | III/IV | Unknown | Unknown | SD |
| KIF1B | SNV | Missense_Mutation | c.1711N>G | p.Gln571Glu | p.Q571E | O60333 | protein_coding | tolerated(0.37) | benign(0.001) | TCGA-A8-A06X-01 | Breast | breast invasive carcinoma | Female | >=65 | I/II | Unknown | Unknown | SD | |
| KIF1B | SNV | Missense_Mutation | c.4548G>C | p.Glu1516Asp | p.E1516D | O60333 | protein_coding | tolerated(0.32) | probably_damaging(0.969) | TCGA-AC-A23H-01 | Breast | breast invasive carcinoma | Female | >=65 | I/II | Unknown | Unknown | PD | |
| KIF1B | SNV | Missense_Mutation | novel | c.1055C>T | p.Ala352Val | p.A352V | O60333 | protein_coding | deleterious(0) | probably_damaging(0.987) | TCGA-AN-A046-01 | Breast | breast invasive carcinoma | Female | >=65 | I/II | Unknown | Unknown | SD |
| KIF1B | SNV | Missense_Mutation | c.2623A>G | p.Thr875Ala | p.T875A | O60333 | protein_coding | tolerated(0.19) | probably_damaging(0.953) | TCGA-AO-A1KP-01 | Breast | breast invasive carcinoma | Female | >=65 | I/II | Chemotherapy | fluorouracil | SD | |
| KIF1B | SNV | Missense_Mutation | rs764473301 | c.3820C>T | p.Arg1274Trp | p.R1274W | O60333 | protein_coding | deleterious(0) | probably_damaging(0.992) | TCGA-B6-A0IK-01 | Breast | breast invasive carcinoma | Female | <65 | III/IV | Unknown | Unknown | PD |
| KIF1B | SNV | Missense_Mutation | c.3934N>C | p.Glu1312Gln | p.E1312Q | O60333 | protein_coding | deleterious(0.05) | probably_damaging(0.969) | TCGA-BH-A1EV-01 | Breast | breast invasive carcinoma | Female | <65 | III/IV | Unknown | Unknown | PD | |
| KIF1B | SNV | Missense_Mutation | c.3911C>G | p.Ser1304Cys | p.S1304C | O60333 | protein_coding | deleterious(0.01) | possibly_damaging(0.694) | TCGA-C8-A26Y-01 | Breast | breast invasive carcinoma | Female | >=65 | I/II | Unknown | Unknown | SD |
| Page: 1 2 3 4 5 6 7 8 9 10 11 12 13 14 15 16 17 18 19 20 21 |
Top |
Related drugs of malignant transformation related genes |
| Identification of chemicals and drugs interact with genes involved in malignant transfromation |
| (DGIdb 4.0) |
| Entrez ID | Symbol | Category | Interaction Types | Drug Claim Name | Drug Name | PMIDs |
| Page: 1 |

Copyright 2023-Present -The University of Texas Health Science Center at Houston |