
|
|||||
|
 | |
| |
| |
| |
| |
| |
|
Gene: KIF16B |
Gene summary for KIF16B |
| Gene information | Species | Human | Gene symbol | KIF16B | Gene ID | 55614 |
| Gene name | kinesin family member 16B | |
| Gene Alias | C20orf23 | |
| Cytomap | 20p12.1 | |
| Gene Type | protein-coding | GO ID | GO:0001704 | UniProtAcc | A0A1B0GTU3 |
Top |
Malignant transformation analysis |
| Identification of the aberrant gene expression in precancerous and cancerous lesions by comparing the gene expression of stem-like cells in diseased tissues with normal stem cells |
| Entrez ID | Symbol | Replicates | Species | Organ | Tissue | Adj P-value | Log2FC | Malignancy |
| 55614 | KIF16B | CCI_1 | Human | Cervix | CC | 1.44e-06 | 7.76e-01 | 0.528 |
| 55614 | KIF16B | CCI_3 | Human | Cervix | CC | 6.80e-07 | 6.83e-01 | 0.516 |
| 55614 | KIF16B | HTA11_3410_2000001011 | Human | Colorectum | AD | 2.48e-29 | -7.62e-01 | 0.0155 |
| 55614 | KIF16B | HTA11_2951_2000001011 | Human | Colorectum | AD | 1.51e-03 | -7.77e-01 | 0.0216 |
| 55614 | KIF16B | HTA11_3361_2000001011 | Human | Colorectum | AD | 8.87e-03 | -5.05e-01 | -0.1207 |
| 55614 | KIF16B | HTA11_7862_2000001011 | Human | Colorectum | AD | 1.03e-05 | -6.65e-01 | -0.0179 |
| 55614 | KIF16B | HTA11_866_3004761011 | Human | Colorectum | AD | 3.04e-07 | -5.07e-01 | 0.096 |
| 55614 | KIF16B | HTA11_8622_2000001021 | Human | Colorectum | SER | 2.15e-05 | -7.65e-01 | 0.0528 |
| 55614 | KIF16B | HTA11_10623_2000001011 | Human | Colorectum | AD | 1.45e-03 | -6.17e-01 | -0.0177 |
| 55614 | KIF16B | HTA11_10711_2000001011 | Human | Colorectum | AD | 5.51e-09 | -6.24e-01 | 0.0338 |
| 55614 | KIF16B | HTA11_7696_3000711011 | Human | Colorectum | AD | 2.49e-18 | -5.59e-01 | 0.0674 |
| 55614 | KIF16B | HTA11_99999970781_79442 | Human | Colorectum | MSS | 1.06e-22 | -5.84e-01 | 0.294 |
| 55614 | KIF16B | HTA11_99999971662_82457 | Human | Colorectum | MSS | 1.60e-25 | -7.07e-01 | 0.3859 |
| 55614 | KIF16B | HTA11_99999973899_84307 | Human | Colorectum | MSS | 7.01e-05 | -6.22e-01 | 0.2585 |
| 55614 | KIF16B | HTA11_99999974143_84620 | Human | Colorectum | MSS | 7.49e-22 | -6.41e-01 | 0.3005 |
| 55614 | KIF16B | F007 | Human | Colorectum | FAP | 5.83e-04 | 2.09e-01 | 0.1176 |
| 55614 | KIF16B | A001-C-207 | Human | Colorectum | FAP | 3.36e-03 | -1.41e-01 | 0.1278 |
| 55614 | KIF16B | A015-C-203 | Human | Colorectum | FAP | 1.25e-31 | -3.90e-01 | -0.1294 |
| 55614 | KIF16B | A015-C-204 | Human | Colorectum | FAP | 2.37e-08 | -1.94e-01 | -0.0228 |
| 55614 | KIF16B | A014-C-040 | Human | Colorectum | FAP | 5.88e-07 | -3.21e-01 | -0.1184 |
| Page: 1 2 3 4 5 6 |
| Tissue | Expression Dynamics | Abbreviation |
| Cervix | 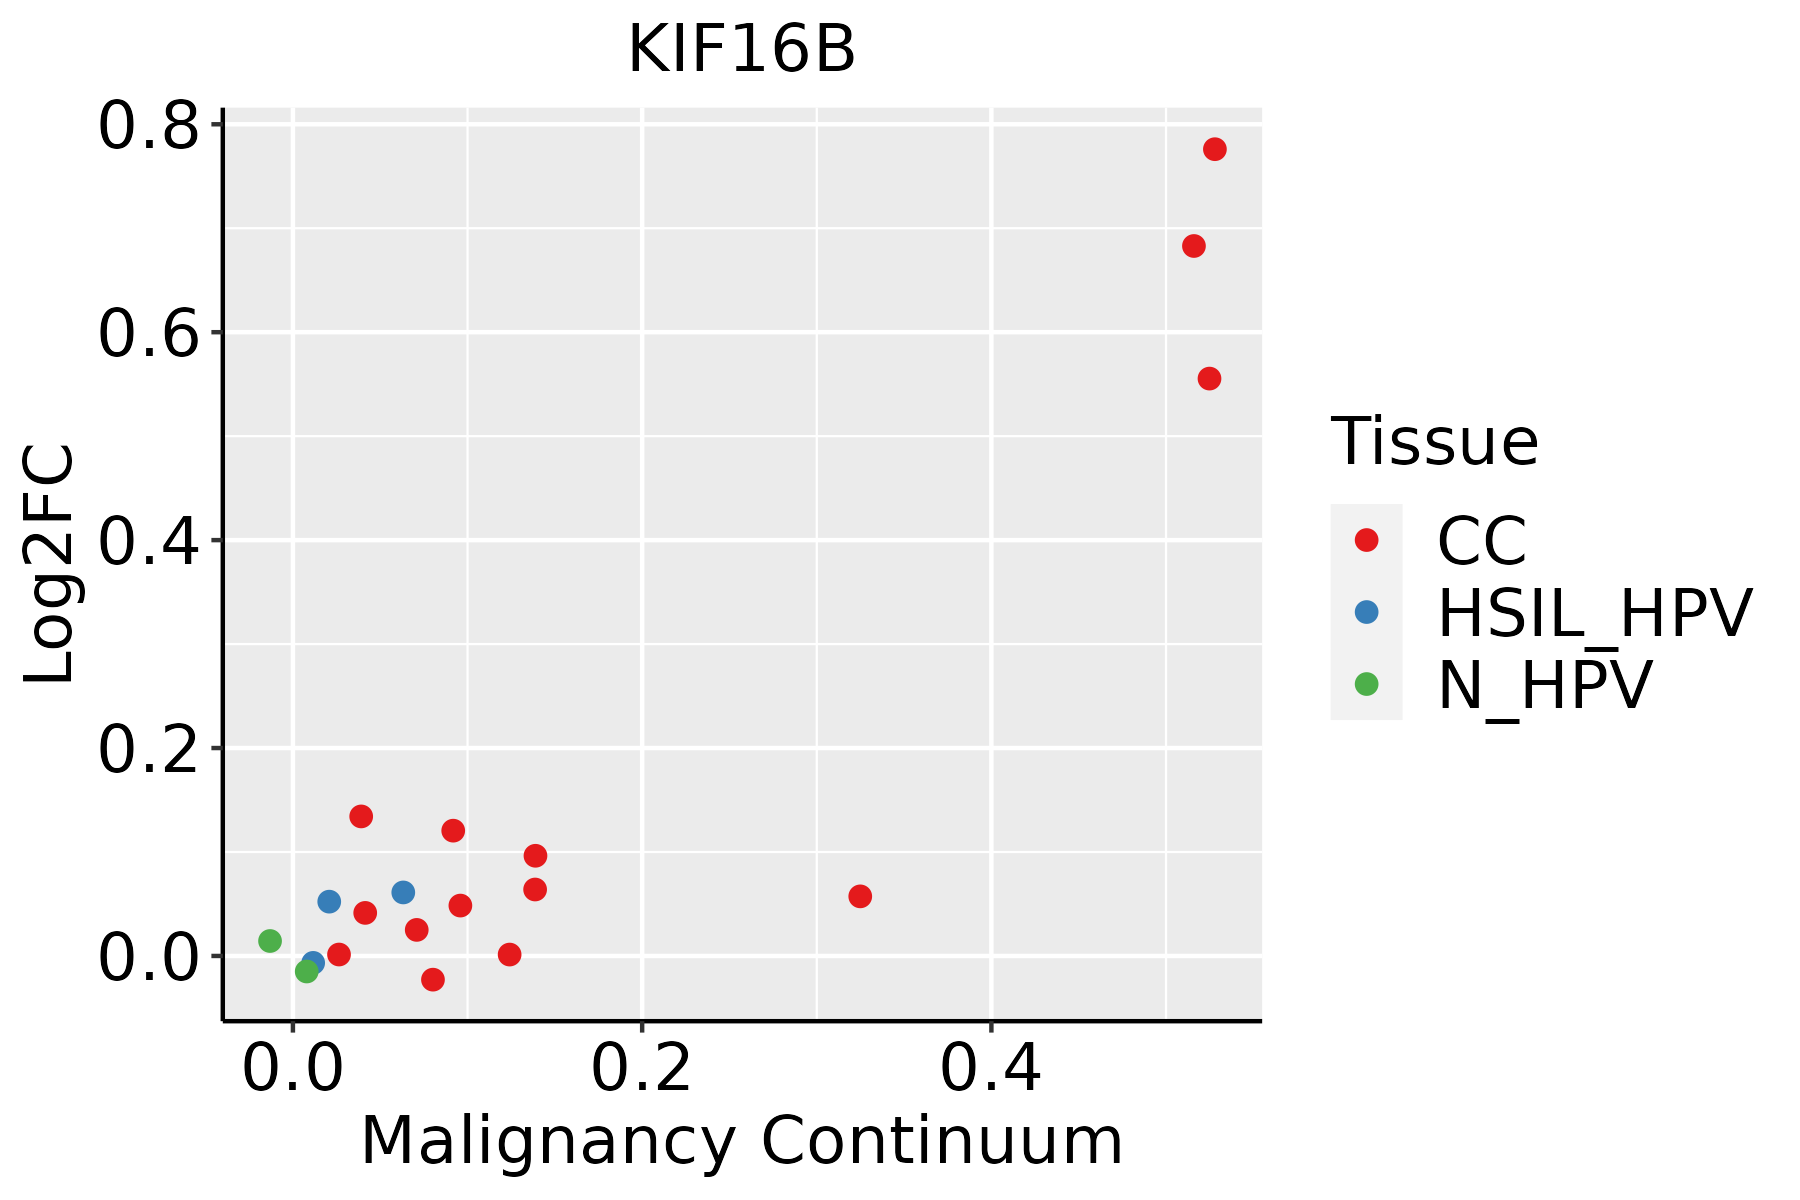 | CC: Cervix cancer |
| HSIL_HPV: HPV-infected high-grade squamous intraepithelial lesions | ||
| N_HPV: HPV-infected normal cervix | ||
| Colorectum (GSE201348) |  | FAP: Familial adenomatous polyposis |
| CRC: Colorectal cancer | ||
| Colorectum (HTA11) |  | AD: Adenomas |
| SER: Sessile serrated lesions | ||
| MSI-H: Microsatellite-high colorectal cancer | ||
| MSS: Microsatellite stable colorectal cancer | ||
| Esophagus | 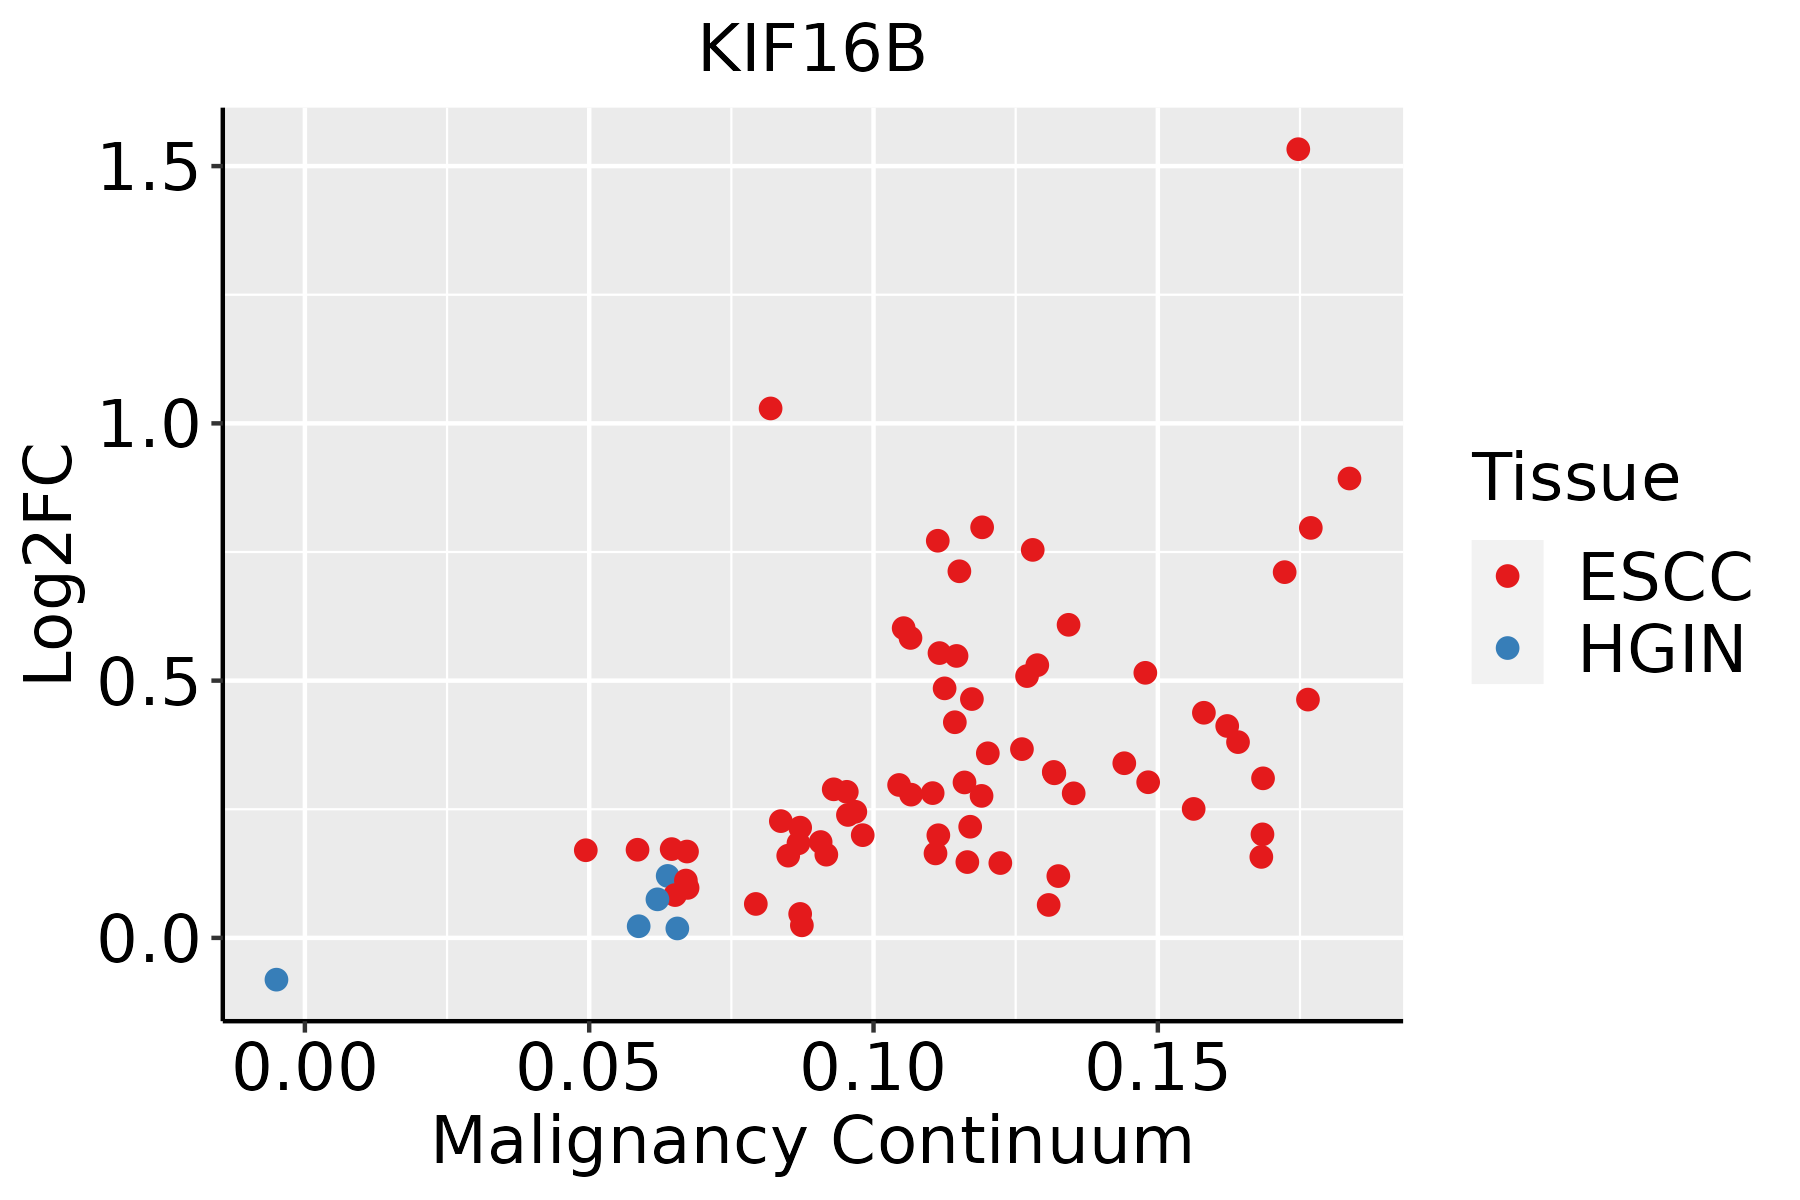 | ESCC: Esophageal squamous cell carcinoma |
| HGIN: High-grade intraepithelial neoplasias | ||
| LGIN: Low-grade intraepithelial neoplasias | ||
| Oral Cavity |  | EOLP: Erosive Oral lichen planus |
| LP: leukoplakia | ||
| NEOLP: Non-erosive oral lichen planus | ||
| OSCC: Oral squamous cell carcinoma | ||
| Prostate |  | BPH: Benign Prostatic Hyperplasia |
| ∗log2FC in expression of this searched gene in stem-like cells from each diseased tissue sample relative to stem-like cells in normal samples in each tissue plotted against the malignancy continuum. Samples are colored based on if they are from different disease stage. |
Top |
Malignant transformation related pathway analysis |
| Find out the enriched GO biological processes and KEGG pathways involved in transition from healthy to precancer to cancer |
| Tissue | Disease Stage | Enriched GO biological Processes |
| Colorectum | AD |  |
| Colorectum | SER |  |
| Colorectum | MSS |  |
| Colorectum | MSI-H |  |
| Colorectum | FAP |  |
| ∗Top 15 enriched GO BP terms are showed in the bar plot of each disease state in each tissue. Each row represents a significant GO biological process which is colored according to the -log10(p.adjust). |
| Page: 1 2 3 4 5 6 7 8 9 |
| GO ID | Tissue | Disease Stage | Description | Gene Ratio | Bg Ratio | pvalue | p.adjust | Count |
| GO:00071738 | Cervix | CC | epidermal growth factor receptor signaling pathway | 36/2311 | 108/18723 | 1.04e-08 | 8.44e-07 | 36 |
| GO:00381278 | Cervix | CC | ERBB signaling pathway | 37/2311 | 121/18723 | 8.57e-08 | 4.88e-06 | 37 |
| GO:00068927 | Cervix | CC | post-Golgi vesicle-mediated transport | 28/2311 | 104/18723 | 4.31e-05 | 6.61e-04 | 28 |
| GO:00073695 | Cervix | CC | gastrulation | 42/2311 | 185/18723 | 5.83e-05 | 8.46e-04 | 42 |
| GO:00481938 | Cervix | CC | Golgi vesicle transport | 58/2311 | 296/18723 | 2.24e-04 | 2.54e-03 | 58 |
| GO:00431127 | Cervix | CC | receptor metabolic process | 37/2311 | 166/18723 | 2.31e-04 | 2.58e-03 | 37 |
| GO:00074923 | Cervix | CC | endoderm development | 20/2311 | 77/18723 | 8.40e-04 | 7.30e-03 | 20 |
| GO:0001704 | Cervix | CC | formation of primary germ layer | 27/2311 | 121/18723 | 1.49e-03 | 1.16e-02 | 27 |
| GO:00164827 | Cervix | CC | cytosolic transport | 33/2311 | 168/18723 | 4.43e-03 | 2.70e-02 | 33 |
| GO:0048193 | Colorectum | AD | Golgi vesicle transport | 109/3918 | 296/18723 | 1.80e-10 | 1.68e-08 | 109 |
| GO:0038127 | Colorectum | AD | ERBB signaling pathway | 55/3918 | 121/18723 | 1.19e-09 | 8.85e-08 | 55 |
| GO:0007173 | Colorectum | AD | epidermal growth factor receptor signaling pathway | 50/3918 | 108/18723 | 3.08e-09 | 2.07e-07 | 50 |
| GO:0016482 | Colorectum | AD | cytosolic transport | 68/3918 | 168/18723 | 6.00e-09 | 3.72e-07 | 68 |
| GO:0006892 | Colorectum | AD | post-Golgi vesicle-mediated transport | 45/3918 | 104/18723 | 2.22e-07 | 9.26e-06 | 45 |
| GO:0043112 | Colorectum | AD | receptor metabolic process | 62/3918 | 166/18723 | 8.18e-07 | 2.85e-05 | 62 |
| GO:0001881 | Colorectum | AD | receptor recycling | 18/3918 | 33/18723 | 2.23e-05 | 4.40e-04 | 18 |
| GO:0098927 | Colorectum | AD | vesicle-mediated transport between endosomal compartments | 19/3918 | 43/18723 | 5.03e-04 | 5.43e-03 | 19 |
| GO:0001919 | Colorectum | AD | regulation of receptor recycling | 12/3918 | 23/18723 | 9.11e-04 | 8.71e-03 | 12 |
| GO:0045022 | Colorectum | AD | early endosome to late endosome transport | 17/3918 | 40/18723 | 1.66e-03 | 1.38e-02 | 17 |
| GO:0032801 | Colorectum | AD | receptor catabolic process | 12/3918 | 28/18723 | 7.21e-03 | 4.39e-02 | 12 |
| Page: 1 2 3 4 5 6 |
| Pathway ID | Tissue | Disease Stage | Description | Gene Ratio | Bg Ratio | pvalue | p.adjust | qvalue | Count |
| Page: 1 |
Top |
Cell-cell communication analysis |
| Identification of potential cell-cell interactions between two cell types and their ligand-receptor pairs for different disease states |
| Ligand | Receptor | LRpair | Pathway | Tissue | Disease Stage |
| Page: 1 |
Top |
Single-cell gene regulatory network inference analysis |
| Find out the significant the regulons (TFs) and the target genes of each regulon across cell types for different disease states |
| TF | Cell Type | Tissue | Disease Stage | Target Gene | RSS | Regulon Activity |
| ∗The dot plots of a searched regulon are shown for all cell subpopulations in each disease state of each tissue based on the regulon specific score inferred using pySCENIC and by calculating the average expression. |
| Page: 1 |
Top |
Somatic mutation of malignant transformation related genes |
| Annotation of somatic variants for genes involved in malignant transformation |
| Hugo Symbol | Variant Class | Variant Classification | dbSNP RS | HGVSc | HGVSp | HGVSp Short | SWISSPROT | BIOTYPE | SIFT | PolyPhen | Tumor Sample Barcode | Tissue | Histology | Sex | Age | Stage | Therapy Types | Drugs | Outcome |
| KIF16B | SNV | Missense_Mutation | c.737N>A | p.Ser246Asn | p.S246N | Q96L93 | protein_coding | deleterious(0) | probably_damaging(0.997) | TCGA-A2-A0CS-01 | Breast | breast invasive carcinoma | Female | >=65 | III/IV | Hormone Therapy | anastrozole | SD | |
| KIF16B | SNV | Missense_Mutation | c.3478C>G | p.Gln1160Glu | p.Q1160E | Q96L93 | protein_coding | deleterious_low_confidence(0.03) | possibly_damaging(0.6) | TCGA-AC-A23H-01 | Breast | breast invasive carcinoma | Female | >=65 | I/II | Unknown | Unknown | PD | |
| KIF16B | SNV | Missense_Mutation | c.2025N>T | p.Glu675Asp | p.E675D | Q96L93 | protein_coding | deleterious(0) | probably_damaging(0.993) | TCGA-AN-A046-01 | Breast | breast invasive carcinoma | Female | >=65 | I/II | Unknown | Unknown | SD | |
| KIF16B | SNV | Missense_Mutation | rs865904201 | c.434N>A | p.Arg145Gln | p.R145Q | Q96L93 | protein_coding | deleterious(0.03) | probably_damaging(0.978) | TCGA-AN-A046-01 | Breast | breast invasive carcinoma | Female | >=65 | I/II | Unknown | Unknown | SD |
| KIF16B | SNV | Missense_Mutation | c.3052N>A | p.Ala1018Thr | p.A1018T | Q96L93 | protein_coding | tolerated_low_confidence(0.06) | probably_damaging(0.999) | TCGA-AN-A0AK-01 | Breast | breast invasive carcinoma | Female | >=65 | I/II | Unknown | Unknown | SD | |
| KIF16B | SNV | Missense_Mutation | novel | c.2941C>G | p.Arg981Gly | p.R981G | Q96L93 | protein_coding | deleterious_low_confidence(0) | probably_damaging(0.999) | TCGA-AR-A2LO-01 | Breast | breast invasive carcinoma | Female | <65 | I/II | Chemotherapy | adriamycin | SD |
| KIF16B | SNV | Missense_Mutation | c.757N>T | p.Leu253Phe | p.L253F | Q96L93 | protein_coding | deleterious(0) | probably_damaging(0.999) | TCGA-BH-A0HF-01 | Breast | breast invasive carcinoma | Female | >=65 | I/II | Hormone Therapy | arimidex | SD | |
| KIF16B | SNV | Missense_Mutation | novel | c.2356N>C | p.Trp786Arg | p.W786R | Q96L93 | protein_coding | tolerated(1) | benign(0) | TCGA-BH-A18G-01 | Breast | breast invasive carcinoma | Female | >=65 | I/II | Unknown | Unknown | SD |
| KIF16B | SNV | Missense_Mutation | novel | c.977N>C | p.Asn326Thr | p.N326T | Q96L93 | protein_coding | deleterious(0) | probably_damaging(0.998) | TCGA-BH-A8FY-01 | Breast | breast invasive carcinoma | Female | >=65 | I/II | Unknown | Unknown | SD |
| KIF16B | SNV | Missense_Mutation | c.689N>G | p.Lys230Arg | p.K230R | Q96L93 | protein_coding | tolerated(0.25) | benign(0.041) | TCGA-E9-A1RA-01 | Breast | breast invasive carcinoma | Female | <65 | I/II | Hormone Therapy | tamoxiphen | SD |
| Page: 1 2 3 4 5 6 7 8 9 10 11 12 13 14 15 16 17 18 19 20 21 22 |
Top |
Related drugs of malignant transformation related genes |
| Identification of chemicals and drugs interact with genes involved in malignant transfromation |
| (DGIdb 4.0) |
| Entrez ID | Symbol | Category | Interaction Types | Drug Claim Name | Drug Name | PMIDs |
| Page: 1 |

Copyright 2023-Present -The University of Texas Health Science Center at Houston |