
|
|||||
|
 | |
| |
| |
| |
| |
| |
|
Gene: KIF14 |
Gene summary for KIF14 |
| Gene information | Species | Human | Gene symbol | KIF14 | Gene ID | 9928 |
| Gene name | kinesin family member 14 | |
| Gene Alias | MCPH20 | |
| Cytomap | 1q32.1 | |
| Gene Type | protein-coding | GO ID | GO:0000070 | UniProtAcc | Q15058 |
Top |
Malignant transformation analysis |
| Identification of the aberrant gene expression in precancerous and cancerous lesions by comparing the gene expression of stem-like cells in diseased tissues with normal stem cells |
| Entrez ID | Symbol | Replicates | Species | Organ | Tissue | Adj P-value | Log2FC | Malignancy |
| 9928 | KIF14 | LZE2T | Human | Esophagus | ESCC | 4.73e-03 | 4.63e-01 | 0.082 |
| 9928 | KIF14 | LZE7T | Human | Esophagus | ESCC | 1.02e-03 | 2.11e-01 | 0.0667 |
| 9928 | KIF14 | P1T-E | Human | Esophagus | ESCC | 7.11e-04 | 3.96e-01 | 0.0875 |
| 9928 | KIF14 | P2T-E | Human | Esophagus | ESCC | 9.35e-10 | 3.64e-01 | 0.1177 |
| 9928 | KIF14 | P4T-E | Human | Esophagus | ESCC | 1.78e-10 | 3.32e-01 | 0.1323 |
| 9928 | KIF14 | P5T-E | Human | Esophagus | ESCC | 5.79e-16 | 6.76e-01 | 0.1327 |
| 9928 | KIF14 | P9T-E | Human | Esophagus | ESCC | 1.88e-05 | 1.93e-01 | 0.1131 |
| 9928 | KIF14 | P10T-E | Human | Esophagus | ESCC | 2.02e-06 | 2.66e-01 | 0.116 |
| 9928 | KIF14 | P15T-E | Human | Esophagus | ESCC | 2.11e-03 | 1.50e-01 | 0.1149 |
| 9928 | KIF14 | P16T-E | Human | Esophagus | ESCC | 8.40e-04 | 1.53e-01 | 0.1153 |
| 9928 | KIF14 | P20T-E | Human | Esophagus | ESCC | 3.97e-02 | 1.63e-01 | 0.1124 |
| 9928 | KIF14 | P21T-E | Human | Esophagus | ESCC | 3.89e-12 | 3.90e-01 | 0.1617 |
| 9928 | KIF14 | P22T-E | Human | Esophagus | ESCC | 4.17e-05 | 2.55e-01 | 0.1236 |
| 9928 | KIF14 | P24T-E | Human | Esophagus | ESCC | 1.66e-02 | 1.60e-01 | 0.1287 |
| 9928 | KIF14 | P26T-E | Human | Esophagus | ESCC | 9.20e-06 | 2.34e-01 | 0.1276 |
| 9928 | KIF14 | P28T-E | Human | Esophagus | ESCC | 4.44e-08 | 2.97e-01 | 0.1149 |
| 9928 | KIF14 | P31T-E | Human | Esophagus | ESCC | 8.40e-04 | 1.96e-01 | 0.1251 |
| 9928 | KIF14 | P32T-E | Human | Esophagus | ESCC | 1.97e-10 | 2.73e-01 | 0.1666 |
| 9928 | KIF14 | P37T-E | Human | Esophagus | ESCC | 1.42e-10 | 3.14e-01 | 0.1371 |
| 9928 | KIF14 | P42T-E | Human | Esophagus | ESCC | 9.05e-04 | 2.08e-01 | 0.1175 |
| Page: 1 2 3 |
| Tissue | Expression Dynamics | Abbreviation |
| Esophagus | 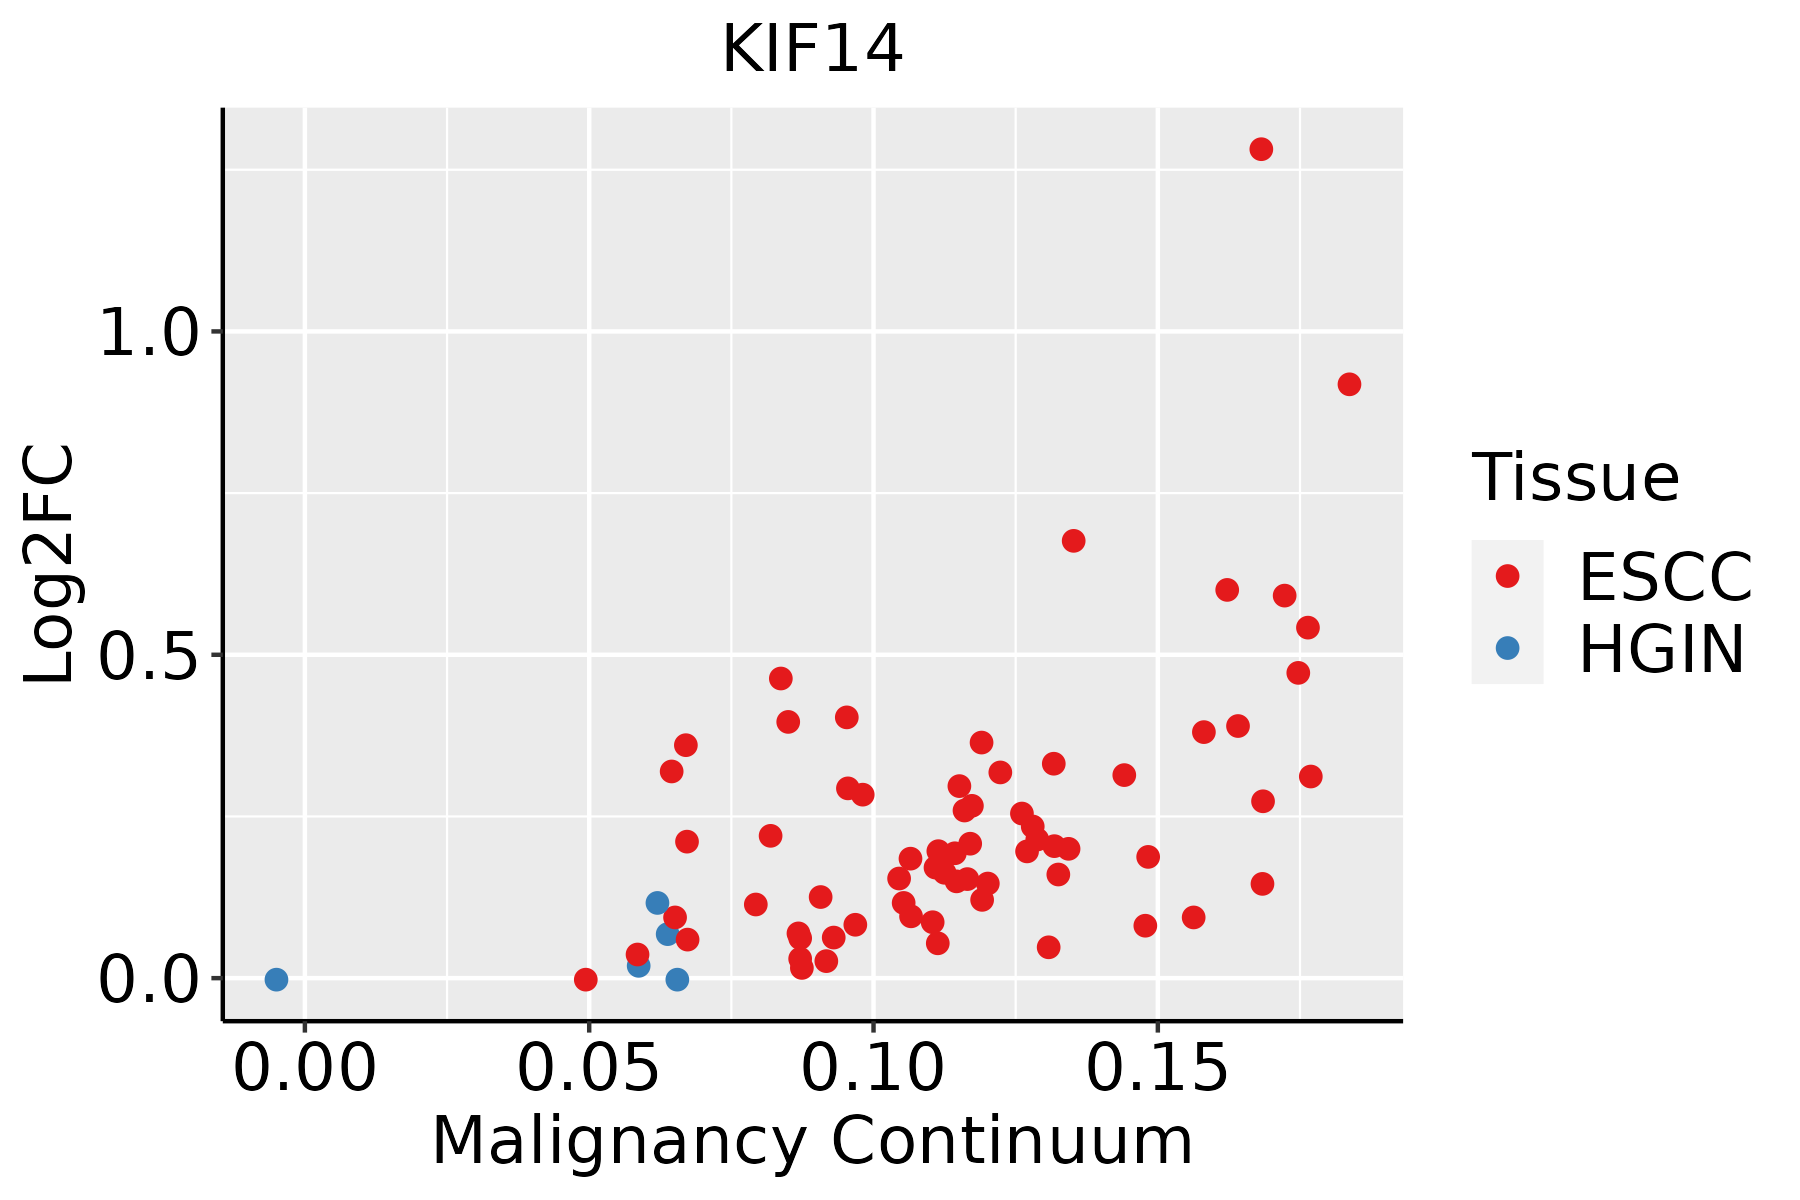 | ESCC: Esophageal squamous cell carcinoma |
| HGIN: High-grade intraepithelial neoplasias | ||
| LGIN: Low-grade intraepithelial neoplasias | ||
| Liver | 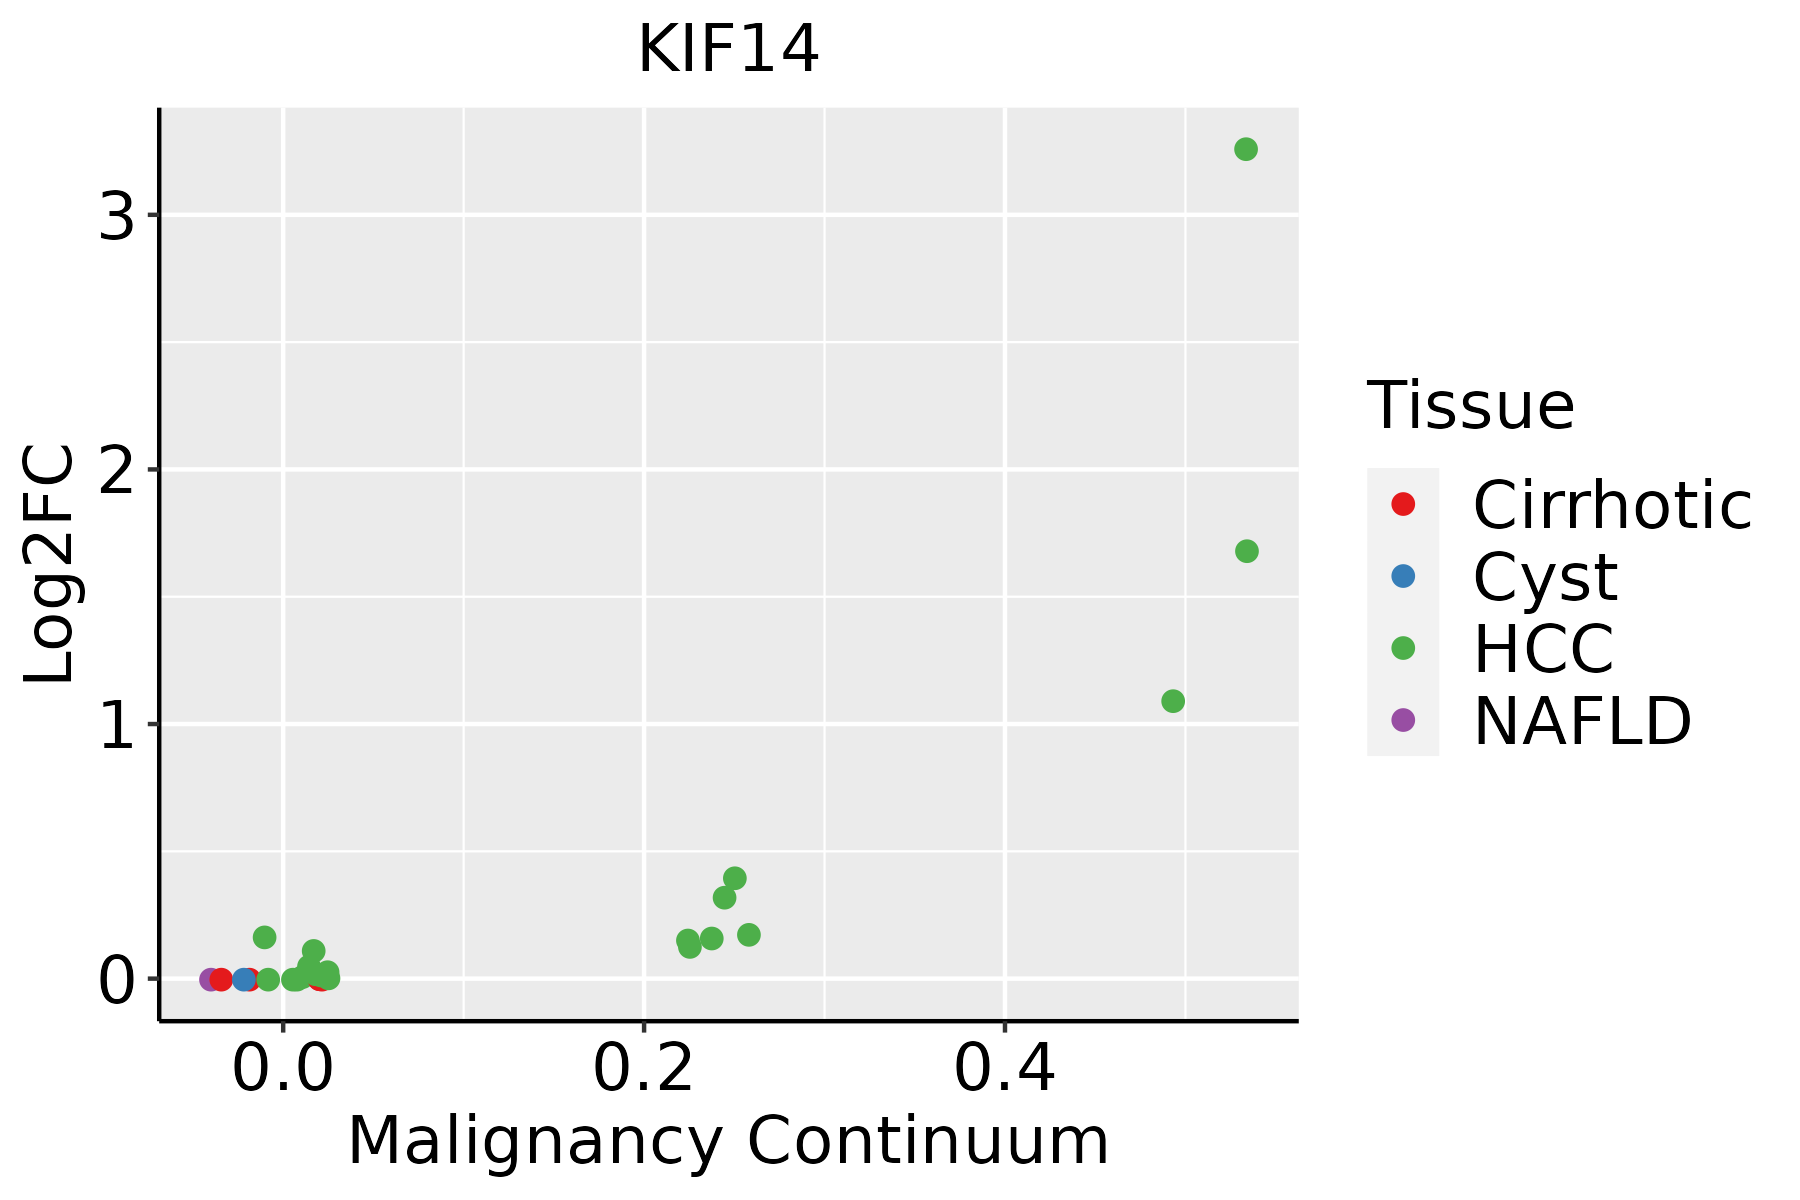 | HCC: Hepatocellular carcinoma |
| NAFLD: Non-alcoholic fatty liver disease | ||
| Thyroid | 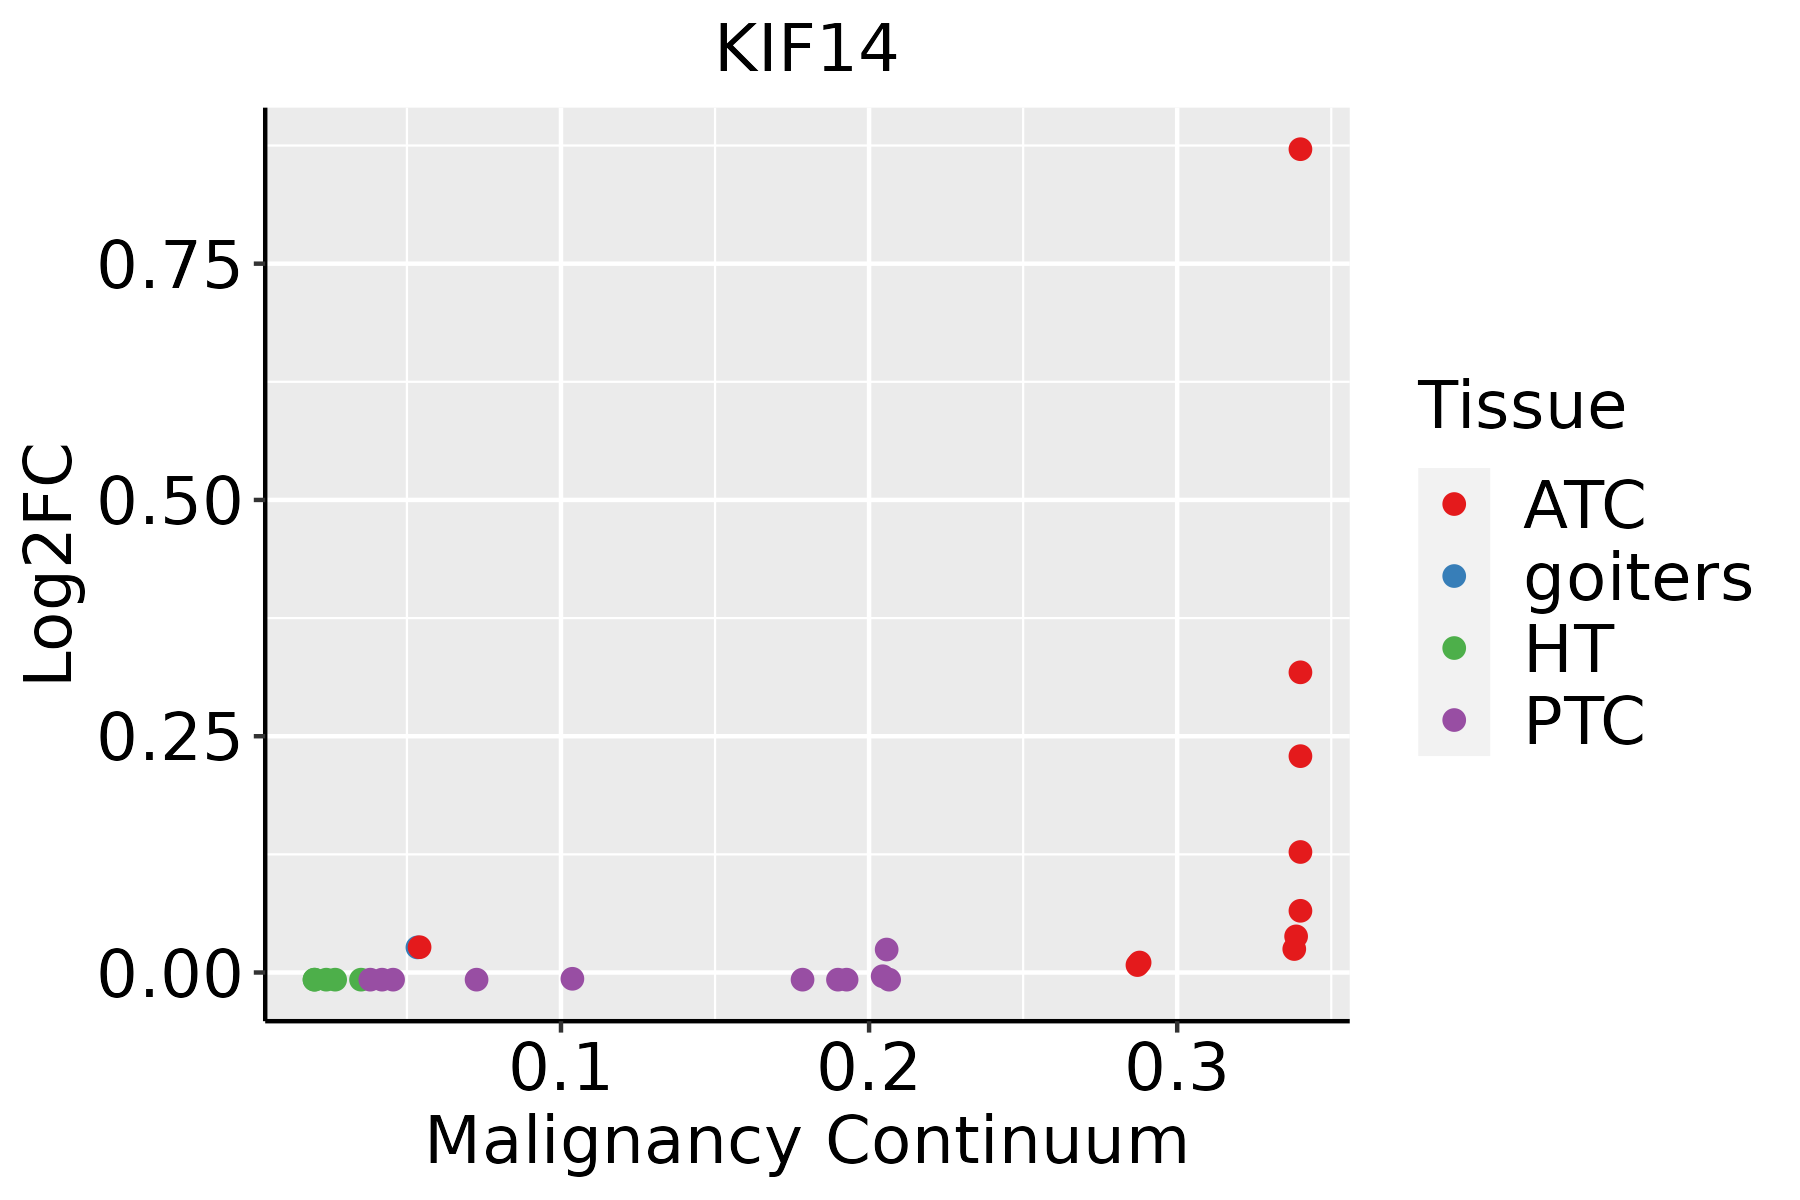 | ATC: Anaplastic thyroid cancer |
| HT: Hashimoto's thyroiditis | ||
| PTC: Papillary thyroid cancer |
| ∗log2FC in expression of this searched gene in stem-like cells from each diseased tissue sample relative to stem-like cells in normal samples in each tissue plotted against the malignancy continuum. Samples are colored based on if they are from different disease stage. |
Top |
Malignant transformation related pathway analysis |
| Find out the enriched GO biological processes and KEGG pathways involved in transition from healthy to precancer to cancer |
| Tissue | Disease Stage | Enriched GO biological Processes |
| Colorectum | AD |  |
| Colorectum | SER |  |
| Colorectum | MSS |  |
| Colorectum | MSI-H |  |
| Colorectum | FAP |  |
| ∗Top 15 enriched GO BP terms are showed in the bar plot of each disease state in each tissue. Each row represents a significant GO biological process which is colored according to the -log10(p.adjust). |
| Page: 1 2 3 4 5 6 7 8 9 |
| GO ID | Tissue | Disease Stage | Description | Gene Ratio | Bg Ratio | pvalue | p.adjust | Count |
| GO:0010498111 | Esophagus | ESCC | proteasomal protein catabolic process | 369/8552 | 490/18723 | 1.13e-41 | 1.80e-38 | 369 |
| GO:0043161111 | Esophagus | ESCC | proteasome-mediated ubiquitin-dependent protein catabolic process | 312/8552 | 412/18723 | 3.53e-36 | 4.48e-33 | 312 |
| GO:014001414 | Esophagus | ESCC | mitotic nuclear division | 218/8552 | 287/18723 | 6.17e-26 | 1.78e-23 | 218 |
| GO:005165617 | Esophagus | ESCC | establishment of organelle localization | 273/8552 | 390/18723 | 9.13e-23 | 1.81e-20 | 273 |
| GO:000007011 | Esophagus | ESCC | mitotic sister chromatid segregation | 138/8552 | 168/18723 | 1.37e-22 | 2.63e-20 | 138 |
| GO:00008194 | Esophagus | ESCC | sister chromatid segregation | 157/8552 | 202/18723 | 8.41e-21 | 1.33e-18 | 157 |
| GO:000705911 | Esophagus | ESCC | chromosome segregation | 238/8552 | 346/18723 | 1.72e-18 | 1.82e-16 | 238 |
| GO:004477216 | Esophagus | ESCC | mitotic cell cycle phase transition | 281/8552 | 424/18723 | 4.63e-18 | 4.45e-16 | 281 |
| GO:0043254111 | Esophagus | ESCC | regulation of protein-containing complex assembly | 278/8552 | 428/18723 | 3.81e-16 | 2.77e-14 | 278 |
| GO:000734615 | Esophagus | ESCC | regulation of mitotic cell cycle | 293/8552 | 457/18723 | 8.00e-16 | 5.64e-14 | 293 |
| GO:005131011 | Esophagus | ESCC | metaphase plate congression | 58/8552 | 65/18723 | 1.81e-13 | 8.63e-12 | 58 |
| GO:000708011 | Esophagus | ESCC | mitotic metaphase plate congression | 47/8552 | 50/18723 | 3.15e-13 | 1.47e-11 | 47 |
| GO:00482853 | Esophagus | ESCC | organelle fission | 301/8552 | 488/18723 | 4.64e-13 | 2.12e-11 | 301 |
| GO:00988133 | Esophagus | ESCC | nuclear chromosome segregation | 187/8552 | 281/18723 | 1.00e-12 | 4.36e-11 | 187 |
| GO:005130311 | Esophagus | ESCC | establishment of chromosome localization | 67/8552 | 80/18723 | 1.92e-12 | 8.09e-11 | 67 |
| GO:005000011 | Esophagus | ESCC | chromosome localization | 68/8552 | 82/18723 | 3.37e-12 | 1.32e-10 | 68 |
| GO:00002802 | Esophagus | ESCC | nuclear division | 270/8552 | 439/18723 | 1.17e-11 | 4.24e-10 | 270 |
| GO:190198713 | Esophagus | ESCC | regulation of cell cycle phase transition | 242/8552 | 390/18723 | 3.86e-11 | 1.26e-09 | 242 |
| GO:0016049110 | Esophagus | ESCC | cell growth | 289/8552 | 482/18723 | 1.29e-10 | 3.77e-09 | 289 |
| GO:190199013 | Esophagus | ESCC | regulation of mitotic cell cycle phase transition | 191/8552 | 299/18723 | 1.35e-10 | 3.94e-09 | 191 |
| Page: 1 2 3 4 5 6 7 8 9 |
| Pathway ID | Tissue | Disease Stage | Description | Gene Ratio | Bg Ratio | pvalue | p.adjust | qvalue | Count |
| Page: 1 |
Top |
Cell-cell communication analysis |
| Identification of potential cell-cell interactions between two cell types and their ligand-receptor pairs for different disease states |
| Ligand | Receptor | LRpair | Pathway | Tissue | Disease Stage |
| Page: 1 |
Top |
Single-cell gene regulatory network inference analysis |
| Find out the significant the regulons (TFs) and the target genes of each regulon across cell types for different disease states |
| TF | Cell Type | Tissue | Disease Stage | Target Gene | RSS | Regulon Activity |
| ∗The dot plots of a searched regulon are shown for all cell subpopulations in each disease state of each tissue based on the regulon specific score inferred using pySCENIC and by calculating the average expression. |
| Page: 1 |
Top |
Somatic mutation of malignant transformation related genes |
| Annotation of somatic variants for genes involved in malignant transformation |
| Hugo Symbol | Variant Class | Variant Classification | dbSNP RS | HGVSc | HGVSp | HGVSp Short | SWISSPROT | BIOTYPE | SIFT | PolyPhen | Tumor Sample Barcode | Tissue | Histology | Sex | Age | Stage | Therapy Types | Drugs | Outcome |
| KIF14 | SNV | Missense_Mutation | c.3016C>T | p.His1006Tyr | p.H1006Y | Q15058 | protein_coding | tolerated(0.44) | benign(0.177) | TCGA-A2-A0CX-01 | Breast | breast invasive carcinoma | Female | <65 | I/II | Chemotherapy | adriamycin | SD | |
| KIF14 | SNV | Missense_Mutation | c.4912G>A | p.Glu1638Lys | p.E1638K | Q15058 | protein_coding | tolerated(0.65) | benign(0.006) | TCGA-AC-A23H-01 | Breast | breast invasive carcinoma | Female | >=65 | I/II | Unknown | Unknown | PD | |
| KIF14 | SNV | Missense_Mutation | novel | c.964C>A | p.Leu322Ile | p.L322I | Q15058 | protein_coding | tolerated(0.28) | benign(0.003) | TCGA-AN-A046-01 | Breast | breast invasive carcinoma | Female | >=65 | I/II | Unknown | Unknown | SD |
| KIF14 | SNV | Missense_Mutation | c.901N>G | p.Pro301Ala | p.P301A | Q15058 | protein_coding | tolerated(0.95) | benign(0) | TCGA-BH-A0DZ-01 | Breast | breast invasive carcinoma | Female | <65 | I/II | Chemotherapy | docetaxel | SD | |
| KIF14 | SNV | Missense_Mutation | c.391N>A | p.Glu131Lys | p.E131K | Q15058 | protein_coding | deleterious(0.02) | benign(0.326) | TCGA-BH-A0HF-01 | Breast | breast invasive carcinoma | Female | >=65 | I/II | Hormone Therapy | arimidex | SD | |
| KIF14 | SNV | Missense_Mutation | novel | c.4456N>A | p.Glu1486Lys | p.E1486K | Q15058 | protein_coding | tolerated(0.06) | benign(0.005) | TCGA-BH-A2L8-01 | Breast | breast invasive carcinoma | Female | <65 | I/II | Chemotherapy | cytoxan | CR |
| KIF14 | SNV | Missense_Mutation | c.2344N>G | p.Gln782Glu | p.Q782E | Q15058 | protein_coding | tolerated(1) | benign(0.003) | TCGA-BH-A2L8-01 | Breast | breast invasive carcinoma | Female | <65 | I/II | Chemotherapy | cytoxan | CR | |
| KIF14 | SNV | Missense_Mutation | c.1349G>T | p.Gly450Val | p.G450V | Q15058 | protein_coding | deleterious(0) | probably_damaging(1) | TCGA-D8-A1JE-01 | Breast | breast invasive carcinoma | Female | <65 | I/II | Chemotherapy | adriamicin | SD | |
| KIF14 | SNV | Missense_Mutation | c.1139N>C | p.Val380Ala | p.V380A | Q15058 | protein_coding | tolerated(0.07) | benign(0.19) | TCGA-D8-A1XK-01 | Breast | breast invasive carcinoma | Female | <65 | I/II | Chemotherapy | doxorubicine+cyclophosphamide | SD | |
| KIF14 | SNV | Missense_Mutation | novel | c.4456N>A | p.Glu1486Lys | p.E1486K | Q15058 | protein_coding | tolerated(0.06) | benign(0.005) | TCGA-D8-A73U-01 | Breast | breast invasive carcinoma | Female | >=65 | I/II | Hormone Therapy | tamoxiphen | SD |
| Page: 1 2 3 4 5 6 7 8 9 10 11 12 13 14 15 16 17 18 19 |
Top |
Related drugs of malignant transformation related genes |
| Identification of chemicals and drugs interact with genes involved in malignant transfromation |
| (DGIdb 4.0) |
| Entrez ID | Symbol | Category | Interaction Types | Drug Claim Name | Drug Name | PMIDs |
| Page: 1 |

Copyright 2023-Present -The University of Texas Health Science Center at Houston |