
|
|||||
|
 | |
| |
| |
| |
| |
| |
|
Gene: KIF11 |
Gene summary for KIF11 |
| Gene information | Species | Human | Gene symbol | KIF11 | Gene ID | 3832 |
| Gene name | kinesin family member 11 | |
| Gene Alias | EG5 | |
| Cytomap | 10q23.33 | |
| Gene Type | protein-coding | GO ID | GO:0000226 | UniProtAcc | P52732 |
Top |
Malignant transformation analysis |
| Identification of the aberrant gene expression in precancerous and cancerous lesions by comparing the gene expression of stem-like cells in diseased tissues with normal stem cells |
| Entrez ID | Symbol | Replicates | Species | Organ | Tissue | Adj P-value | Log2FC | Malignancy |
| 3832 | KIF11 | LZE2T | Human | Esophagus | ESCC | 4.73e-03 | 4.64e-01 | 0.082 |
| 3832 | KIF11 | LZE4T | Human | Esophagus | ESCC | 2.37e-02 | 1.80e-01 | 0.0811 |
| 3832 | KIF11 | P2T-E | Human | Esophagus | ESCC | 7.29e-04 | 2.06e-01 | 0.1177 |
| 3832 | KIF11 | P4T-E | Human | Esophagus | ESCC | 8.00e-03 | 1.34e-01 | 0.1323 |
| 3832 | KIF11 | P5T-E | Human | Esophagus | ESCC | 3.93e-02 | 1.25e-01 | 0.1327 |
| 3832 | KIF11 | P15T-E | Human | Esophagus | ESCC | 2.11e-03 | 1.38e-01 | 0.1149 |
| 3832 | KIF11 | P17T-E | Human | Esophagus | ESCC | 1.49e-02 | 2.04e-01 | 0.1278 |
| 3832 | KIF11 | P19T-E | Human | Esophagus | ESCC | 7.48e-03 | 2.48e-01 | 0.1662 |
| 3832 | KIF11 | P21T-E | Human | Esophagus | ESCC | 1.23e-02 | 5.71e-02 | 0.1617 |
| 3832 | KIF11 | P28T-E | Human | Esophagus | ESCC | 1.69e-03 | 1.26e-01 | 0.1149 |
| 3832 | KIF11 | P37T-E | Human | Esophagus | ESCC | 3.53e-03 | 1.06e-01 | 0.1371 |
| 3832 | KIF11 | P49T-E | Human | Esophagus | ESCC | 5.57e-05 | 3.73e-01 | 0.1768 |
| 3832 | KIF11 | P62T-E | Human | Esophagus | ESCC | 1.21e-03 | 1.49e-01 | 0.1302 |
| 3832 | KIF11 | P76T-E | Human | Esophagus | ESCC | 3.51e-03 | 1.46e-01 | 0.1207 |
| 3832 | KIF11 | P83T-E | Human | Esophagus | ESCC | 1.35e-05 | 2.03e-01 | 0.1738 |
| 3832 | KIF11 | P89T-E | Human | Esophagus | ESCC | 6.02e-08 | 5.21e-01 | 0.1752 |
| 3832 | KIF11 | P91T-E | Human | Esophagus | ESCC | 3.13e-07 | 6.82e-01 | 0.1828 |
| 3832 | KIF11 | P107T-E | Human | Esophagus | ESCC | 2.08e-09 | 2.98e-01 | 0.171 |
| 3832 | KIF11 | P130T-E | Human | Esophagus | ESCC | 6.46e-14 | 4.68e-01 | 0.1676 |
| 3832 | KIF11 | HCC1_Meng | Human | Liver | HCC | 6.78e-18 | 2.38e-02 | 0.0246 |
| Page: 1 2 |
| Tissue | Expression Dynamics | Abbreviation |
| Esophagus |  | ESCC: Esophageal squamous cell carcinoma |
| HGIN: High-grade intraepithelial neoplasias | ||
| LGIN: Low-grade intraepithelial neoplasias | ||
| Liver | 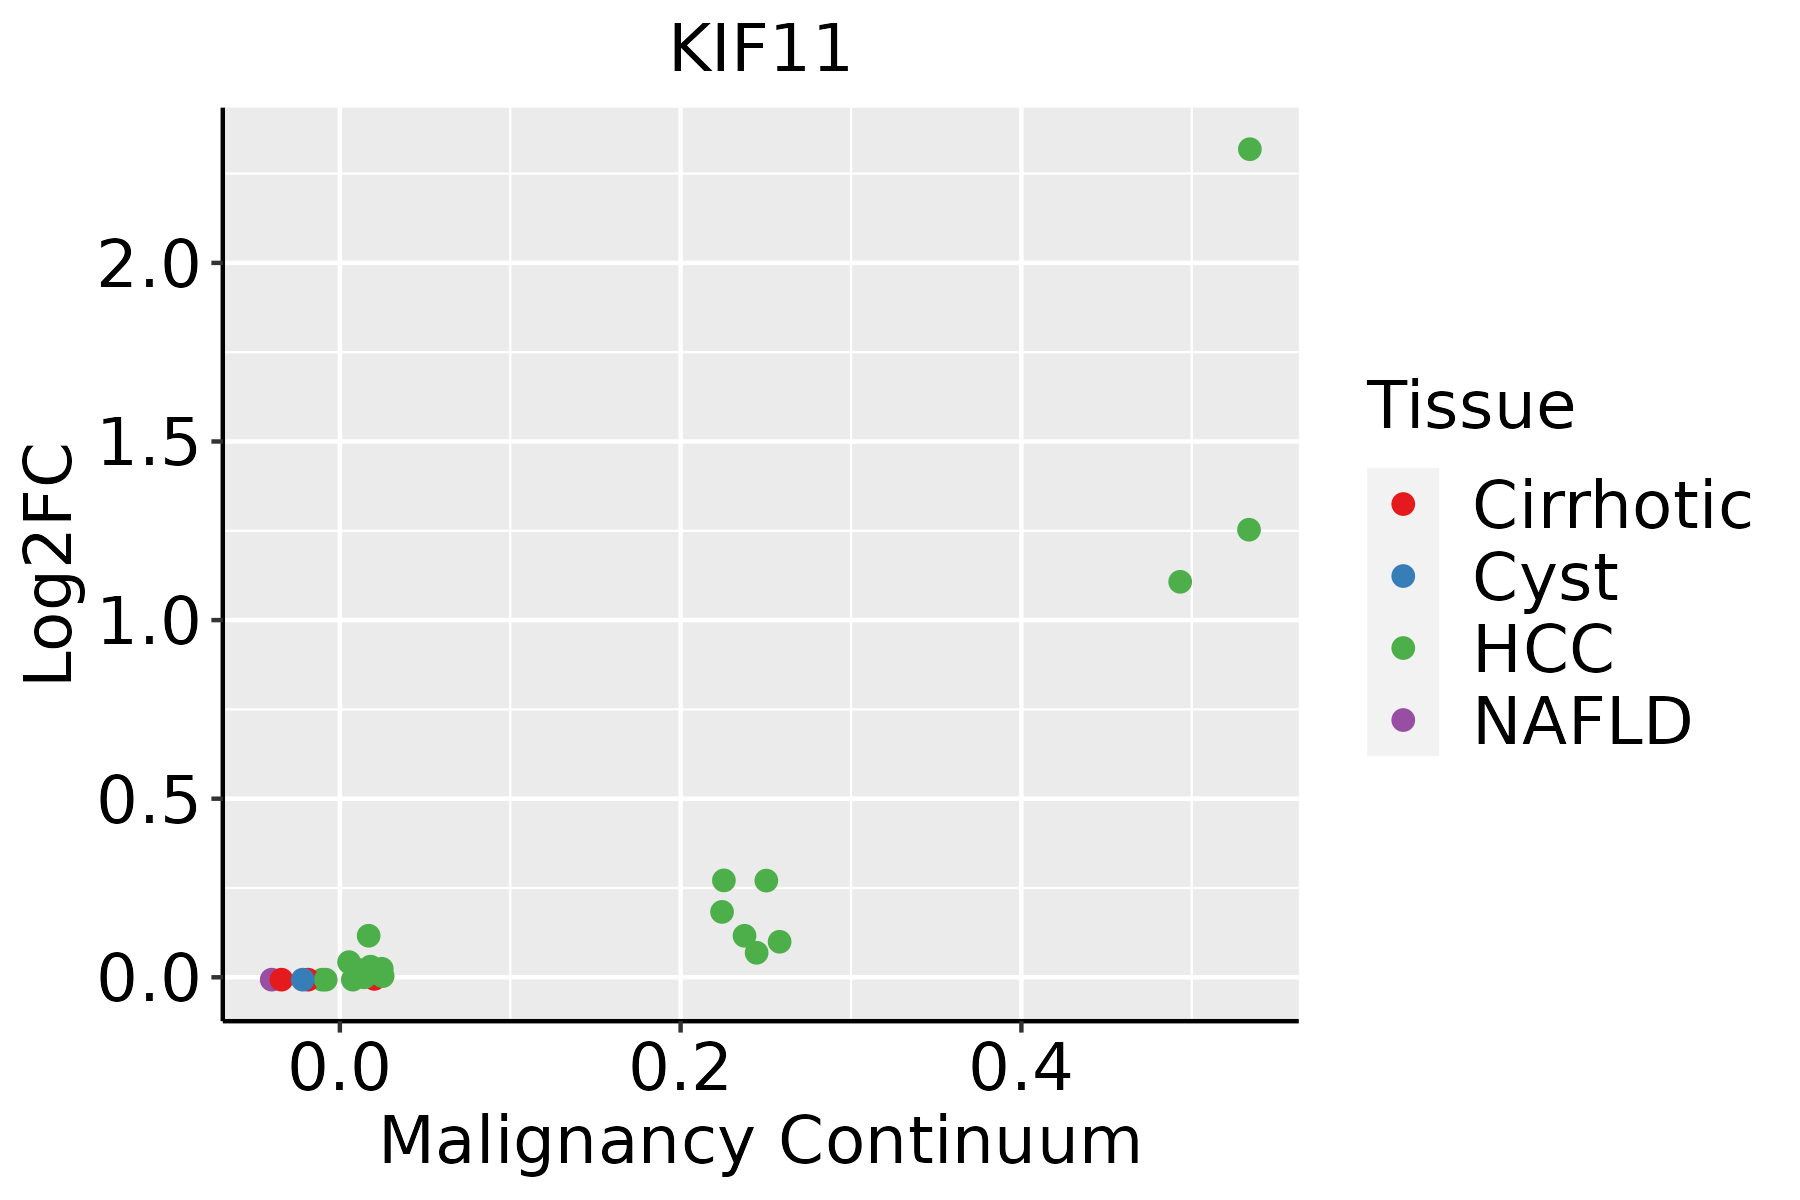 | HCC: Hepatocellular carcinoma |
| NAFLD: Non-alcoholic fatty liver disease |
| ∗log2FC in expression of this searched gene in stem-like cells from each diseased tissue sample relative to stem-like cells in normal samples in each tissue plotted against the malignancy continuum. Samples are colored based on if they are from different disease stage. |
Top |
Malignant transformation related pathway analysis |
| Find out the enriched GO biological processes and KEGG pathways involved in transition from healthy to precancer to cancer |
| Tissue | Disease Stage | Enriched GO biological Processes |
| Colorectum | AD |  |
| Colorectum | SER |  |
| Colorectum | MSS |  |
| Colorectum | MSI-H |  |
| Colorectum | FAP |  |
| ∗Top 15 enriched GO BP terms are showed in the bar plot of each disease state in each tissue. Each row represents a significant GO biological process which is colored according to the -log10(p.adjust). |
| Page: 1 2 3 4 5 6 7 8 9 |
| GO ID | Tissue | Disease Stage | Description | Gene Ratio | Bg Ratio | pvalue | p.adjust | Count |
| GO:014001414 | Esophagus | ESCC | mitotic nuclear division | 218/8552 | 287/18723 | 6.17e-26 | 1.78e-23 | 218 |
| GO:190285015 | Esophagus | ESCC | microtubule cytoskeleton organization involved in mitosis | 116/8552 | 147/18723 | 1.25e-16 | 9.91e-15 | 116 |
| GO:000705214 | Esophagus | ESCC | mitotic spindle organization | 97/8552 | 120/18723 | 2.17e-15 | 1.33e-13 | 97 |
| GO:000705114 | Esophagus | ESCC | spindle organization | 134/8552 | 184/18723 | 5.70e-14 | 2.87e-12 | 134 |
| GO:00482853 | Esophagus | ESCC | organelle fission | 301/8552 | 488/18723 | 4.64e-13 | 2.12e-11 | 301 |
| GO:00002802 | Esophagus | ESCC | nuclear division | 270/8552 | 439/18723 | 1.17e-11 | 4.24e-10 | 270 |
| GO:00512256 | Esophagus | ESCC | spindle assembly | 85/8552 | 117/18723 | 2.72e-09 | 5.98e-08 | 85 |
| GO:009030715 | Esophagus | ESCC | mitotic spindle assembly | 52/8552 | 65/18723 | 1.41e-08 | 2.77e-07 | 52 |
| GO:00070982 | Esophagus | ESCC | centrosome cycle | 85/8552 | 130/18723 | 4.41e-06 | 4.69e-05 | 85 |
| GO:00310233 | Esophagus | ESCC | microtubule organizing center organization | 92/8552 | 143/18723 | 5.04e-06 | 5.31e-05 | 92 |
| GO:0007100 | Esophagus | ESCC | mitotic centrosome separation | 12/8552 | 14/18723 | 2.51e-03 | 1.08e-02 | 12 |
| GO:0051299 | Esophagus | ESCC | centrosome separation | 12/8552 | 15/18723 | 7.31e-03 | 2.63e-02 | 12 |
| GO:014001411 | Liver | HCC | mitotic nuclear division | 174/7958 | 287/18723 | 3.74e-10 | 1.23e-08 | 174 |
| GO:000705111 | Liver | HCC | spindle organization | 116/7958 | 184/18723 | 1.40e-08 | 3.40e-07 | 116 |
| GO:000705211 | Liver | HCC | mitotic spindle organization | 80/7958 | 120/18723 | 7.43e-08 | 1.50e-06 | 80 |
| GO:190285011 | Liver | HCC | microtubule cytoskeleton organization involved in mitosis | 93/7958 | 147/18723 | 2.91e-07 | 5.09e-06 | 93 |
| GO:005122511 | Liver | HCC | spindle assembly | 75/7958 | 117/18723 | 1.92e-06 | 2.67e-05 | 75 |
| GO:0048285 | Liver | HCC | organelle fission | 254/7958 | 488/18723 | 1.07e-05 | 1.23e-04 | 254 |
| GO:0031023 | Liver | HCC | microtubule organizing center organization | 82/7958 | 143/18723 | 2.38e-04 | 1.79e-03 | 82 |
| GO:009030711 | Liver | HCC | mitotic spindle assembly | 42/7958 | 65/18723 | 2.63e-04 | 1.94e-03 | 42 |
| Page: 1 2 |
| Pathway ID | Tissue | Disease Stage | Description | Gene Ratio | Bg Ratio | pvalue | p.adjust | qvalue | Count |
| Page: 1 |
Top |
Cell-cell communication analysis |
| Identification of potential cell-cell interactions between two cell types and their ligand-receptor pairs for different disease states |
| Ligand | Receptor | LRpair | Pathway | Tissue | Disease Stage |
| Page: 1 |
Top |
Single-cell gene regulatory network inference analysis |
| Find out the significant the regulons (TFs) and the target genes of each regulon across cell types for different disease states |
| TF | Cell Type | Tissue | Disease Stage | Target Gene | RSS | Regulon Activity |
| ∗The dot plots of a searched regulon are shown for all cell subpopulations in each disease state of each tissue based on the regulon specific score inferred using pySCENIC and by calculating the average expression. |
| Page: 1 |
Top |
Somatic mutation of malignant transformation related genes |
| Annotation of somatic variants for genes involved in malignant transformation |
| Hugo Symbol | Variant Class | Variant Classification | dbSNP RS | HGVSc | HGVSp | HGVSp Short | SWISSPROT | BIOTYPE | SIFT | PolyPhen | Tumor Sample Barcode | Tissue | Histology | Sex | Age | Stage | Therapy Types | Drugs | Outcome |
| KIF11 | SNV | Missense_Mutation | novel | c.2491N>A | p.Glu831Lys | p.E831K | P52732 | protein_coding | tolerated(0.18) | benign(0.053) | TCGA-3C-AALI-01 | Breast | breast invasive carcinoma | Female | <65 | I/II | Unspecific | Poly E | Complete Response |
| KIF11 | SNV | Missense_Mutation | c.1798N>T | p.Val600Phe | p.V600F | P52732 | protein_coding | deleterious(0.01) | possibly_damaging(0.657) | TCGA-A2-A0CT-01 | Breast | breast invasive carcinoma | Female | >=65 | I/II | Chemotherapy | cytoxan | SD | |
| KIF11 | SNV | Missense_Mutation | c.1891G>A | p.Asp631Asn | p.D631N | P52732 | protein_coding | tolerated(0.12) | benign(0.006) | TCGA-AC-A23H-01 | Breast | breast invasive carcinoma | Female | >=65 | I/II | Unknown | Unknown | PD | |
| KIF11 | SNV | Missense_Mutation | novel | c.248N>A | p.Arg83Gln | p.R83Q | P52732 | protein_coding | deleterious(0) | possibly_damaging(0.669) | TCGA-AN-A046-01 | Breast | breast invasive carcinoma | Female | >=65 | I/II | Unknown | Unknown | SD |
| KIF11 | SNV | Missense_Mutation | c.175N>A | p.Asp59Asn | p.D59N | P52732 | protein_coding | deleterious(0) | possibly_damaging(0.612) | TCGA-BH-A0DZ-01 | Breast | breast invasive carcinoma | Female | <65 | I/II | Chemotherapy | docetaxel | SD | |
| KIF11 | SNV | Missense_Mutation | c.1288G>C | p.Glu430Gln | p.E430Q | P52732 | protein_coding | deleterious(0.01) | possibly_damaging(0.729) | TCGA-D8-A1J8-01 | Breast | breast invasive carcinoma | Female | >=65 | I/II | Hormone Therapy | nolvadex | SD | |
| KIF11 | SNV | Missense_Mutation | novel | c.1997N>G | p.Asp666Gly | p.D666G | P52732 | protein_coding | tolerated(0.14) | benign(0.003) | TCGA-LL-A8F5-01 | Breast | breast invasive carcinoma | Female | <65 | I/II | Chemotherapy | cyclophosphamide | SD |
| KIF11 | insertion | Frame_Shift_Ins | novel | c.2397_2398insCGTTT | p.His800ArgfsTer25 | p.H800Rfs*25 | P52732 | protein_coding | TCGA-A8-A09A-01 | Breast | breast invasive carcinoma | Female | <65 | I/II | Hormone Therapy | tamoxiphen | SD | ||
| KIF11 | insertion | Nonsense_Mutation | novel | c.2399_2400insTGAGCAAAGATGATC | p.His800_Ser801insGluGlnArgTerSer | p.H800_S801insEQR*S | P52732 | protein_coding | TCGA-A8-A09A-01 | Breast | breast invasive carcinoma | Female | <65 | I/II | Hormone Therapy | tamoxiphen | SD | ||
| KIF11 | SNV | Missense_Mutation | rs201047452 | c.1996N>A | p.Asp666Asn | p.D666N | P52732 | protein_coding | tolerated(0.26) | benign(0.006) | TCGA-C5-A1BQ-01 | Cervix | cervical & endocervical cancer | Female | >=65 | III/IV | Chemotherapy | cisplatin | CR |
| Page: 1 2 3 4 5 6 7 8 9 |
Top |
Related drugs of malignant transformation related genes |
| Identification of chemicals and drugs interact with genes involved in malignant transfromation |
| (DGIdb 4.0) |
| Entrez ID | Symbol | Category | Interaction Types | Drug Claim Name | Drug Name | PMIDs |
| 3832 | KIF11 | DRUGGABLE GENOME | ARQ-621 | |||
| 3832 | KIF11 | DRUGGABLE GENOME | Ispinesib | ISPINESIB | ||
| 3832 | KIF11 | DRUGGABLE GENOME | 4SC-205 | |||
| 3832 | KIF11 | DRUGGABLE GENOME | 4SC-205 | |||
| 3832 | KIF11 | DRUGGABLE GENOME | ARRY-520 | FILANESIB | ||
| 3832 | KIF11 | DRUGGABLE GENOME | inhibitor | 223366041 | AZD-4877 | |
| 3832 | KIF11 | DRUGGABLE GENOME | SB-743921 | SB-743921 | ||
| 3832 | KIF11 | DRUGGABLE GENOME | S-TRITYL-L-CYSTEINE | S-TRITYL-L-CYSTEINE | 22749640 | |
| 3832 | KIF11 | DRUGGABLE GENOME | NSC-123138 | CHEMBL409102 | 21344920 | |
| 3832 | KIF11 | DRUGGABLE GENOME | ARQ 621 |
| Page: 1 2 |

Copyright 2023-Present -The University of Texas Health Science Center at Houston |