
|
|||||
|
 | |
| |
| |
| |
| |
| |
|
Gene: KIAA1958 |
Gene summary for KIAA1958 |
| Gene information | Species | Human | Gene symbol | KIAA1958 | Gene ID | 158405 |
| Gene name | KIAA1958 | |
| Gene Alias | KIAA1958 | |
| Cytomap | 9q32 | |
| Gene Type | protein-coding | GO ID | GO:0003674 | UniProtAcc | Q8N8K9 |
Top |
Malignant transformation analysis |
| Identification of the aberrant gene expression in precancerous and cancerous lesions by comparing the gene expression of stem-like cells in diseased tissues with normal stem cells |
| Entrez ID | Symbol | Replicates | Species | Organ | Tissue | Adj P-value | Log2FC | Malignancy |
| 158405 | KIAA1958 | CCI_1 | Human | Cervix | CC | 7.04e-05 | 5.03e-01 | 0.528 |
| 158405 | KIAA1958 | CCI_2 | Human | Cervix | CC | 2.77e-08 | 6.53e-01 | 0.5249 |
| 158405 | KIAA1958 | CCI_3 | Human | Cervix | CC | 6.45e-11 | 6.76e-01 | 0.516 |
| 158405 | KIAA1958 | HTA11_3410_2000001011 | Human | Colorectum | AD | 1.45e-06 | -3.60e-01 | 0.0155 |
| 158405 | KIAA1958 | HTA11_866_2000001011 | Human | Colorectum | AD | 4.99e-03 | -3.10e-01 | -0.1001 |
| 158405 | KIAA1958 | HTA11_7696_3000711011 | Human | Colorectum | AD | 1.66e-04 | -3.58e-01 | 0.0674 |
| 158405 | KIAA1958 | HTA11_99999965062_69753 | Human | Colorectum | MSI-H | 2.11e-02 | 8.16e-01 | 0.3487 |
| 158405 | KIAA1958 | HTA11_99999974143_84620 | Human | Colorectum | MSS | 5.36e-07 | -3.14e-01 | 0.3005 |
| 158405 | KIAA1958 | A001-C-207 | Human | Colorectum | FAP | 4.08e-04 | -3.46e-01 | 0.1278 |
| 158405 | KIAA1958 | A015-C-203 | Human | Colorectum | FAP | 1.03e-18 | -4.39e-01 | -0.1294 |
| 158405 | KIAA1958 | A015-C-204 | Human | Colorectum | FAP | 4.52e-06 | -4.09e-01 | -0.0228 |
| 158405 | KIAA1958 | A014-C-040 | Human | Colorectum | FAP | 3.21e-03 | -4.97e-01 | -0.1184 |
| 158405 | KIAA1958 | A002-C-201 | Human | Colorectum | FAP | 3.27e-10 | -4.08e-01 | 0.0324 |
| 158405 | KIAA1958 | A002-C-203 | Human | Colorectum | FAP | 2.81e-03 | -2.62e-01 | 0.2786 |
| 158405 | KIAA1958 | A001-C-119 | Human | Colorectum | FAP | 2.60e-04 | -3.93e-01 | -0.1557 |
| 158405 | KIAA1958 | A001-C-108 | Human | Colorectum | FAP | 3.95e-13 | -3.77e-01 | -0.0272 |
| 158405 | KIAA1958 | A002-C-205 | Human | Colorectum | FAP | 1.83e-15 | -4.65e-01 | -0.1236 |
| 158405 | KIAA1958 | A001-C-104 | Human | Colorectum | FAP | 1.04e-03 | -3.38e-01 | 0.0184 |
| 158405 | KIAA1958 | A015-C-005 | Human | Colorectum | FAP | 2.10e-06 | -4.41e-01 | -0.0336 |
| 158405 | KIAA1958 | A015-C-006 | Human | Colorectum | FAP | 5.52e-10 | -4.45e-01 | -0.0994 |
| Page: 1 2 3 |
| Tissue | Expression Dynamics | Abbreviation |
| Cervix | 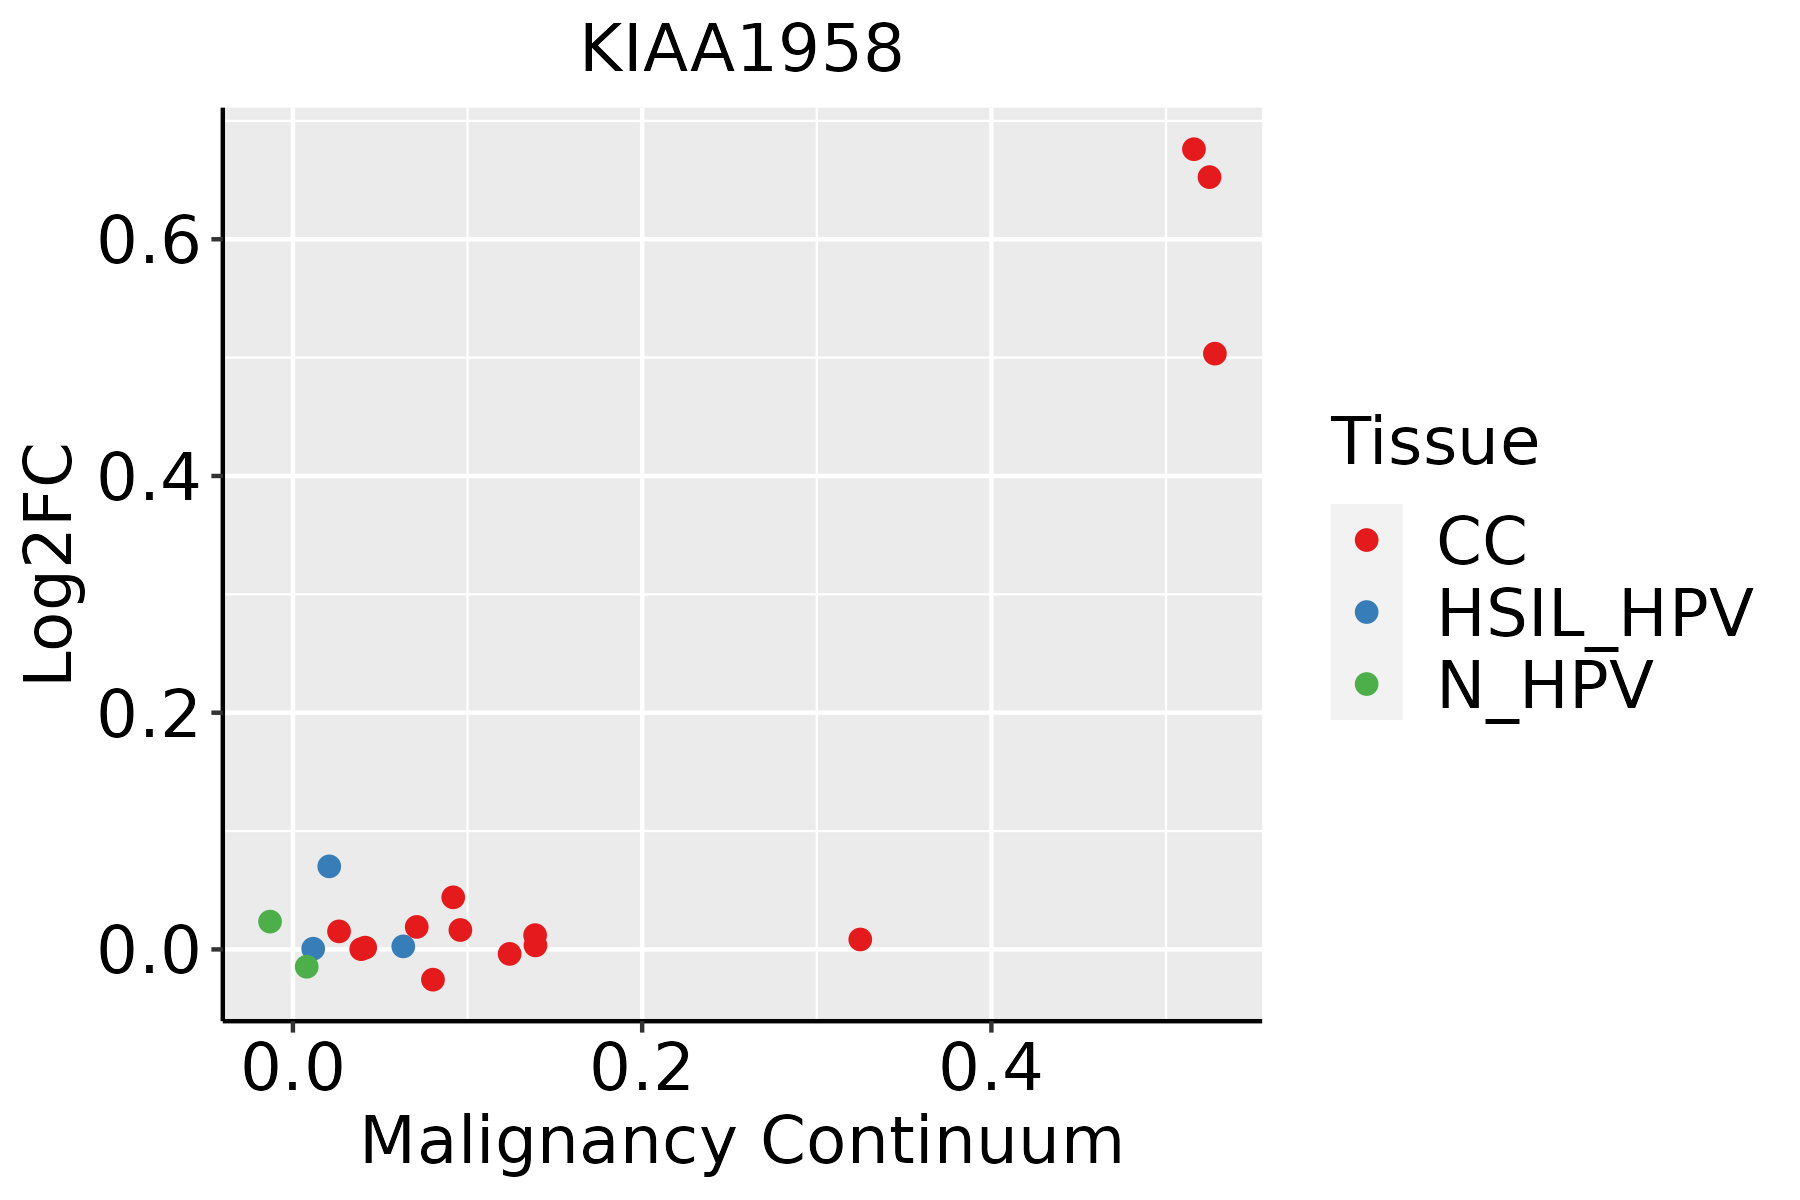 | CC: Cervix cancer |
| HSIL_HPV: HPV-infected high-grade squamous intraepithelial lesions | ||
| N_HPV: HPV-infected normal cervix | ||
| Colorectum (GSE201348) |  | FAP: Familial adenomatous polyposis |
| CRC: Colorectal cancer | ||
| Colorectum (HTA11) |  | AD: Adenomas |
| SER: Sessile serrated lesions | ||
| MSI-H: Microsatellite-high colorectal cancer | ||
| MSS: Microsatellite stable colorectal cancer | ||
| Liver | 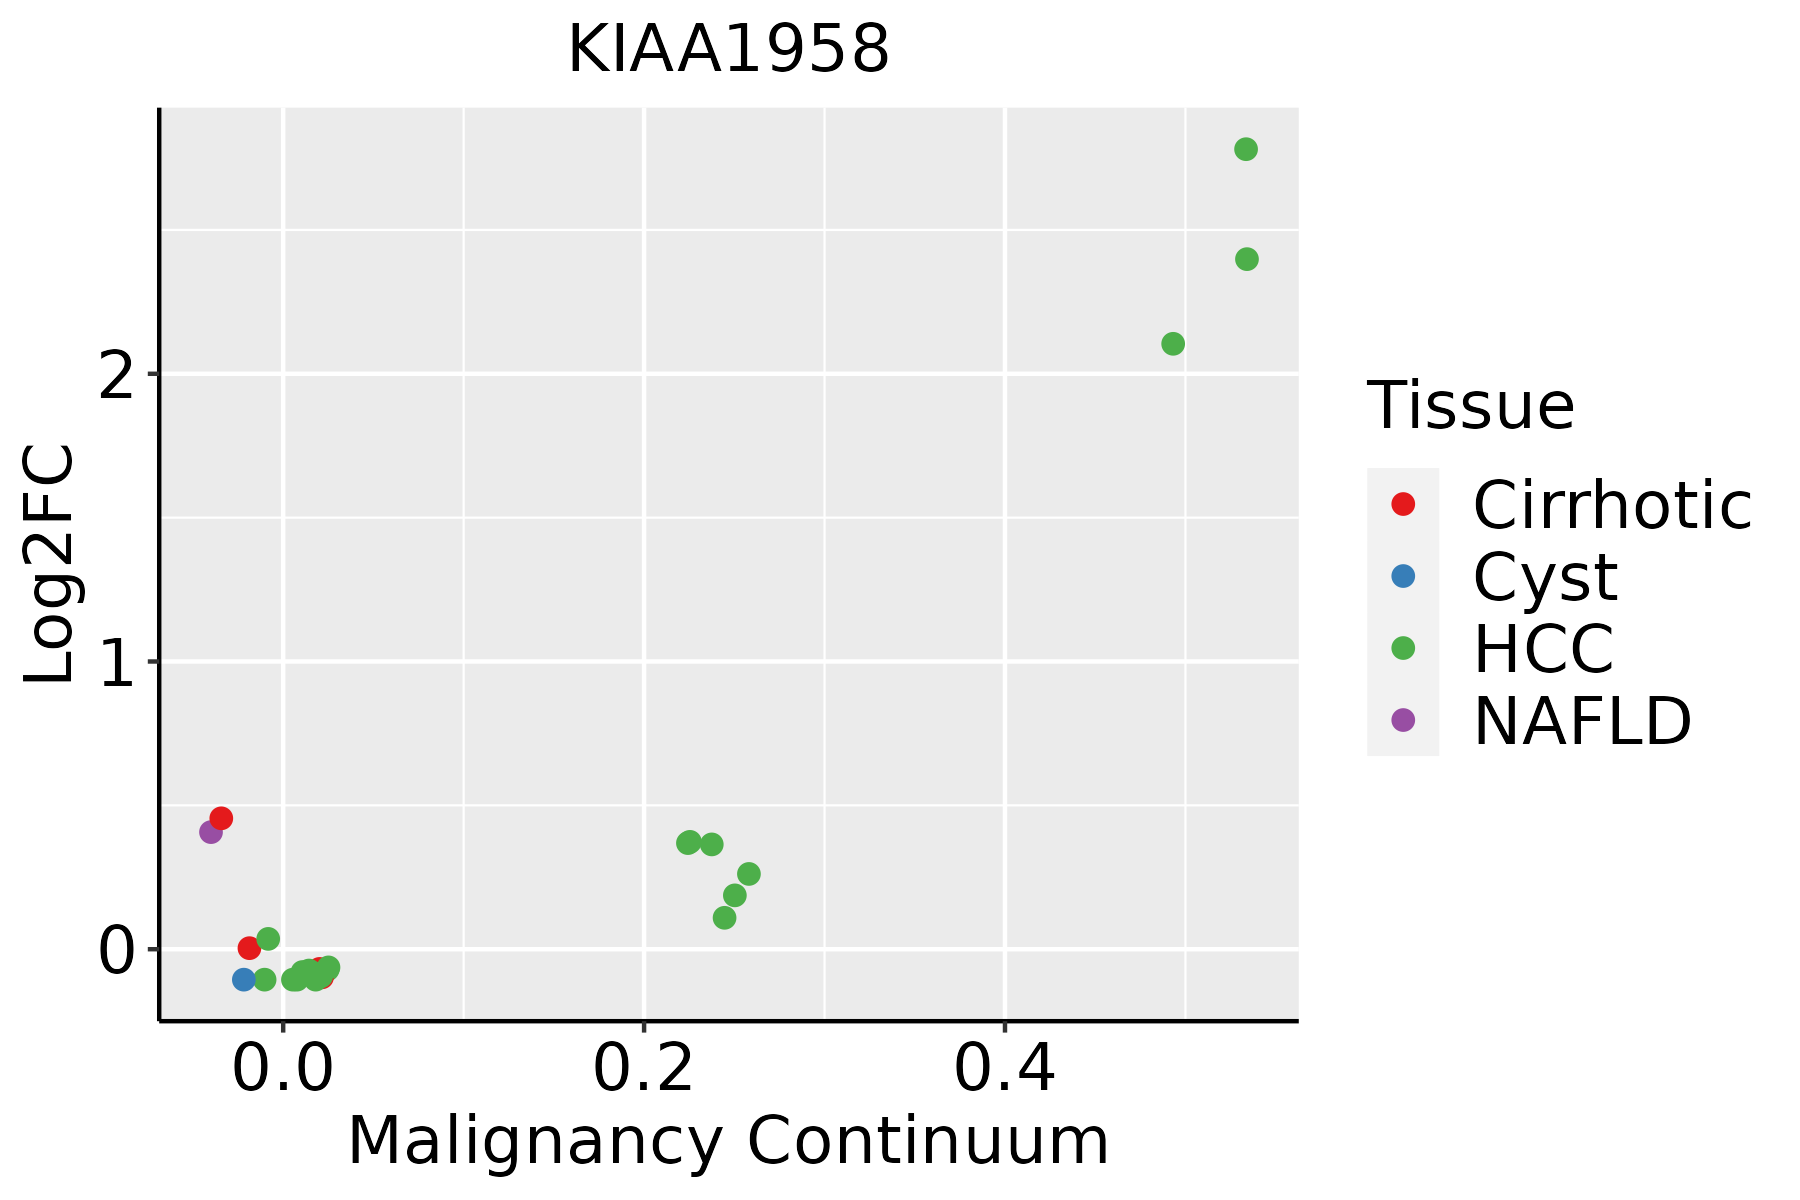 | HCC: Hepatocellular carcinoma |
| NAFLD: Non-alcoholic fatty liver disease | ||
| Lung | 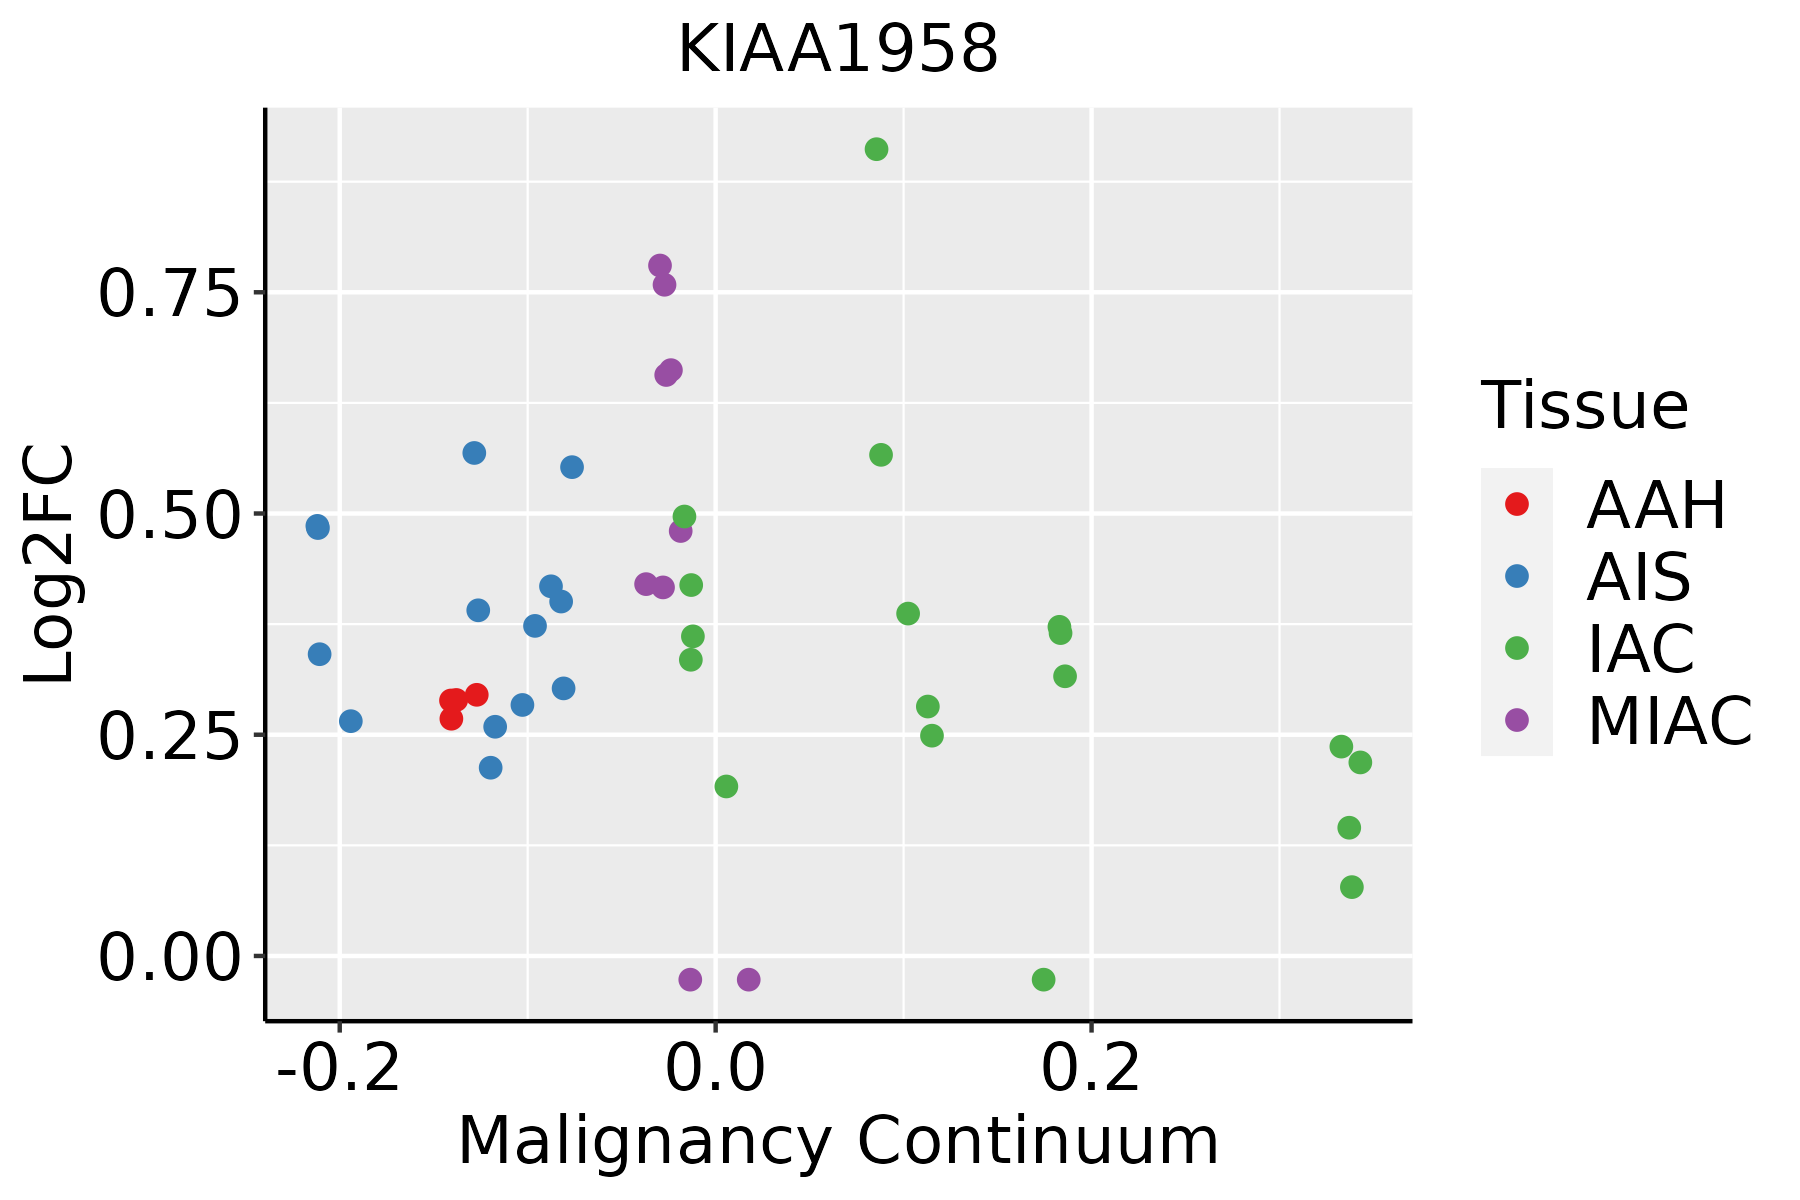 | AAH: Atypical adenomatous hyperplasia |
| AIS: Adenocarcinoma in situ | ||
| IAC: Invasive lung adenocarcinoma | ||
| MIA: Minimally invasive adenocarcinoma |
| ∗log2FC in expression of this searched gene in stem-like cells from each diseased tissue sample relative to stem-like cells in normal samples in each tissue plotted against the malignancy continuum. Samples are colored based on if they are from different disease stage. |
Top |
Malignant transformation related pathway analysis |
| Find out the enriched GO biological processes and KEGG pathways involved in transition from healthy to precancer to cancer |
| Tissue | Disease Stage | Enriched GO biological Processes |
| Colorectum | AD |  |
| Colorectum | SER |  |
| Colorectum | MSS |  |
| Colorectum | MSI-H |  |
| Colorectum | FAP |  |
| ∗Top 15 enriched GO BP terms are showed in the bar plot of each disease state in each tissue. Each row represents a significant GO biological process which is colored according to the -log10(p.adjust). |
| Page: 1 2 3 4 5 6 7 8 9 |
| GO ID | Tissue | Disease Stage | Description | Gene Ratio | Bg Ratio | pvalue | p.adjust | Count |
| Page: 1 |
| Pathway ID | Tissue | Disease Stage | Description | Gene Ratio | Bg Ratio | pvalue | p.adjust | qvalue | Count |
| Page: 1 |
Top |
Cell-cell communication analysis |
| Identification of potential cell-cell interactions between two cell types and their ligand-receptor pairs for different disease states |
| Ligand | Receptor | LRpair | Pathway | Tissue | Disease Stage |
| Page: 1 |
Top |
Single-cell gene regulatory network inference analysis |
| Find out the significant the regulons (TFs) and the target genes of each regulon across cell types for different disease states |
| TF | Cell Type | Tissue | Disease Stage | Target Gene | RSS | Regulon Activity |
| ∗The dot plots of a searched regulon are shown for all cell subpopulations in each disease state of each tissue based on the regulon specific score inferred using pySCENIC and by calculating the average expression. |
| Page: 1 |
Top |
Somatic mutation of malignant transformation related genes |
| Annotation of somatic variants for genes involved in malignant transformation |
| Hugo Symbol | Variant Class | Variant Classification | dbSNP RS | HGVSc | HGVSp | HGVSp Short | SWISSPROT | BIOTYPE | SIFT | PolyPhen | Tumor Sample Barcode | Tissue | Histology | Sex | Age | Stage | Therapy Types | Drugs | Outcome |
| KIAA1958 | SNV | Missense_Mutation | c.795N>A | p.Asp265Glu | p.D265E | Q8N8K9 | protein_coding | tolerated_low_confidence(0.48) | benign(0.011) | TCGA-A8-A07L-01 | Breast | breast invasive carcinoma | Female | <65 | III/IV | Chemotherapy | CR | ||
| KIAA1958 | SNV | Missense_Mutation | c.1300N>A | p.Asp434Asn | p.D434N | Q8N8K9 | protein_coding | tolerated_low_confidence(0.09) | probably_damaging(0.956) | TCGA-AC-A23H-01 | Breast | breast invasive carcinoma | Female | >=65 | I/II | Unknown | Unknown | PD | |
| KIAA1958 | SNV | Missense_Mutation | c.1301N>T | p.Asp434Val | p.D434V | Q8N8K9 | protein_coding | deleterious_low_confidence(0.01) | probably_damaging(0.987) | TCGA-AC-A23H-01 | Breast | breast invasive carcinoma | Female | >=65 | I/II | Unknown | Unknown | PD | |
| KIAA1958 | SNV | Missense_Mutation | rs772397775 | c.1357C>T | p.Arg453Trp | p.R453W | Q8N8K9 | protein_coding | deleterious(0.02) | possibly_damaging(0.543) | TCGA-AR-A2LR-01 | Breast | breast invasive carcinoma | Female | <65 | I/II | Chemotherapy | adriamycin | SD |
| KIAA1958 | SNV | Missense_Mutation | rs764255935 | c.1720T>G | p.Cys574Gly | p.C574G | Q8N8K9 | protein_coding | deleterious(0.04) | possibly_damaging(0.624) | TCGA-C8-A12K-01 | Breast | breast invasive carcinoma | Female | >=65 | I/II | Unknown | Unknown | SD |
| KIAA1958 | insertion | Nonsense_Mutation | novel | c.743_744insCCTCTGAACTGGATGAAACTGTTGAAGAATATGAA | p.Ser249LeufsTer2 | p.S249Lfs*2 | Q8N8K9 | protein_coding | TCGA-AN-A0FX-01 | Breast | breast invasive carcinoma | Female | <65 | I/II | Unknown | Unknown | SD | ||
| KIAA1958 | insertion | In_Frame_Ins | novel | c.1694_1695insGACTTCCTGGCCACCTCGCTCCATGCTATT | p.Asp565delinsGluThrSerTrpProProArgSerMetLeuPhe | p.D565delinsETSWPPRSMLF | Q8N8K9 | protein_coding | TCGA-BH-A0EB-01 | Breast | breast invasive carcinoma | Female | >=65 | I/II | Hormone Therapy | arimidex | SD | ||
| KIAA1958 | SNV | Missense_Mutation | rs145813879 | c.344N>A | p.Arg115Gln | p.R115Q | Q8N8K9 | protein_coding | tolerated_low_confidence(0.35) | benign(0.137) | TCGA-2W-A8YY-01 | Cervix | cervical & endocervical cancer | Female | <65 | I/II | Chemotherapy | cisplatin | CR |
| KIAA1958 | SNV | Missense_Mutation | rs562492705 | c.2203N>T | p.Arg735Trp | p.R735W | Q8N8K9 | protein_coding | deleterious_low_confidence(0) | possibly_damaging(0.789) | TCGA-2W-A8YY-01 | Cervix | cervical & endocervical cancer | Female | <65 | I/II | Chemotherapy | cisplatin | CR |
| KIAA1958 | SNV | Missense_Mutation | c.450N>T | p.Glu150Asp | p.E150D | Q8N8K9 | protein_coding | deleterious_low_confidence(0) | probably_damaging(0.978) | TCGA-C5-A1M5-01 | Cervix | cervical & endocervical cancer | Female | <65 | I/II | Unknown | Unknown | PD |
| Page: 1 2 3 4 5 6 7 8 9 |
Top |
Related drugs of malignant transformation related genes |
| Identification of chemicals and drugs interact with genes involved in malignant transfromation |
| (DGIdb 4.0) |
| Entrez ID | Symbol | Category | Interaction Types | Drug Claim Name | Drug Name | PMIDs |
| Page: 1 |

Copyright 2023-Present -The University of Texas Health Science Center at Houston |