
|
|||||
|
 | |
| |
| |
| |
| |
| |
|
Gene: KIAA1522 |
Gene summary for KIAA1522 |
| Gene information | Species | Human | Gene symbol | KIAA1522 | Gene ID | 57648 |
| Gene name | KIAA1522 | |
| Gene Alias | KIAA1522 | |
| Cytomap | 1p35.1 | |
| Gene Type | protein-coding | GO ID | GO:0008150 | UniProtAcc | Q9P206 |
Top |
Malignant transformation analysis |
| Identification of the aberrant gene expression in precancerous and cancerous lesions by comparing the gene expression of stem-like cells in diseased tissues with normal stem cells |
| Entrez ID | Symbol | Replicates | Species | Organ | Tissue | Adj P-value | Log2FC | Malignancy |
| 57648 | KIAA1522 | HTA11_3410_2000001011 | Human | Colorectum | AD | 7.18e-03 | 9.01e-02 | 0.0155 |
| 57648 | KIAA1522 | HTA11_2487_2000001011 | Human | Colorectum | SER | 3.68e-21 | 9.67e-01 | -0.1808 |
| 57648 | KIAA1522 | HTA11_1938_2000001011 | Human | Colorectum | AD | 3.34e-14 | 8.12e-01 | -0.0811 |
| 57648 | KIAA1522 | HTA11_78_2000001011 | Human | Colorectum | AD | 1.50e-09 | 7.06e-01 | -0.1088 |
| 57648 | KIAA1522 | HTA11_347_2000001011 | Human | Colorectum | AD | 1.38e-35 | 1.03e+00 | -0.1954 |
| 57648 | KIAA1522 | HTA11_411_2000001011 | Human | Colorectum | SER | 3.37e-10 | 1.50e+00 | -0.2602 |
| 57648 | KIAA1522 | HTA11_2112_2000001011 | Human | Colorectum | SER | 2.31e-07 | 1.13e+00 | -0.2196 |
| 57648 | KIAA1522 | HTA11_3361_2000001011 | Human | Colorectum | AD | 2.20e-05 | 5.72e-01 | -0.1207 |
| 57648 | KIAA1522 | HTA11_83_2000001011 | Human | Colorectum | SER | 2.32e-12 | 8.56e-01 | -0.1526 |
| 57648 | KIAA1522 | HTA11_696_2000001011 | Human | Colorectum | AD | 3.56e-22 | 9.31e-01 | -0.1464 |
| 57648 | KIAA1522 | HTA11_866_2000001011 | Human | Colorectum | AD | 1.19e-12 | 6.72e-01 | -0.1001 |
| 57648 | KIAA1522 | HTA11_1391_2000001011 | Human | Colorectum | AD | 2.78e-19 | 1.01e+00 | -0.059 |
| 57648 | KIAA1522 | HTA11_2992_2000001011 | Human | Colorectum | SER | 2.27e-07 | 9.26e-01 | -0.1706 |
| 57648 | KIAA1522 | HTA11_5216_2000001011 | Human | Colorectum | SER | 3.15e-02 | 5.92e-01 | -0.1462 |
| 57648 | KIAA1522 | HTA11_546_2000001011 | Human | Colorectum | AD | 5.06e-06 | 6.68e-01 | -0.0842 |
| 57648 | KIAA1522 | HTA11_7862_2000001011 | Human | Colorectum | AD | 1.83e-02 | 5.33e-01 | -0.0179 |
| 57648 | KIAA1522 | HTA11_866_3004761011 | Human | Colorectum | AD | 2.88e-05 | 4.08e-01 | 0.096 |
| 57648 | KIAA1522 | HTA11_7663_2000001011 | Human | Colorectum | SER | 1.51e-03 | 7.19e-01 | 0.0131 |
| 57648 | KIAA1522 | HTA11_10623_2000001011 | Human | Colorectum | AD | 3.75e-05 | 8.14e-01 | -0.0177 |
| 57648 | KIAA1522 | HTA11_6801_2000001011 | Human | Colorectum | SER | 1.20e-04 | 8.05e-01 | 0.0171 |
| Page: 1 2 3 4 5 6 7 8 |
| Tissue | Expression Dynamics | Abbreviation |
| Colorectum (GSE201348) |  | FAP: Familial adenomatous polyposis |
| CRC: Colorectal cancer | ||
| Colorectum (HTA11) |  | AD: Adenomas |
| SER: Sessile serrated lesions | ||
| MSI-H: Microsatellite-high colorectal cancer | ||
| MSS: Microsatellite stable colorectal cancer | ||
| Esophagus | 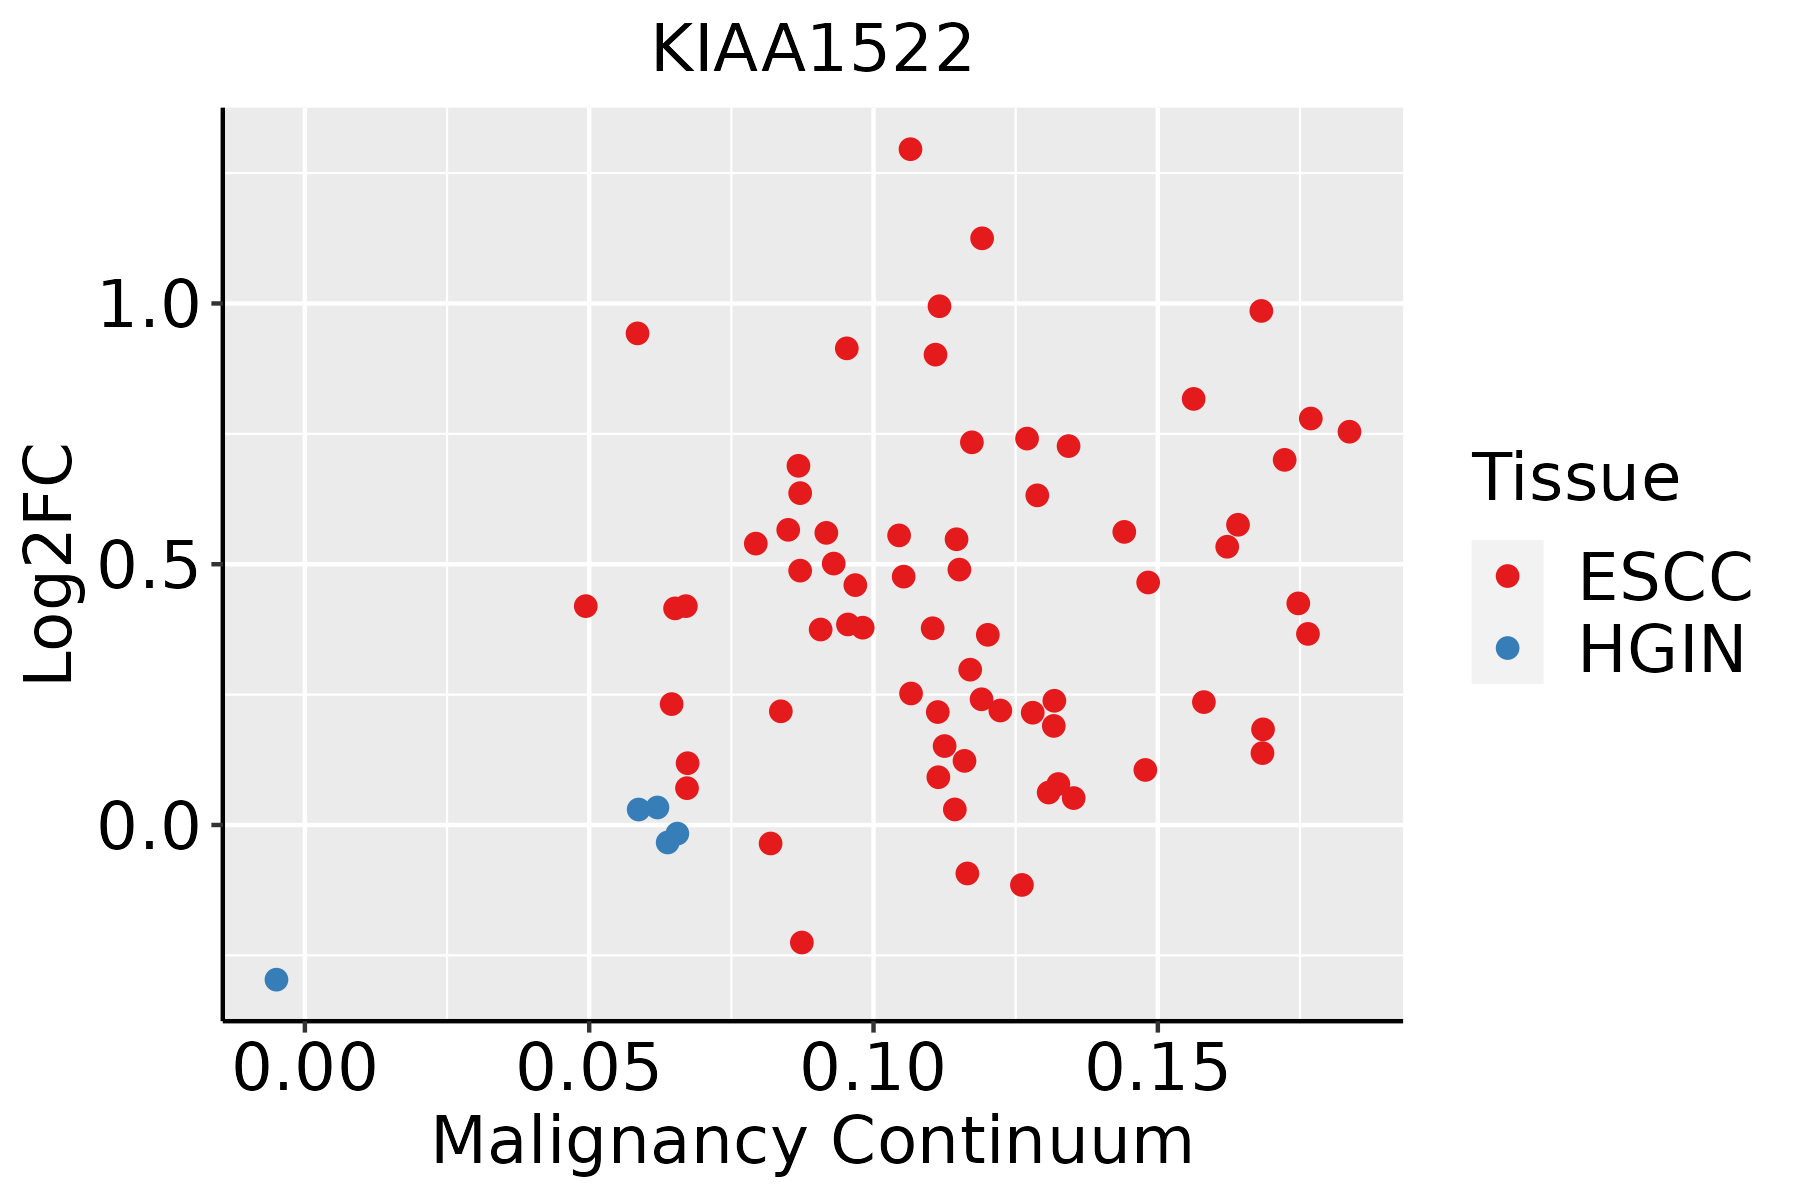 | ESCC: Esophageal squamous cell carcinoma |
| HGIN: High-grade intraepithelial neoplasias | ||
| LGIN: Low-grade intraepithelial neoplasias | ||
| Liver | 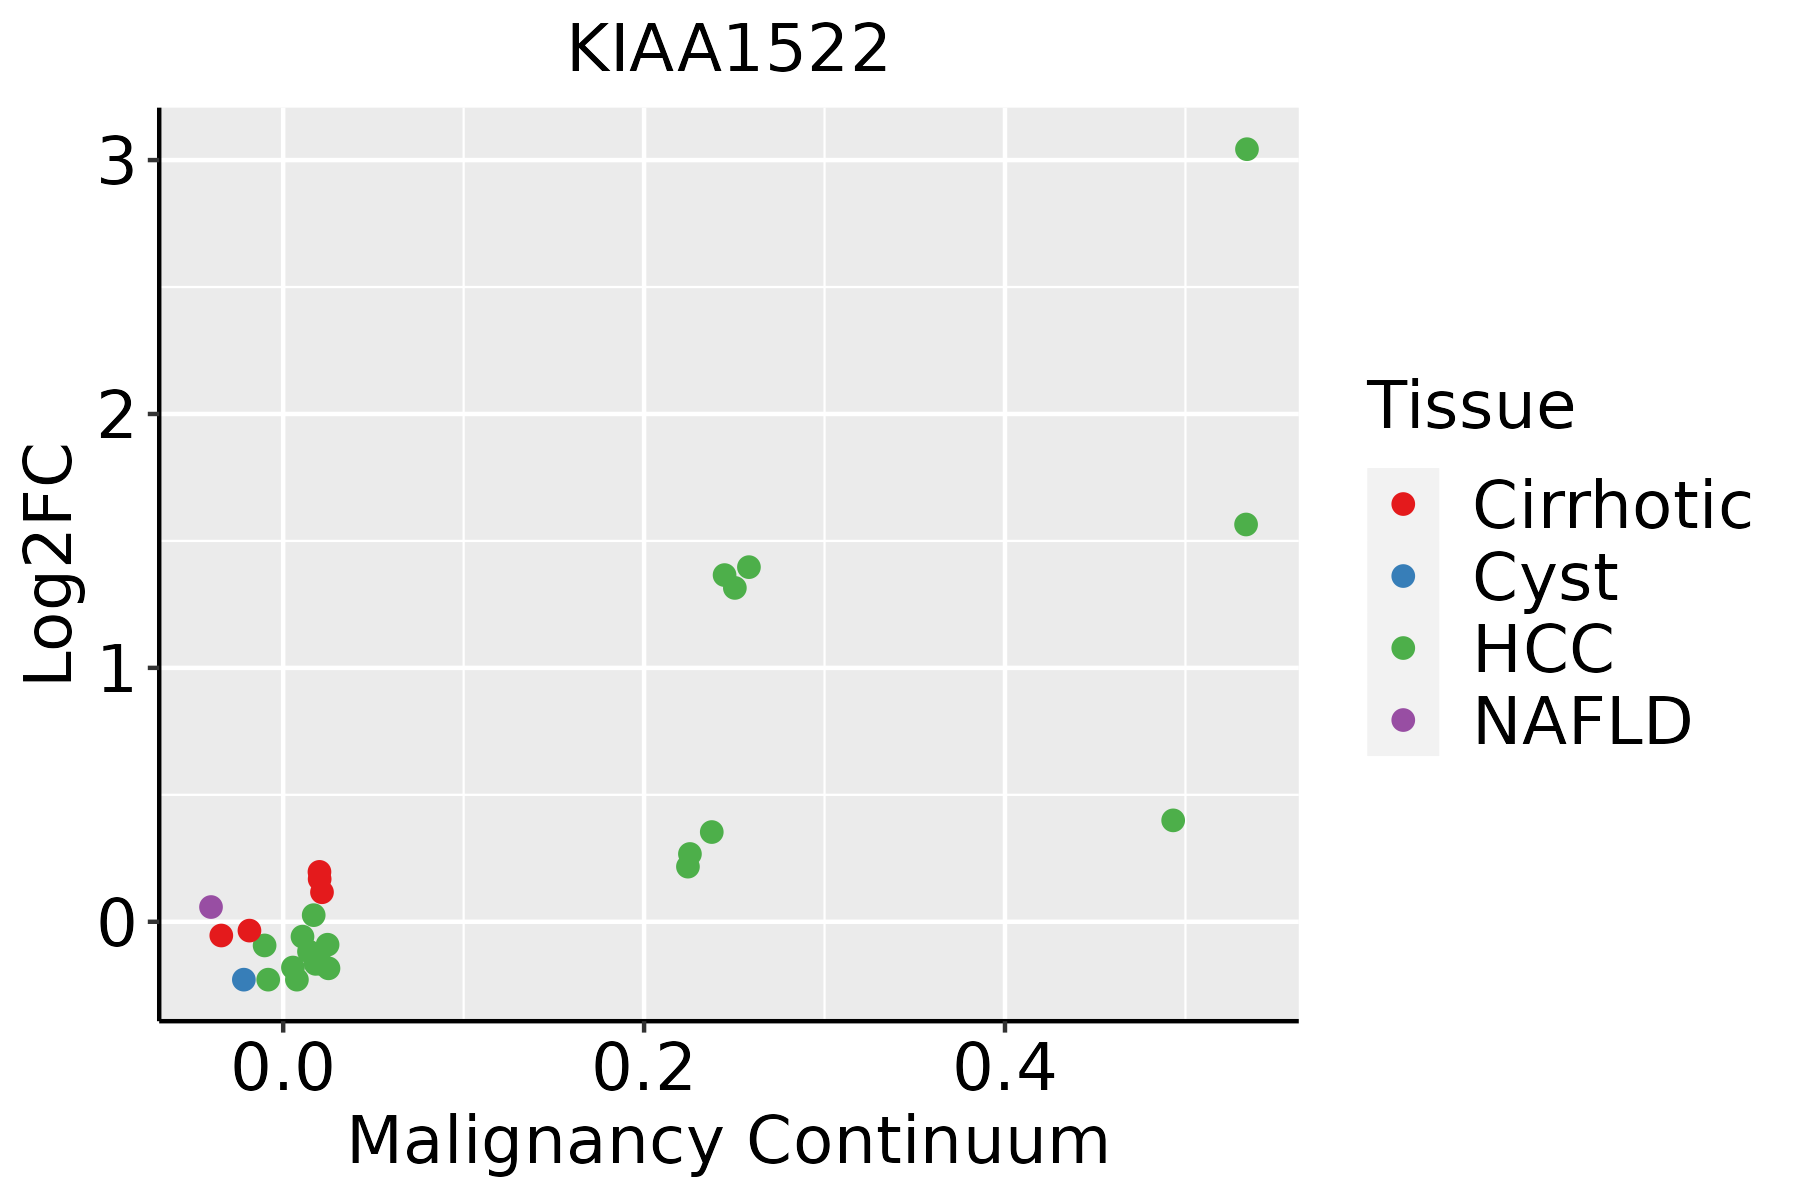 | HCC: Hepatocellular carcinoma |
| NAFLD: Non-alcoholic fatty liver disease | ||
| Oral Cavity |  | EOLP: Erosive Oral lichen planus |
| LP: leukoplakia | ||
| NEOLP: Non-erosive oral lichen planus | ||
| OSCC: Oral squamous cell carcinoma | ||
| Prostate | 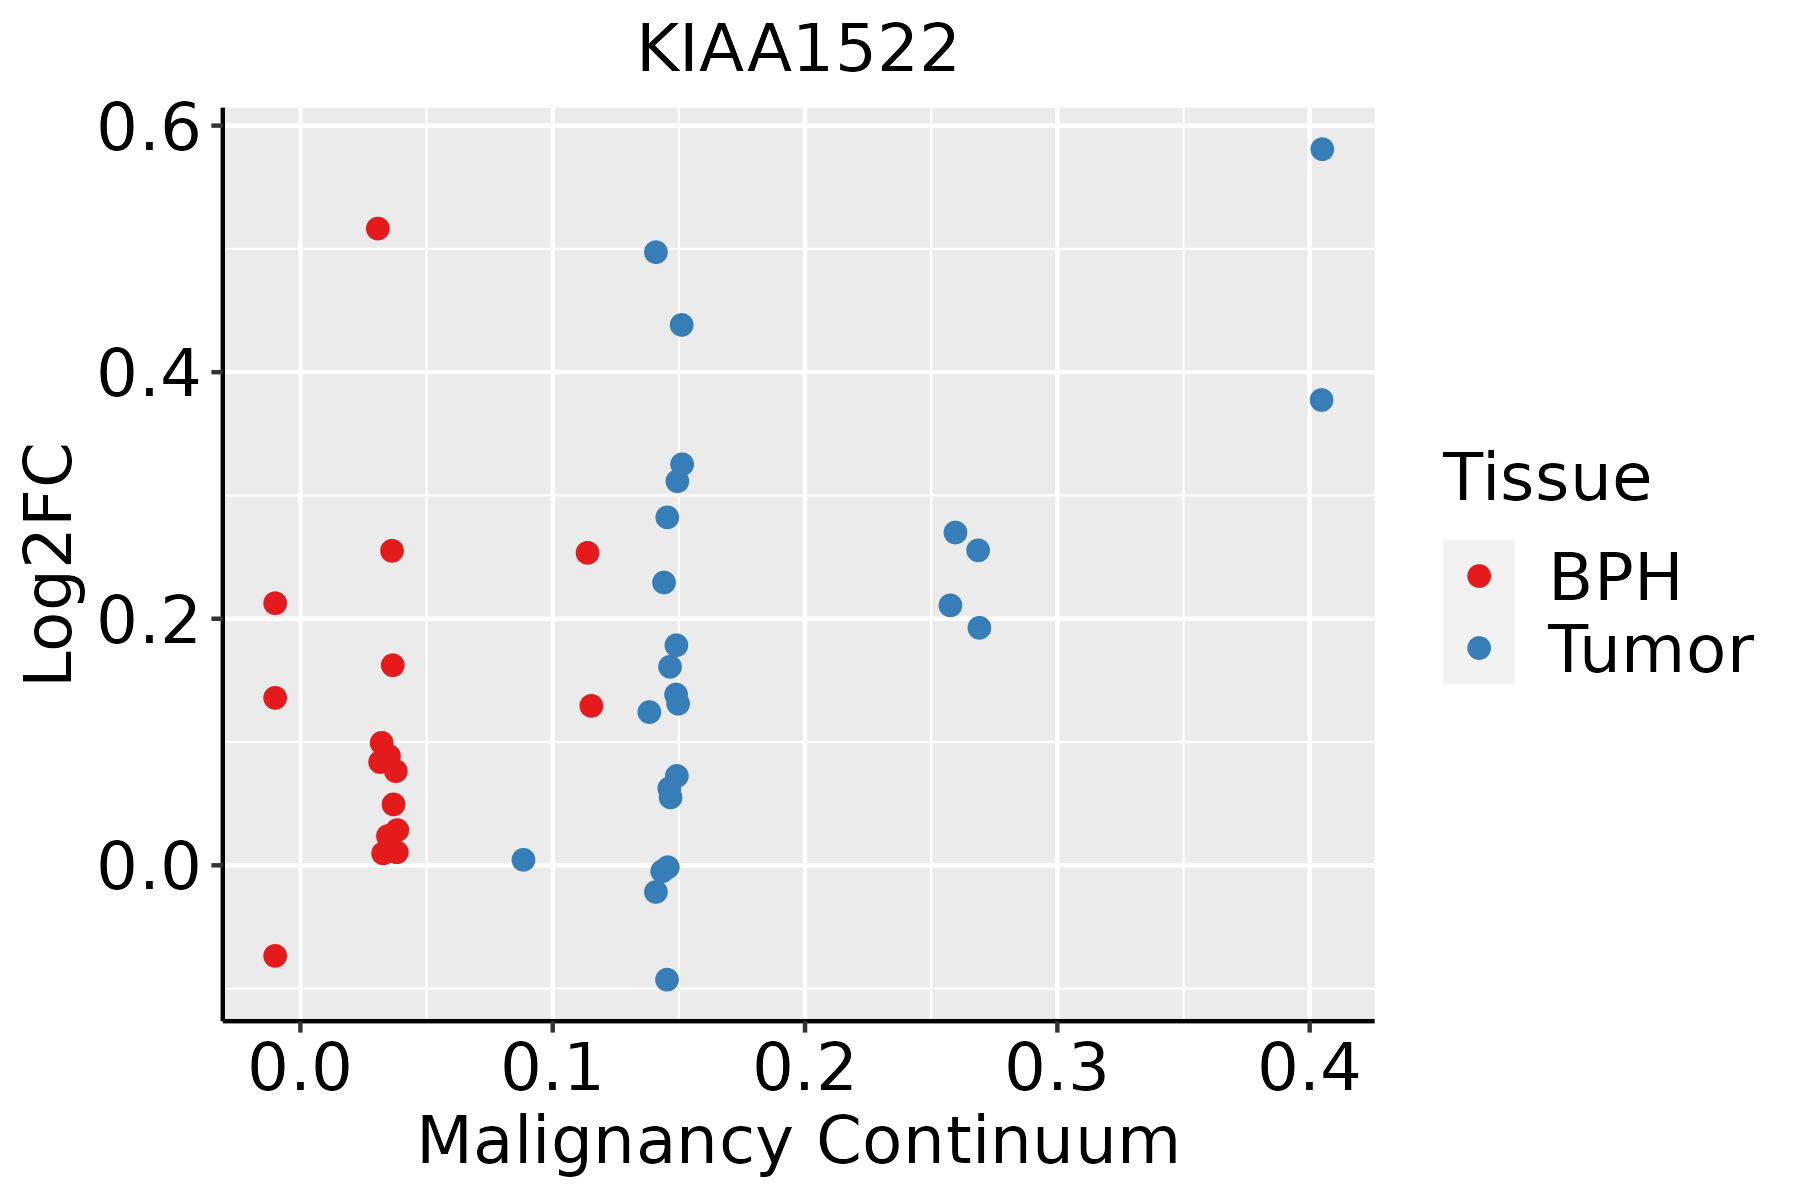 | BPH: Benign Prostatic Hyperplasia |
| Skin | 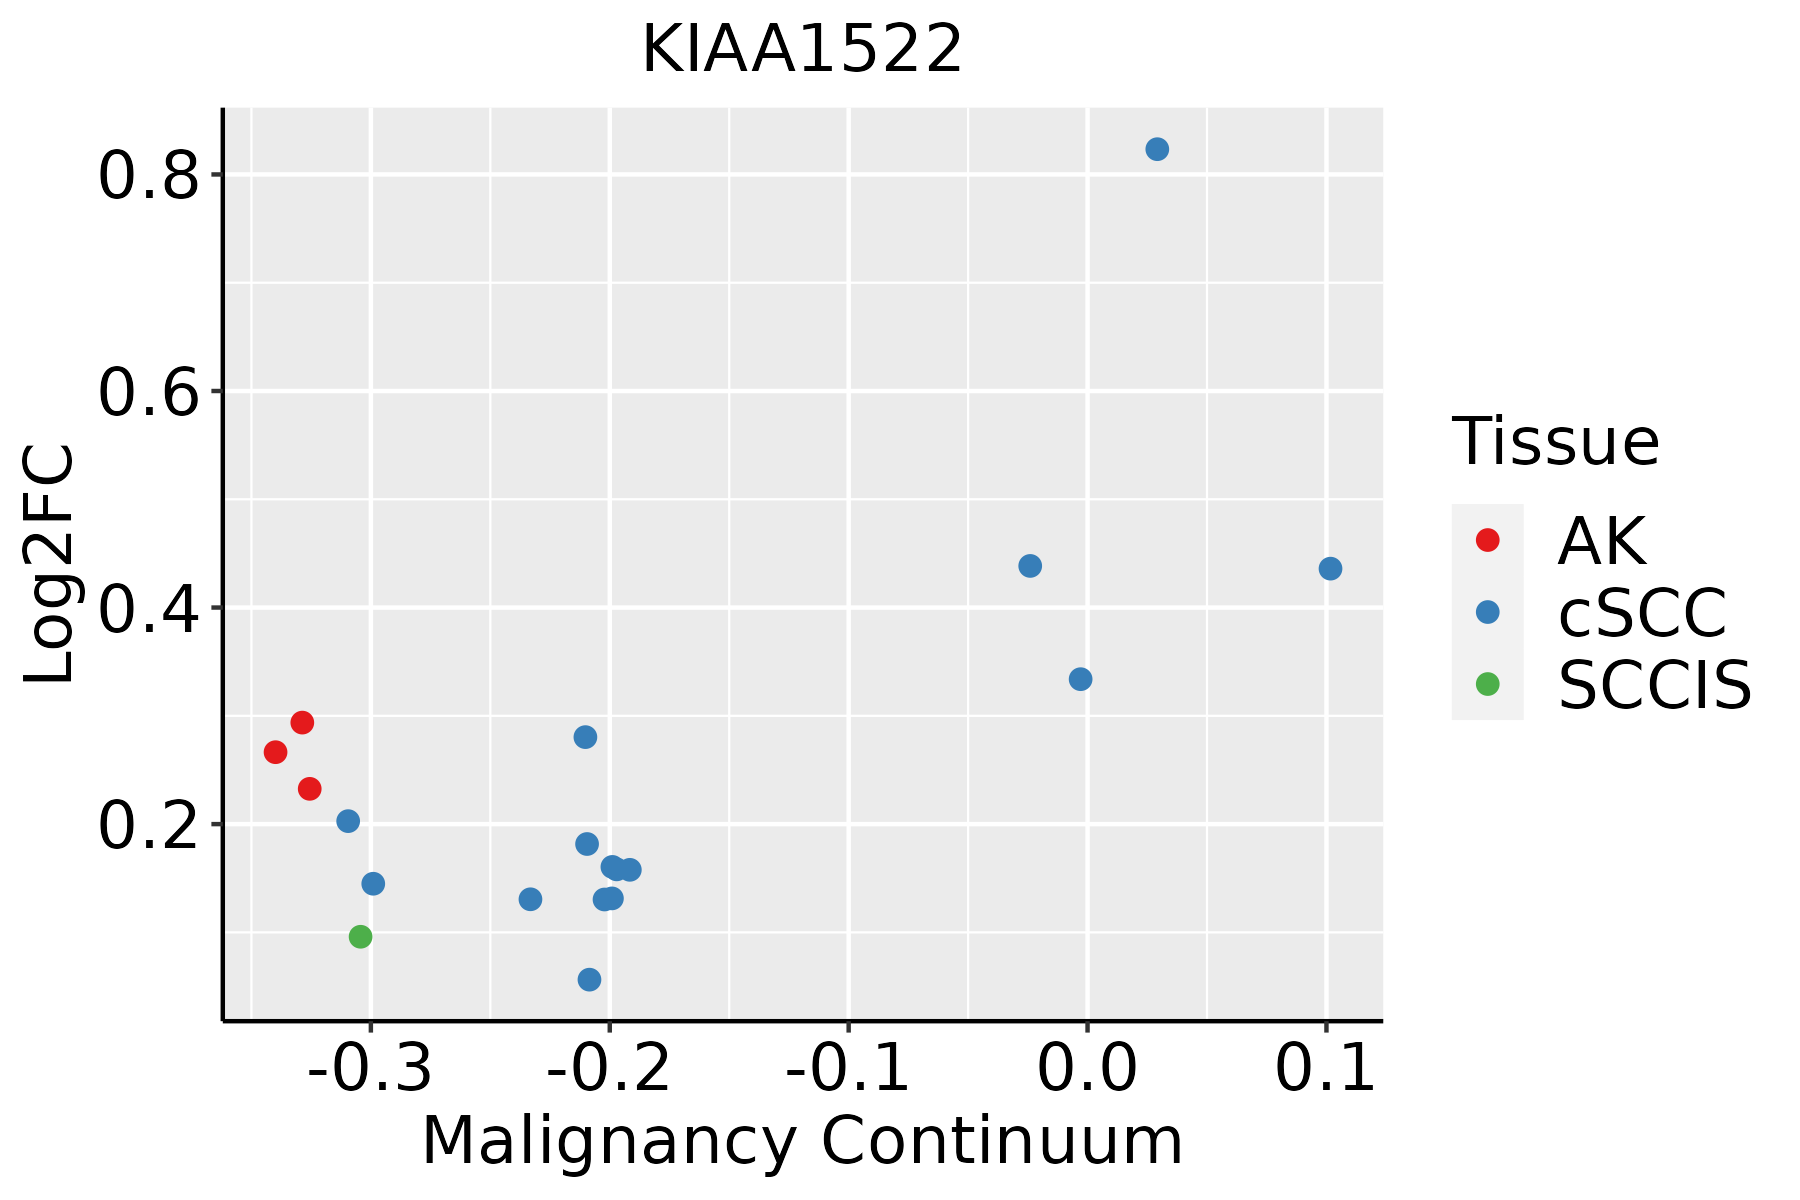 | AK: Actinic keratosis |
| cSCC: Cutaneous squamous cell carcinoma | ||
| SCCIS:squamous cell carcinoma in situ | ||
| Thyroid |  | ATC: Anaplastic thyroid cancer |
| HT: Hashimoto's thyroiditis | ||
| PTC: Papillary thyroid cancer |
| ∗log2FC in expression of this searched gene in stem-like cells from each diseased tissue sample relative to stem-like cells in normal samples in each tissue plotted against the malignancy continuum. Samples are colored based on if they are from different disease stage. |
Top |
Malignant transformation related pathway analysis |
| Find out the enriched GO biological processes and KEGG pathways involved in transition from healthy to precancer to cancer |
| Tissue | Disease Stage | Enriched GO biological Processes |
| Colorectum | AD |  |
| Colorectum | SER |  |
| Colorectum | MSS |  |
| Colorectum | MSI-H |  |
| Colorectum | FAP |  |
| ∗Top 15 enriched GO BP terms are showed in the bar plot of each disease state in each tissue. Each row represents a significant GO biological process which is colored according to the -log10(p.adjust). |
| Page: 1 2 3 4 5 6 7 8 9 |
| GO ID | Tissue | Disease Stage | Description | Gene Ratio | Bg Ratio | pvalue | p.adjust | Count |
| Page: 1 |
| Pathway ID | Tissue | Disease Stage | Description | Gene Ratio | Bg Ratio | pvalue | p.adjust | qvalue | Count |
| Page: 1 |
Top |
Cell-cell communication analysis |
| Identification of potential cell-cell interactions between two cell types and their ligand-receptor pairs for different disease states |
| Ligand | Receptor | LRpair | Pathway | Tissue | Disease Stage |
| Page: 1 |
Top |
Single-cell gene regulatory network inference analysis |
| Find out the significant the regulons (TFs) and the target genes of each regulon across cell types for different disease states |
| TF | Cell Type | Tissue | Disease Stage | Target Gene | RSS | Regulon Activity |
| ∗The dot plots of a searched regulon are shown for all cell subpopulations in each disease state of each tissue based on the regulon specific score inferred using pySCENIC and by calculating the average expression. |
| Page: 1 |
Top |
Somatic mutation of malignant transformation related genes |
| Annotation of somatic variants for genes involved in malignant transformation |
| Hugo Symbol | Variant Class | Variant Classification | dbSNP RS | HGVSc | HGVSp | HGVSp Short | SWISSPROT | BIOTYPE | SIFT | PolyPhen | Tumor Sample Barcode | Tissue | Histology | Sex | Age | Stage | Therapy Types | Drugs | Outcome |
| KIAA1522 | SNV | Missense_Mutation | novel | c.2159N>T | p.Ser720Phe | p.S720F | Q9P206 | protein_coding | tolerated_low_confidence(0.11) | possibly_damaging(0.495) | TCGA-3C-AALI-01 | Breast | breast invasive carcinoma | Female | <65 | I/II | Unspecific | Poly E | Complete Response |
| KIAA1522 | SNV | Missense_Mutation | c.1235N>G | p.Ser412Cys | p.S412C | Q9P206 | protein_coding | deleterious(0.01) | probably_damaging(0.98) | TCGA-BH-A0BR-01 | Breast | breast invasive carcinoma | Female | <65 | I/II | Unknown | Unknown | SD | |
| KIAA1522 | SNV | Missense_Mutation | novel | c.2348N>T | p.Ser783Phe | p.S783F | Q9P206 | protein_coding | deleterious(0) | probably_damaging(0.931) | TCGA-BH-A0DK-01 | Breast | breast invasive carcinoma | Female | <65 | I/II | Hormone Therapy | tamoxiphen | SD |
| KIAA1522 | SNV | Missense_Mutation | c.3270G>C | p.Gln1090His | p.Q1090H | Q9P206 | protein_coding | deleterious_low_confidence(0.01) | possibly_damaging(0.742) | TCGA-C8-A1HK-01 | Breast | breast invasive carcinoma | Female | <65 | I/II | Unknown | Unknown | SD | |
| KIAA1522 | insertion | Frame_Shift_Ins | novel | c.460_461insTCCAGTGCTGCACTGTCAGCTGTCA | p.Gln154LeufsTer17 | p.Q154Lfs*17 | Q9P206 | protein_coding | TCGA-A8-A09Q-01 | Breast | breast invasive carcinoma | Female | >=65 | III/IV | Hormone Therapy | anastrozole | SD | ||
| KIAA1522 | deletion | Frame_Shift_Del | novel | c.677delC | p.Pro226ArgfsTer10 | p.P226Rfs*10 | Q9P206 | protein_coding | TCGA-D8-A27V-01 | Breast | breast invasive carcinoma | Female | <65 | I/II | Hormone Therapy | tamoxiphen | SD | ||
| KIAA1522 | SNV | Missense_Mutation | novel | c.1301N>T | p.Ser434Phe | p.S434F | Q9P206 | protein_coding | deleterious(0) | benign(0.198) | TCGA-C5-A8XJ-01 | Cervix | cervical & endocervical cancer | Female | >=65 | I/II | Chemotherapy | cisplatin | SD |
| KIAA1522 | SNV | Missense_Mutation | rs778546155 | c.815G>A | p.Arg272Gln | p.R272Q | Q9P206 | protein_coding | tolerated(0.1) | probably_damaging(0.966) | TCGA-DS-A1OB-01 | Cervix | cervical & endocervical cancer | Female | <65 | I/II | Chemotherapy | carboplatin | PD |
| KIAA1522 | SNV | Missense_Mutation | c.2695N>G | p.Pro899Ala | p.P899A | Q9P206 | protein_coding | tolerated(0.3) | benign(0.001) | TCGA-IR-A3LA-01 | Cervix | cervical & endocervical cancer | Female | <65 | I/II | Chemotherapy | cisplatin | CR | |
| KIAA1522 | SNV | Missense_Mutation | c.260A>C | p.Lys87Thr | p.K87T | Q9P206 | protein_coding | tolerated(0.08) | benign(0.087) | TCGA-AA-3510-01 | Colorectum | colon adenocarcinoma | Male | >=65 | I/II | Unknown | Unknown | SD |
| Page: 1 2 3 4 5 6 7 8 9 10 11 |
Top |
Related drugs of malignant transformation related genes |
| Identification of chemicals and drugs interact with genes involved in malignant transfromation |
| (DGIdb 4.0) |
| Entrez ID | Symbol | Category | Interaction Types | Drug Claim Name | Drug Name | PMIDs |
| Page: 1 |

Copyright 2023-Present -The University of Texas Health Science Center at Houston |