
|
|||||
|
 | |
| |
| |
| |
| |
| |
|
Gene: KIAA1429 |
Gene summary for KIAA1429 |
| Gene information | Species | Human | Gene symbol | KIAA1429 | Gene ID | 25962 |
| Gene name | vir like m6A methyltransferase associated | |
| Gene Alias | KIAA1429 | |
| Cytomap | 8q22.1 | |
| Gene Type | protein-coding | GO ID | GO:0001510 | UniProtAcc | Q69YN4 |
Top |
Malignant transformation analysis |
| Identification of the aberrant gene expression in precancerous and cancerous lesions by comparing the gene expression of stem-like cells in diseased tissues with normal stem cells |
| Entrez ID | Symbol | Replicates | Species | Organ | Tissue | Adj P-value | Log2FC | Malignancy |
| 25962 | KIAA1429 | HTA11_99999970781_79442 | Human | Colorectum | MSS | 9.02e-22 | 3.72e-01 | 0.294 |
| 25962 | KIAA1429 | HTA11_99999965062_69753 | Human | Colorectum | MSI-H | 3.42e-04 | 3.79e-01 | 0.3487 |
| 25962 | KIAA1429 | HTA11_99999965104_69814 | Human | Colorectum | MSS | 5.46e-22 | 6.31e-01 | 0.281 |
| 25962 | KIAA1429 | HTA11_99999971662_82457 | Human | Colorectum | MSS | 4.96e-35 | 7.41e-01 | 0.3859 |
| 25962 | KIAA1429 | HTA11_99999973899_84307 | Human | Colorectum | MSS | 8.26e-07 | 2.82e-01 | 0.2585 |
| 25962 | KIAA1429 | HTA11_99999974143_84620 | Human | Colorectum | MSS | 1.73e-12 | 2.56e-01 | 0.3005 |
| 25962 | KIAA1429 | P1T-E | Human | Esophagus | ESCC | 2.28e-03 | 3.59e-01 | 0.0875 |
| 25962 | KIAA1429 | P2T-E | Human | Esophagus | ESCC | 6.99e-24 | 4.59e-01 | 0.1177 |
| 25962 | KIAA1429 | P4T-E | Human | Esophagus | ESCC | 5.49e-11 | 2.79e-01 | 0.1323 |
| 25962 | KIAA1429 | P5T-E | Human | Esophagus | ESCC | 8.90e-08 | 1.58e-01 | 0.1327 |
| 25962 | KIAA1429 | P8T-E | Human | Esophagus | ESCC | 3.75e-14 | 1.90e-01 | 0.0889 |
| 25962 | KIAA1429 | P9T-E | Human | Esophagus | ESCC | 1.55e-08 | 1.29e-01 | 0.1131 |
| 25962 | KIAA1429 | P10T-E | Human | Esophagus | ESCC | 3.30e-17 | 2.65e-01 | 0.116 |
| 25962 | KIAA1429 | P11T-E | Human | Esophagus | ESCC | 3.76e-11 | 4.54e-01 | 0.1426 |
| 25962 | KIAA1429 | P12T-E | Human | Esophagus | ESCC | 9.97e-27 | 4.73e-01 | 0.1122 |
| 25962 | KIAA1429 | P15T-E | Human | Esophagus | ESCC | 4.03e-10 | 3.37e-01 | 0.1149 |
| 25962 | KIAA1429 | P16T-E | Human | Esophagus | ESCC | 2.41e-33 | 6.36e-01 | 0.1153 |
| 25962 | KIAA1429 | P17T-E | Human | Esophagus | ESCC | 2.03e-09 | 3.97e-01 | 0.1278 |
| 25962 | KIAA1429 | P20T-E | Human | Esophagus | ESCC | 1.12e-10 | 2.01e-01 | 0.1124 |
| 25962 | KIAA1429 | P21T-E | Human | Esophagus | ESCC | 1.45e-24 | 6.05e-01 | 0.1617 |
| Page: 1 2 3 4 5 |
| Tissue | Expression Dynamics | Abbreviation |
| Colorectum (GSE201348) |  | FAP: Familial adenomatous polyposis |
| CRC: Colorectal cancer | ||
| Colorectum (HTA11) | 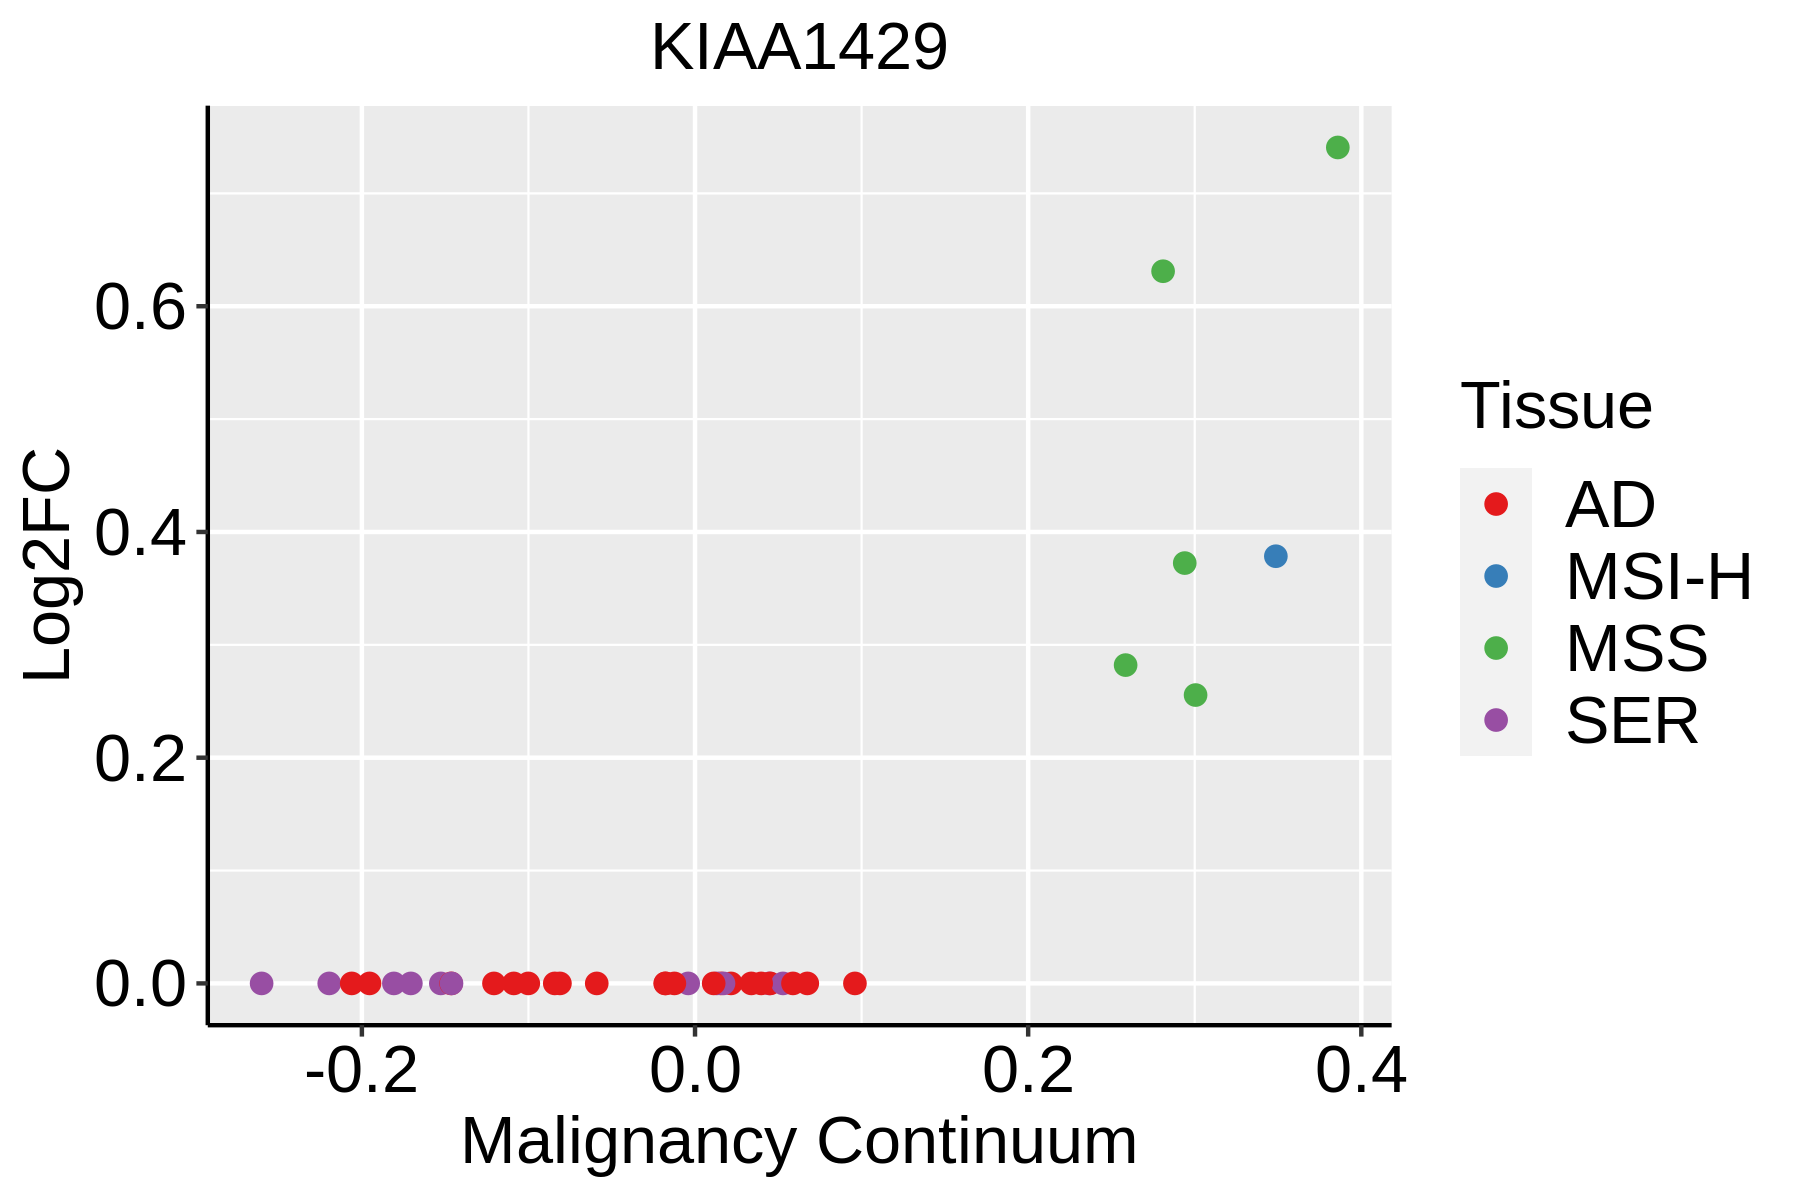 | AD: Adenomas |
| SER: Sessile serrated lesions | ||
| MSI-H: Microsatellite-high colorectal cancer | ||
| MSS: Microsatellite stable colorectal cancer | ||
| Esophagus | 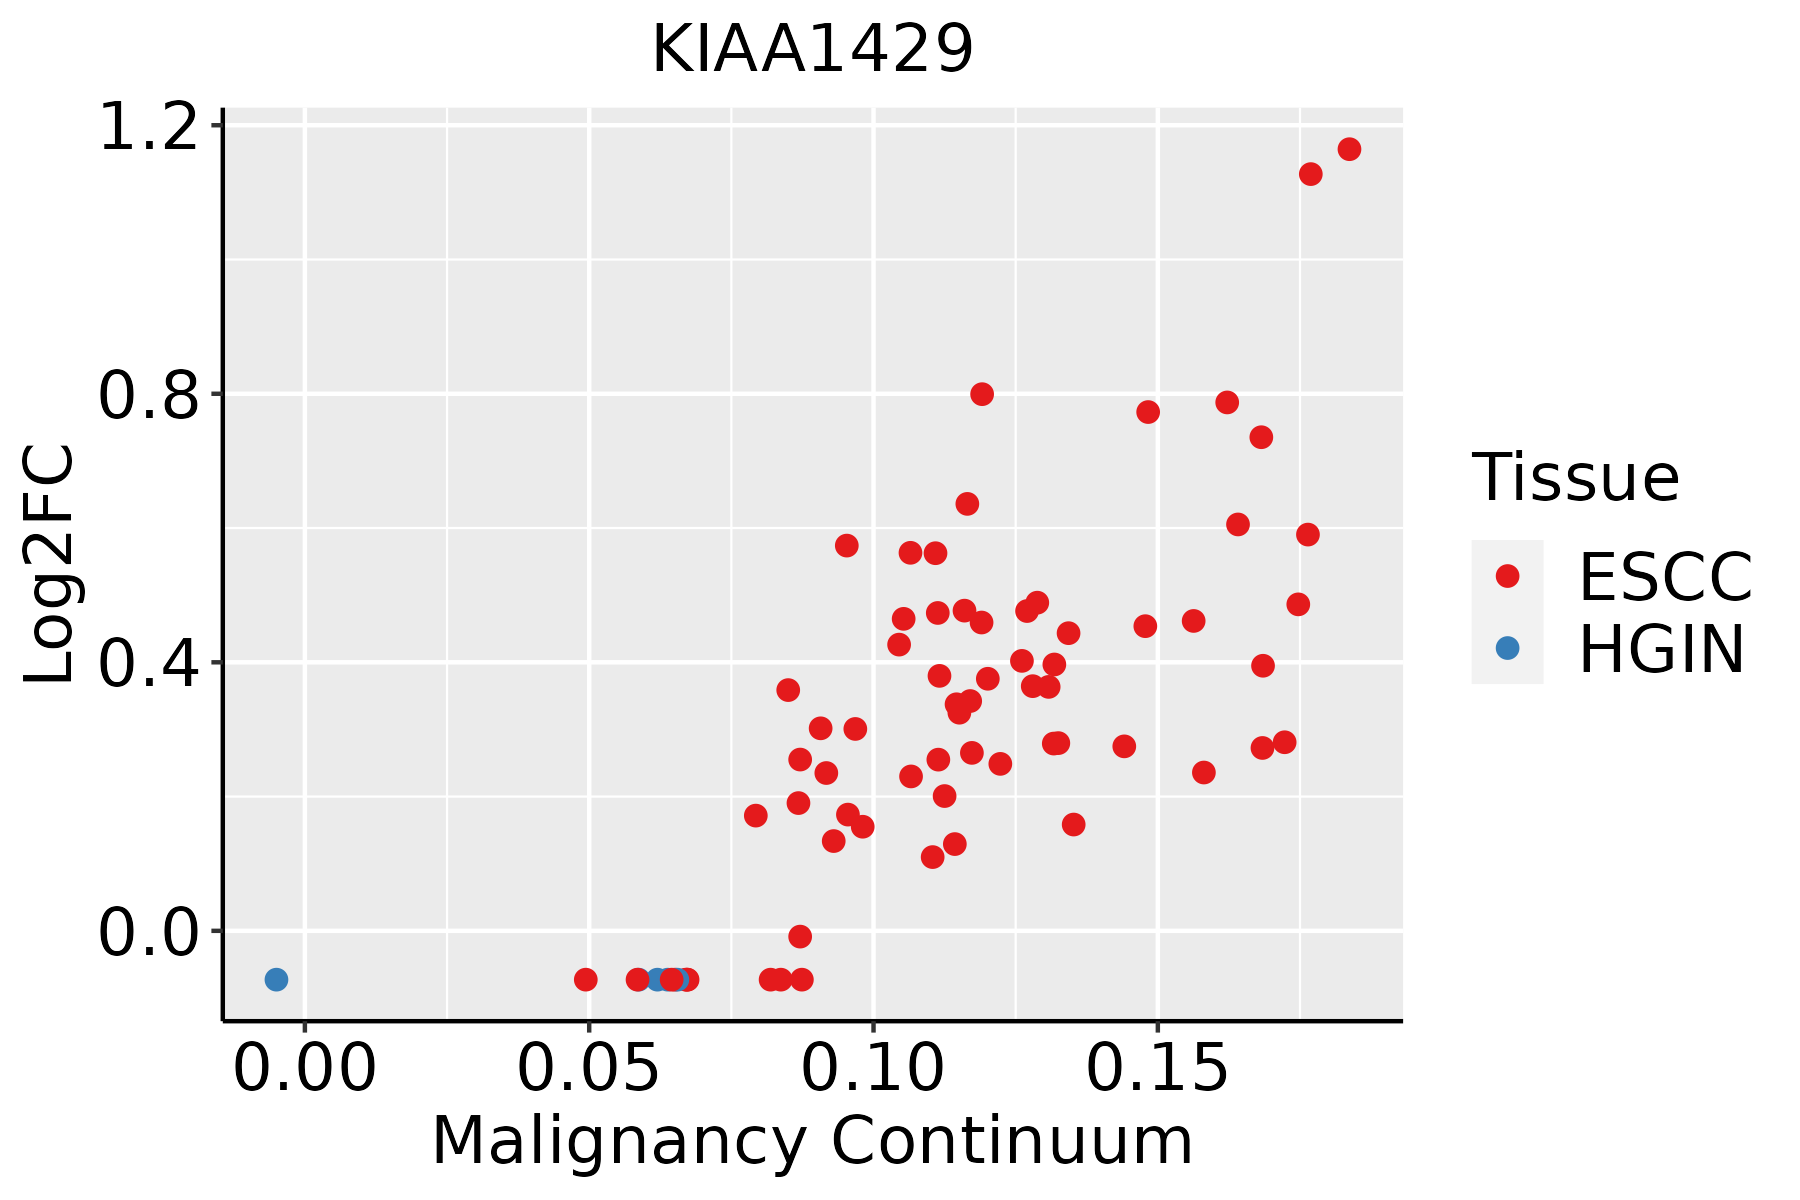 | ESCC: Esophageal squamous cell carcinoma |
| HGIN: High-grade intraepithelial neoplasias | ||
| LGIN: Low-grade intraepithelial neoplasias | ||
| Liver | 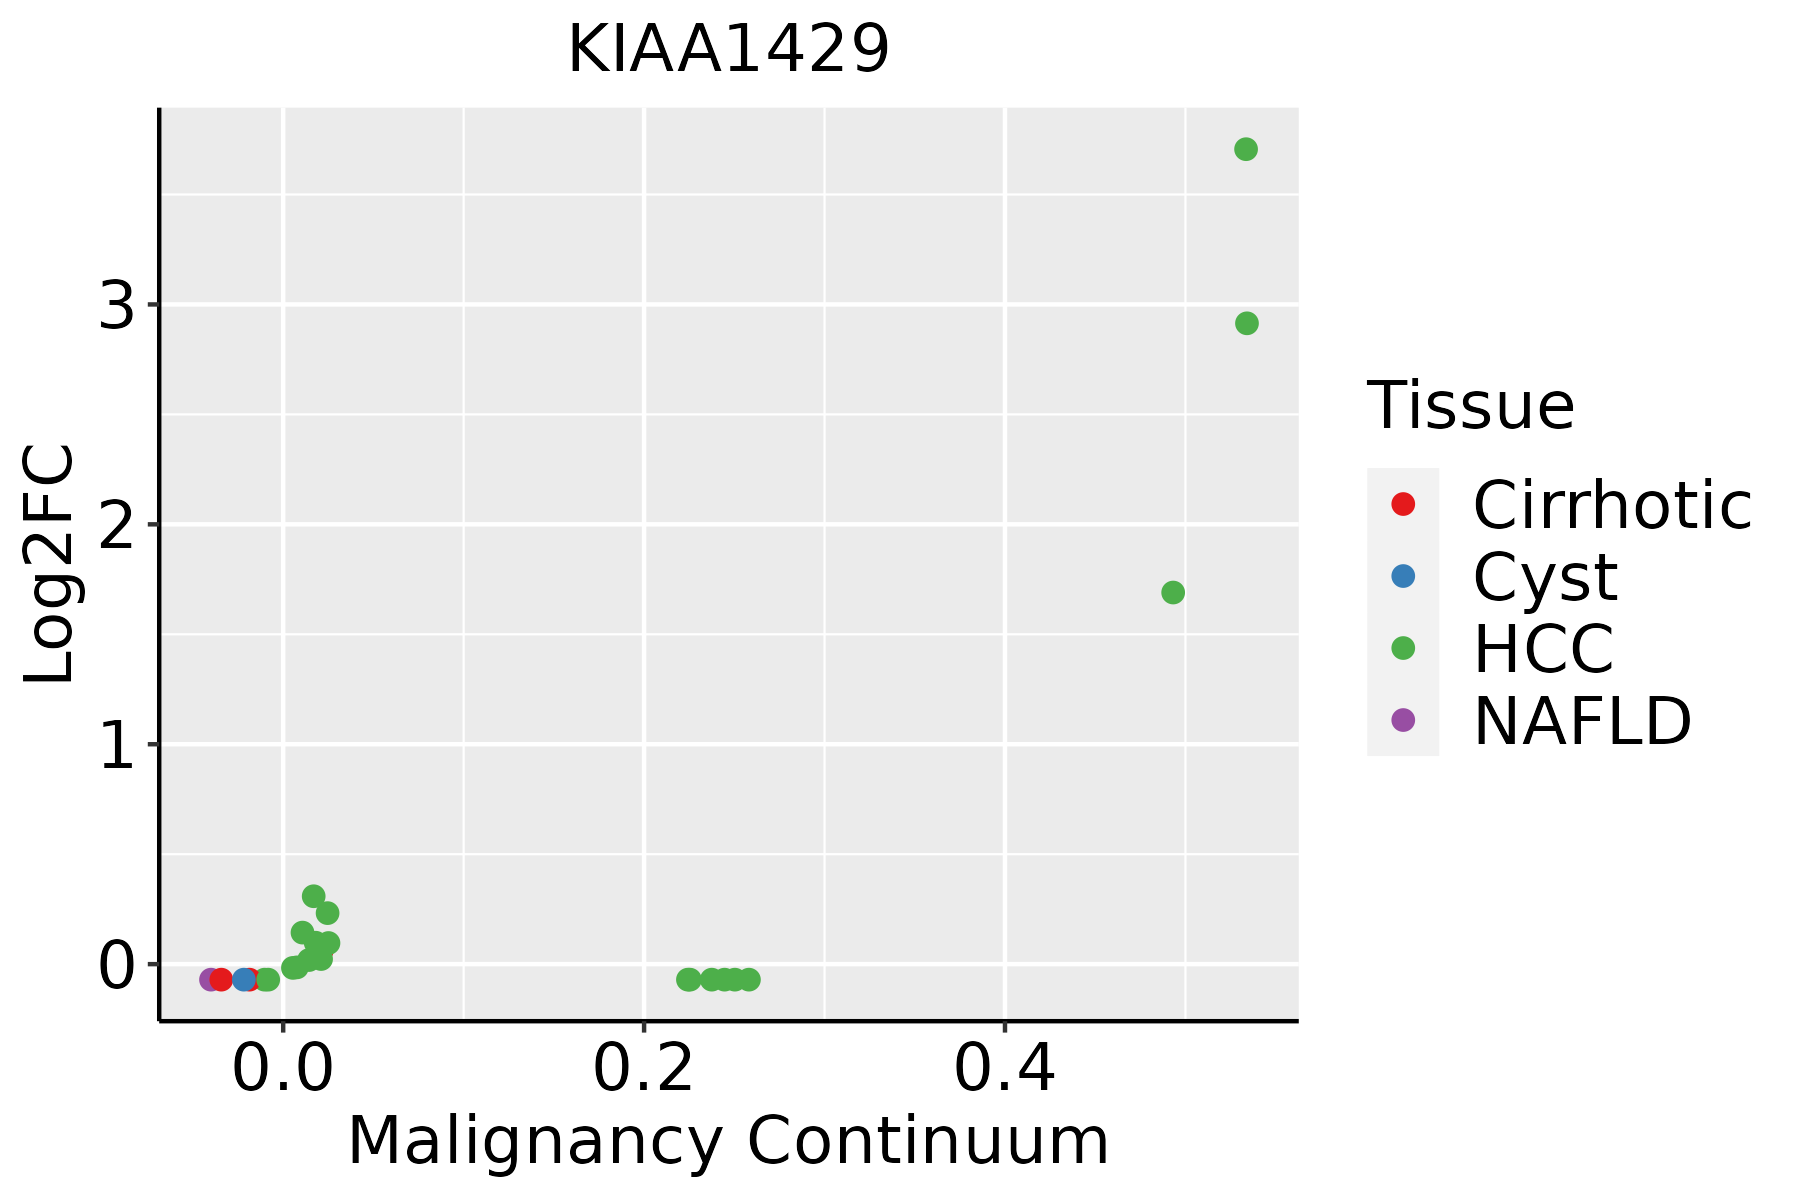 | HCC: Hepatocellular carcinoma |
| NAFLD: Non-alcoholic fatty liver disease | ||
| Oral Cavity | 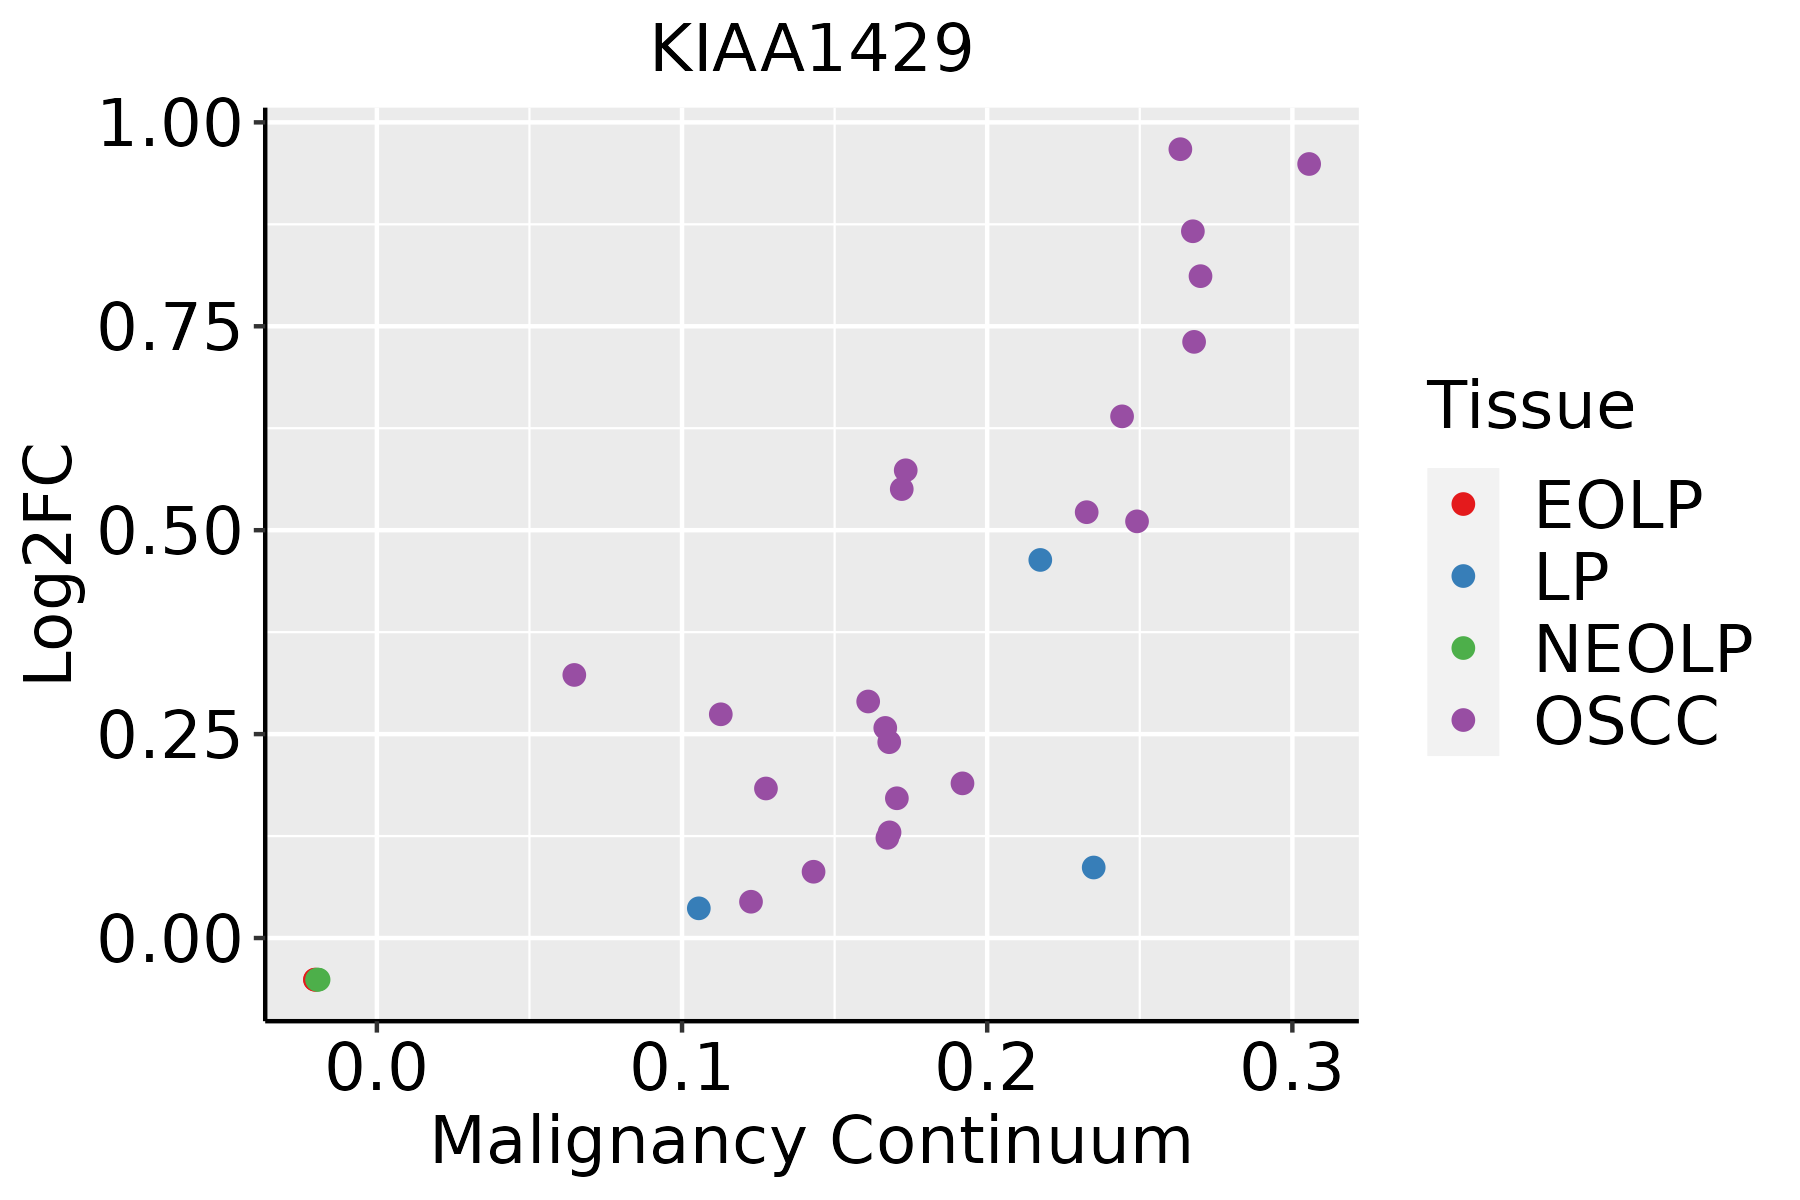 | EOLP: Erosive Oral lichen planus |
| LP: leukoplakia | ||
| NEOLP: Non-erosive oral lichen planus | ||
| OSCC: Oral squamous cell carcinoma | ||
| Prostate | 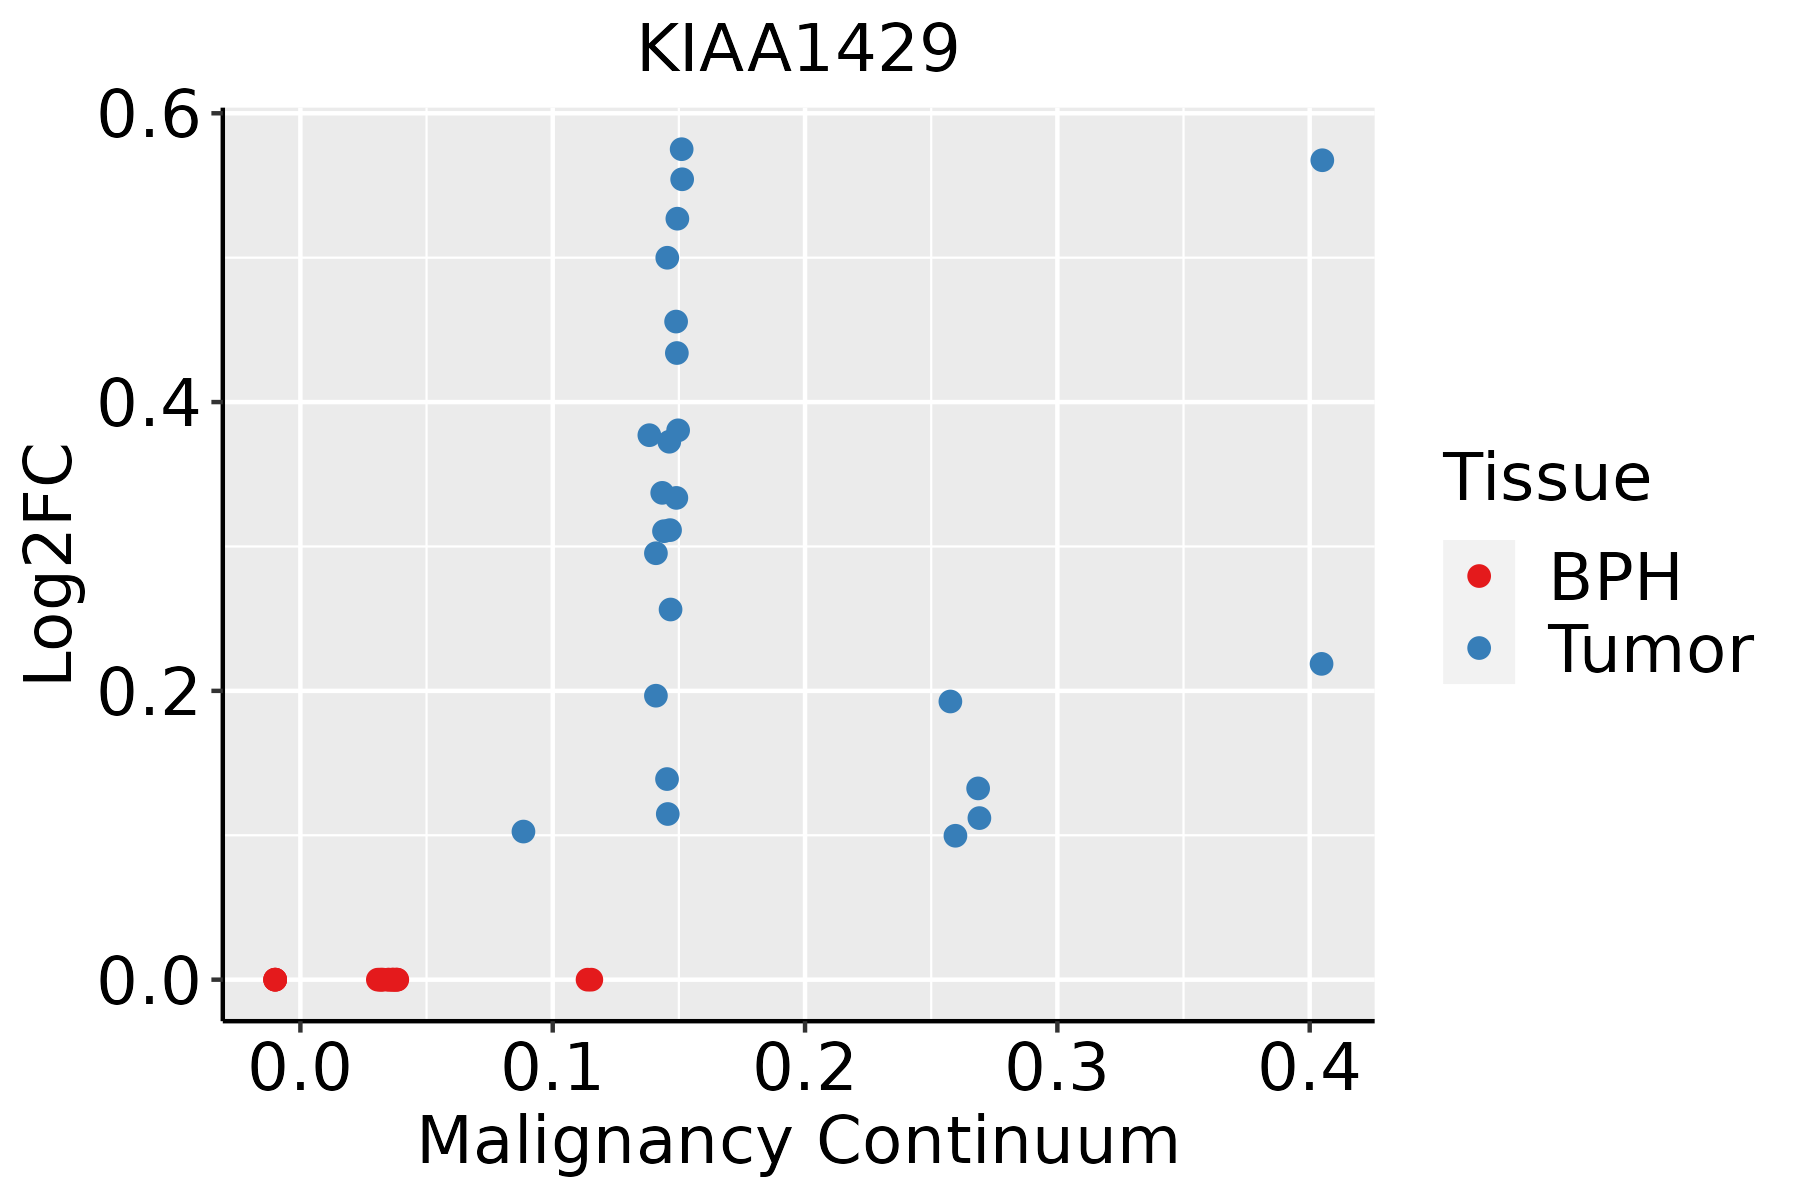 | BPH: Benign Prostatic Hyperplasia |
| Skin | 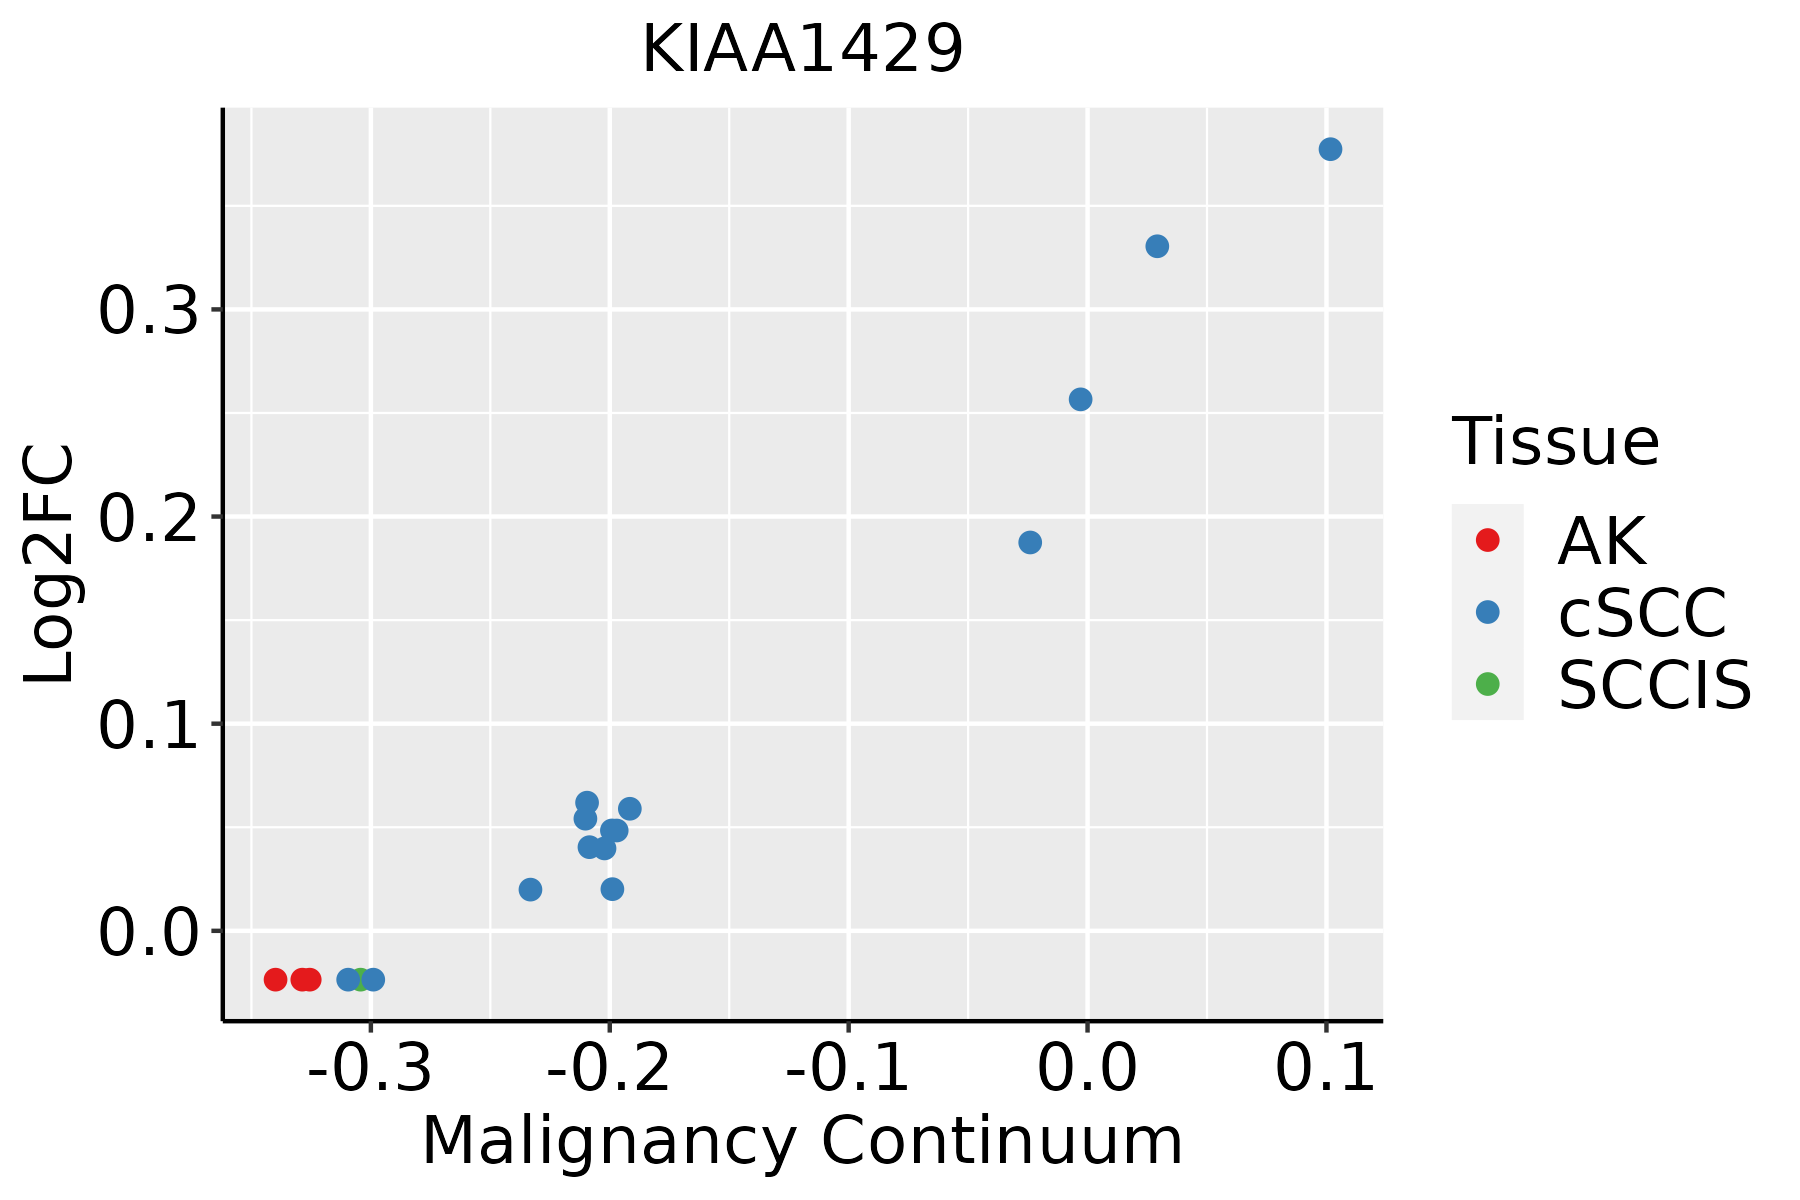 | AK: Actinic keratosis |
| cSCC: Cutaneous squamous cell carcinoma | ||
| SCCIS:squamous cell carcinoma in situ |
| ∗log2FC in expression of this searched gene in stem-like cells from each diseased tissue sample relative to stem-like cells in normal samples in each tissue plotted against the malignancy continuum. Samples are colored based on if they are from different disease stage. |
Top |
Malignant transformation related pathway analysis |
| Find out the enriched GO biological processes and KEGG pathways involved in transition from healthy to precancer to cancer |
| Tissue | Disease Stage | Enriched GO biological Processes |
| Colorectum | AD |  |
| Colorectum | SER |  |
| Colorectum | MSS |  |
| Colorectum | MSI-H |  |
| Colorectum | FAP |  |
| ∗Top 15 enriched GO BP terms are showed in the bar plot of each disease state in each tissue. Each row represents a significant GO biological process which is colored according to the -log10(p.adjust). |
| Page: 1 2 3 4 5 6 7 8 9 |
| GO ID | Tissue | Disease Stage | Description | Gene Ratio | Bg Ratio | pvalue | p.adjust | Count |
| Page: 1 |
| Pathway ID | Tissue | Disease Stage | Description | Gene Ratio | Bg Ratio | pvalue | p.adjust | qvalue | Count |
| Page: 1 |
Top |
Cell-cell communication analysis |
| Identification of potential cell-cell interactions between two cell types and their ligand-receptor pairs for different disease states |
| Ligand | Receptor | LRpair | Pathway | Tissue | Disease Stage |
| Page: 1 |
Top |
Single-cell gene regulatory network inference analysis |
| Find out the significant the regulons (TFs) and the target genes of each regulon across cell types for different disease states |
| TF | Cell Type | Tissue | Disease Stage | Target Gene | RSS | Regulon Activity |
| ∗The dot plots of a searched regulon are shown for all cell subpopulations in each disease state of each tissue based on the regulon specific score inferred using pySCENIC and by calculating the average expression. |
| Page: 1 |
Top |
Somatic mutation of malignant transformation related genes |
| Annotation of somatic variants for genes involved in malignant transformation |
| Hugo Symbol | Variant Class | Variant Classification | dbSNP RS | HGVSc | HGVSp | HGVSp Short | SWISSPROT | BIOTYPE | SIFT | PolyPhen | Tumor Sample Barcode | Tissue | Histology | Sex | Age | Stage | Therapy Types | Drugs | Outcome |
| KIAA1429 | SNV | Missense_Mutation | novel | c.3332N>G | p.Ser1111Cys | p.S1111C | Q69YN4 | protein_coding | deleterious(0) | benign(0.006) | TCGA-5L-AAT1-01 | Breast | breast invasive carcinoma | Female | <65 | III/IV | Hormone Therapy | letrozol | SD |
| KIAA1429 | SNV | Missense_Mutation | novel | c.2894N>A | p.Ser965Tyr | p.S965Y | Q69YN4 | protein_coding | deleterious(0) | probably_damaging(0.994) | TCGA-A2-A0YK-01 | Breast | breast invasive carcinoma | Female | <65 | I/II | Chemotherapy | cytoxan | SD |
| KIAA1429 | SNV | Missense_Mutation | c.4433N>C | p.Val1478Ala | p.V1478A | Q69YN4 | protein_coding | tolerated(0.27) | benign(0) | TCGA-A8-A09T-01 | Breast | breast invasive carcinoma | Female | >=65 | I/II | Hormone Therapy | anastrozole | SD | |
| KIAA1429 | SNV | Missense_Mutation | c.3931N>C | p.Glu1311Gln | p.E1311Q | Q69YN4 | protein_coding | deleterious(0.01) | benign(0.346) | TCGA-AC-A23H-01 | Breast | breast invasive carcinoma | Female | >=65 | I/II | Unknown | Unknown | PD | |
| KIAA1429 | SNV | Missense_Mutation | c.3606N>T | p.Leu1202Phe | p.L1202F | Q69YN4 | protein_coding | tolerated(0.06) | possibly_damaging(0.883) | TCGA-AC-A23H-01 | Breast | breast invasive carcinoma | Female | >=65 | I/II | Unknown | Unknown | PD | |
| KIAA1429 | SNV | Missense_Mutation | novel | c.835N>C | p.Glu279Gln | p.E279Q | Q69YN4 | protein_coding | tolerated(0.17) | benign(0.206) | TCGA-AC-A3W6-01 | Breast | breast invasive carcinoma | Female | >=65 | III/IV | Unknown | Unknown | SD |
| KIAA1429 | SNV | Missense_Mutation | c.2686N>C | p.Glu896Gln | p.E896Q | Q69YN4 | protein_coding | tolerated(0.13) | possibly_damaging(0.756) | TCGA-AN-A0AM-01 | Breast | breast invasive carcinoma | Female | <65 | I/II | Unknown | Unknown | SD | |
| KIAA1429 | SNV | Missense_Mutation | c.766N>A | p.Asp256Asn | p.D256N | Q69YN4 | protein_coding | tolerated_low_confidence(0.22) | benign(0.047) | TCGA-AO-A03V-01 | Breast | breast invasive carcinoma | Female | <65 | I/II | Chemotherapy | fluorouracil | SD | |
| KIAA1429 | SNV | Missense_Mutation | c.4799N>A | p.Ile1600Lys | p.I1600K | Q69YN4 | protein_coding | deleterious(0.01) | probably_damaging(0.994) | TCGA-AO-A1KR-01 | Breast | breast invasive carcinoma | Female | <65 | I/II | Chemotherapy | cyclophosphamide | SD | |
| KIAA1429 | SNV | Missense_Mutation | c.5388T>G | p.Phe1796Leu | p.F1796L | Q69YN4 | protein_coding | deleterious(0.03) | probably_damaging(0.953) | TCGA-AR-A254-01 | Breast | breast invasive carcinoma | Female | <65 | III/IV | Chemotherapy | paclitaxel | SD |
| Page: 1 2 3 4 5 6 7 8 9 10 11 12 13 14 15 16 17 18 19 20 |
Top |
Related drugs of malignant transformation related genes |
| Identification of chemicals and drugs interact with genes involved in malignant transfromation |
| (DGIdb 4.0) |
| Entrez ID | Symbol | Category | Interaction Types | Drug Claim Name | Drug Name | PMIDs |
| Page: 1 |

Copyright 2023-Present -The University of Texas Health Science Center at Houston |