
|
|||||
|
 | |
| |
| |
| |
| |
| |
|
Gene: KIAA1324 |
Gene summary for KIAA1324 |
| Gene information | Species | Human | Gene symbol | KIAA1324 | Gene ID | 57535 |
| Gene name | endosome-lysosome associated apoptosis and autophagy regulator 1 | |
| Gene Alias | EIG121 | |
| Cytomap | 1p13.3 | |
| Gene Type | protein-coding | GO ID | GO:0000045 | UniProtAcc | Q6UXG2 |
Top |
Malignant transformation analysis |
| Identification of the aberrant gene expression in precancerous and cancerous lesions by comparing the gene expression of stem-like cells in diseased tissues with normal stem cells |
| Entrez ID | Symbol | Replicates | Species | Organ | Tissue | Adj P-value | Log2FC | Malignancy |
| 57535 | KIAA1324 | GSM4909285 | Human | Breast | IDC | 2.37e-09 | 2.45e-01 | 0.21 |
| 57535 | KIAA1324 | GSM4909286 | Human | Breast | IDC | 3.20e-04 | -7.18e-02 | 0.1081 |
| 57535 | KIAA1324 | GSM4909287 | Human | Breast | IDC | 2.08e-03 | -1.56e-01 | 0.2057 |
| 57535 | KIAA1324 | GSM4909292 | Human | Breast | IDC | 8.00e-03 | 5.17e-01 | 0.1236 |
| 57535 | KIAA1324 | GSM4909301 | Human | Breast | IDC | 2.51e-03 | -1.78e-01 | 0.1577 |
| 57535 | KIAA1324 | GSM4909303 | Human | Breast | IDC | 2.71e-04 | 5.10e-01 | 0.0438 |
| 57535 | KIAA1324 | GSM4909311 | Human | Breast | IDC | 1.87e-10 | -8.84e-02 | 0.1534 |
| 57535 | KIAA1324 | GSM4909319 | Human | Breast | IDC | 2.84e-17 | -2.66e-01 | 0.1563 |
| 57535 | KIAA1324 | GSM4909321 | Human | Breast | IDC | 8.61e-08 | -2.18e-01 | 0.1559 |
| 57535 | KIAA1324 | brca1 | Human | Breast | Precancer | 3.03e-08 | -2.59e-01 | -0.0338 |
| 57535 | KIAA1324 | NCCBC11 | Human | Breast | DCIS | 5.93e-04 | 1.39e-01 | 0.1232 |
| 57535 | KIAA1324 | NCCBC14 | Human | Breast | DCIS | 2.78e-05 | -3.18e-02 | 0.2021 |
| 57535 | KIAA1324 | NCCBC3 | Human | Breast | DCIS | 2.20e-02 | 3.25e-01 | 0.1198 |
| 57535 | KIAA1324 | NCCBC5 | Human | Breast | DCIS | 5.07e-06 | -1.50e-01 | 0.2046 |
| 57535 | KIAA1324 | P1 | Human | Breast | IDC | 3.45e-07 | -1.19e-02 | 0.1527 |
| 57535 | KIAA1324 | P2 | Human | Breast | IDC | 5.86e-03 | -3.08e-02 | 0.21 |
| 57535 | KIAA1324 | DCIS2 | Human | Breast | DCIS | 4.16e-30 | 1.21e-01 | 0.0085 |
| 57535 | KIAA1324 | H2 | Human | Cervix | HSIL_HPV | 3.06e-32 | 6.97e-01 | 0.0632 |
| 57535 | KIAA1324 | T2 | Human | Cervix | CC | 3.99e-18 | 6.79e-01 | 0.0709 |
| 57535 | KIAA1324 | HTA11_3410_2000001011 | Human | Colorectum | AD | 1.46e-36 | -7.94e-01 | 0.0155 |
| Page: 1 2 3 4 5 6 7 |
| Tissue | Expression Dynamics | Abbreviation |
| Breast | 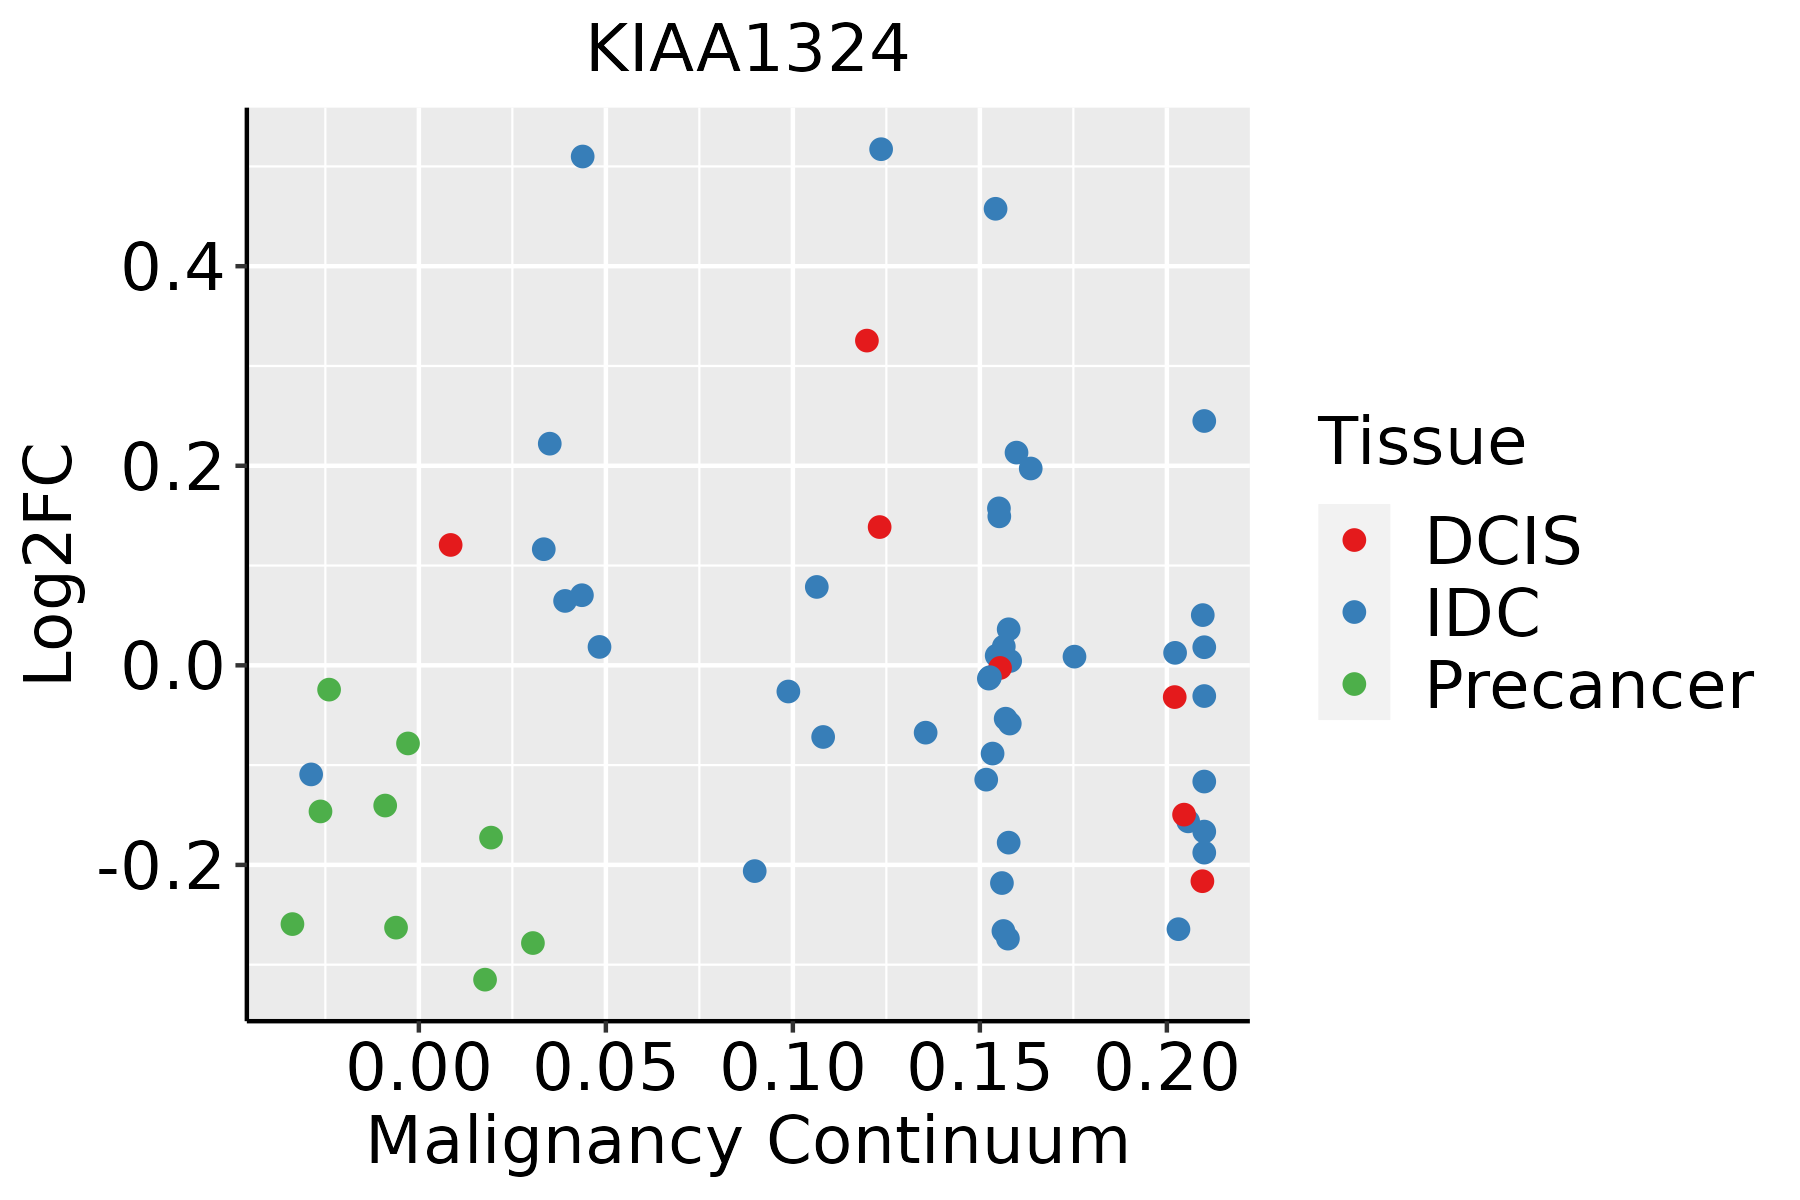 | IDC: Invasive ductal carcinoma |
| DCIS: Ductal carcinoma in situ | ||
| Precancer(BRCA1-mut): Precancerous lesion from BRCA1 mutation carriers | ||
| Cervix |  | CC: Cervix cancer |
| HSIL_HPV: HPV-infected high-grade squamous intraepithelial lesions | ||
| N_HPV: HPV-infected normal cervix | ||
| Colorectum (GSE201348) |  | FAP: Familial adenomatous polyposis |
| CRC: Colorectal cancer | ||
| Colorectum (HTA11) |  | AD: Adenomas |
| SER: Sessile serrated lesions | ||
| MSI-H: Microsatellite-high colorectal cancer | ||
| MSS: Microsatellite stable colorectal cancer | ||
| Endometrium | 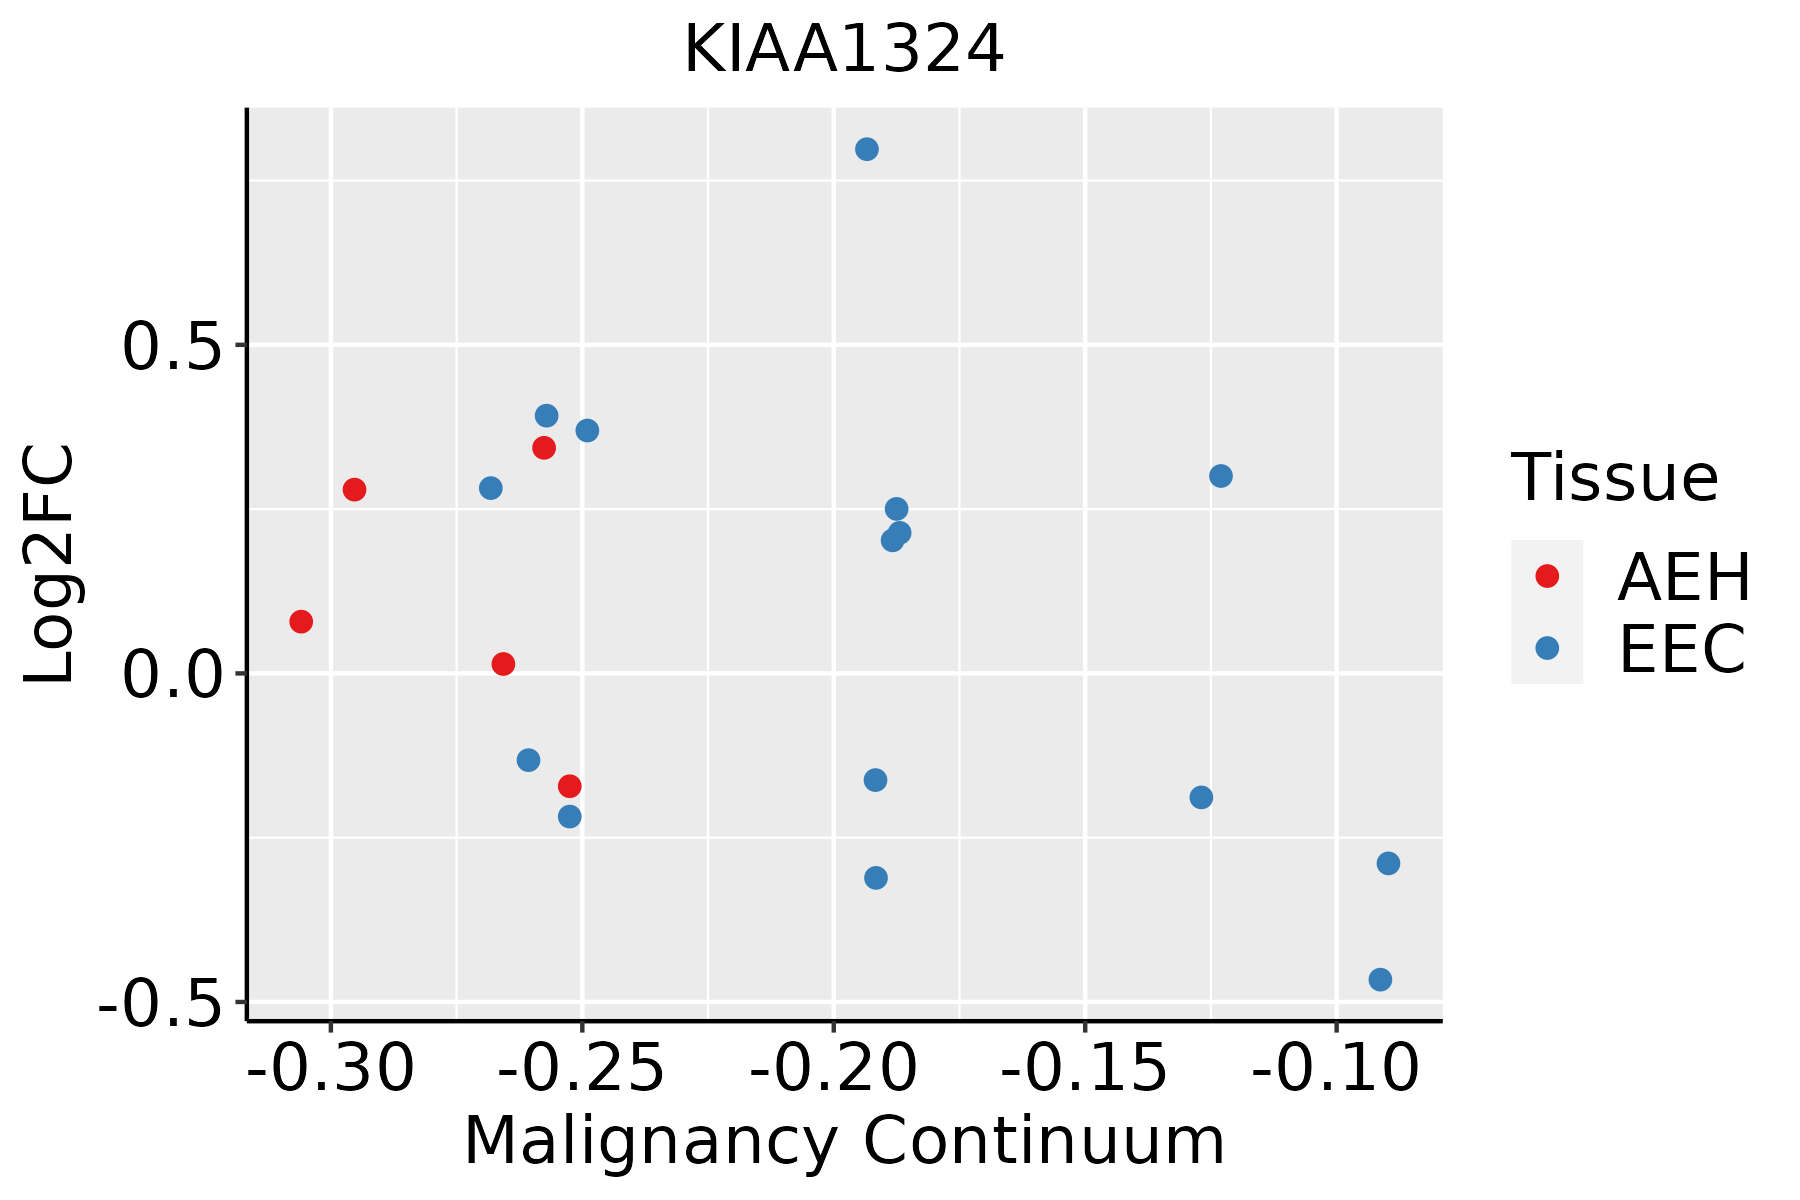 | AEH: Atypical endometrial hyperplasia |
| EEC: Endometrioid Cancer | ||
| Esophagus | 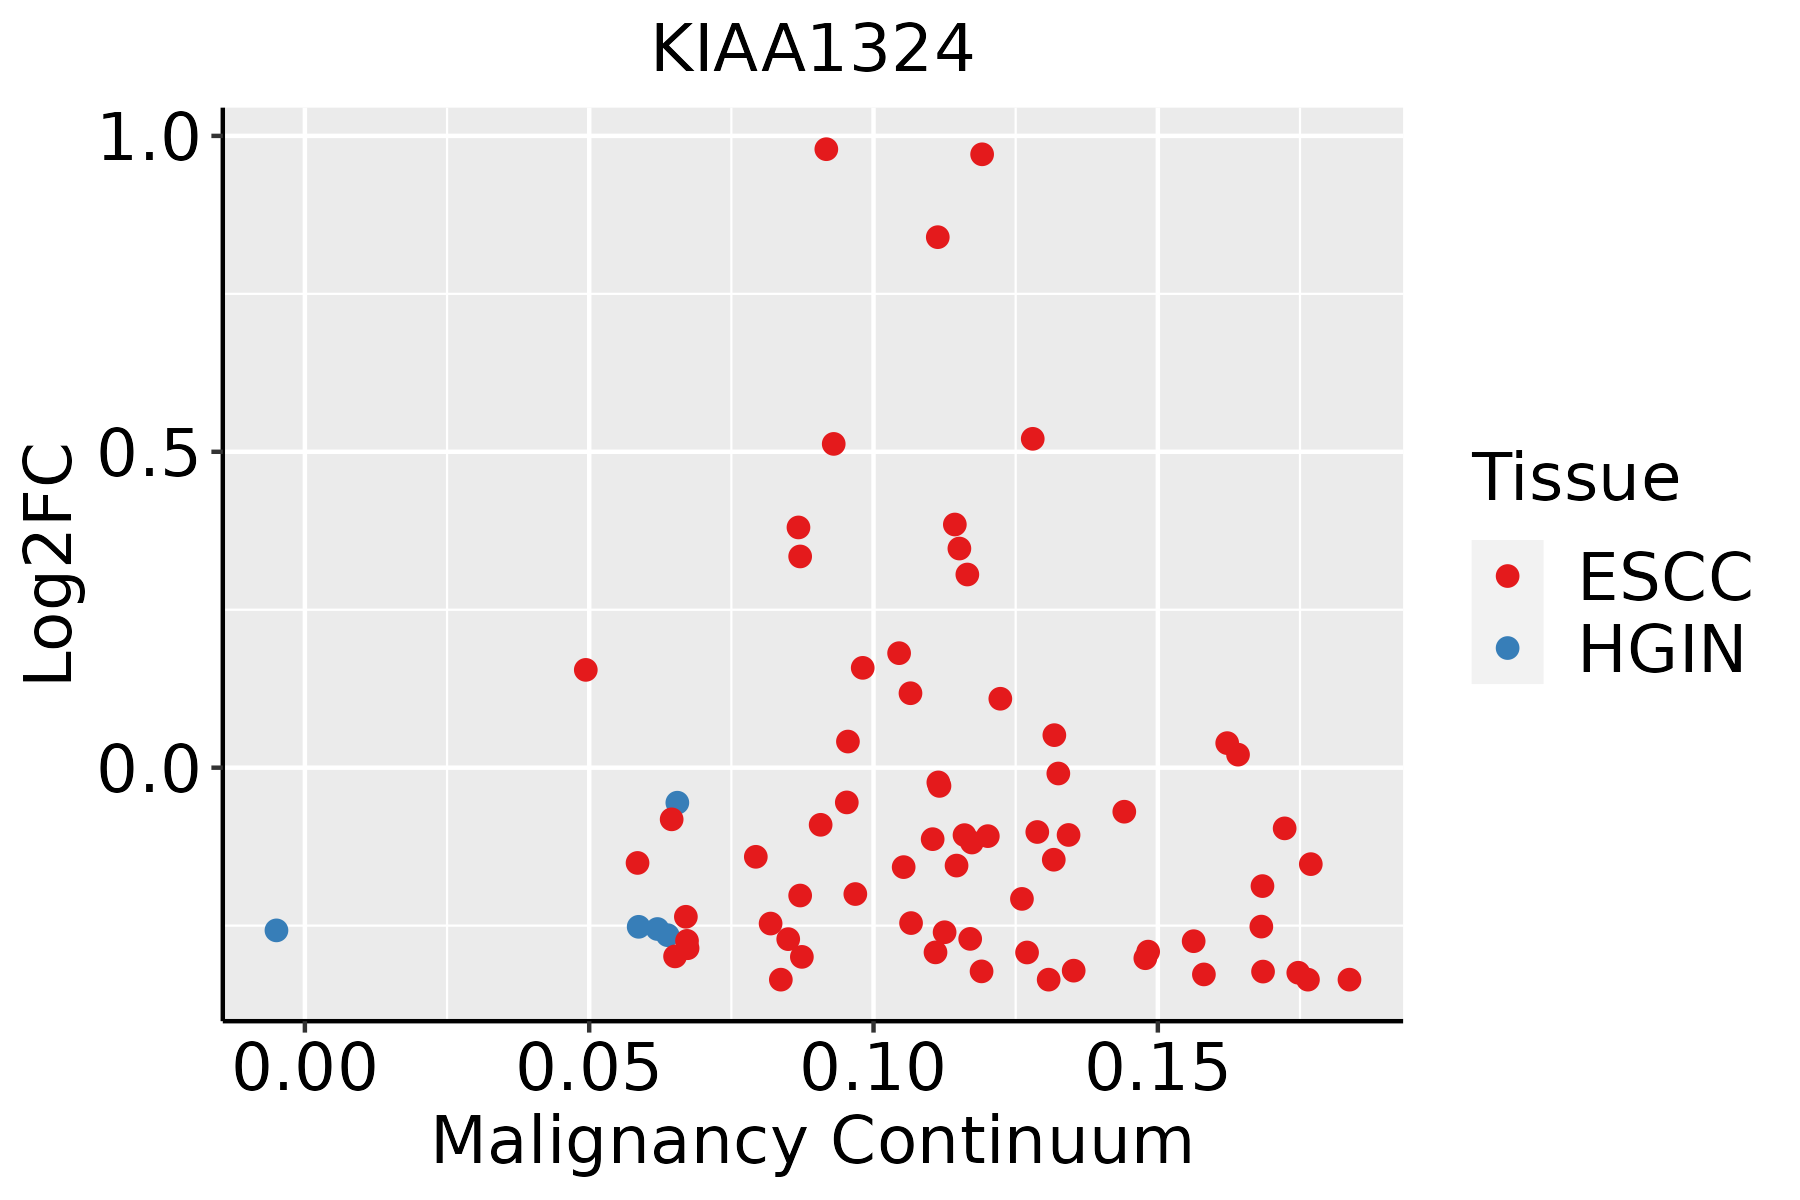 | ESCC: Esophageal squamous cell carcinoma |
| HGIN: High-grade intraepithelial neoplasias | ||
| LGIN: Low-grade intraepithelial neoplasias | ||
| Liver | 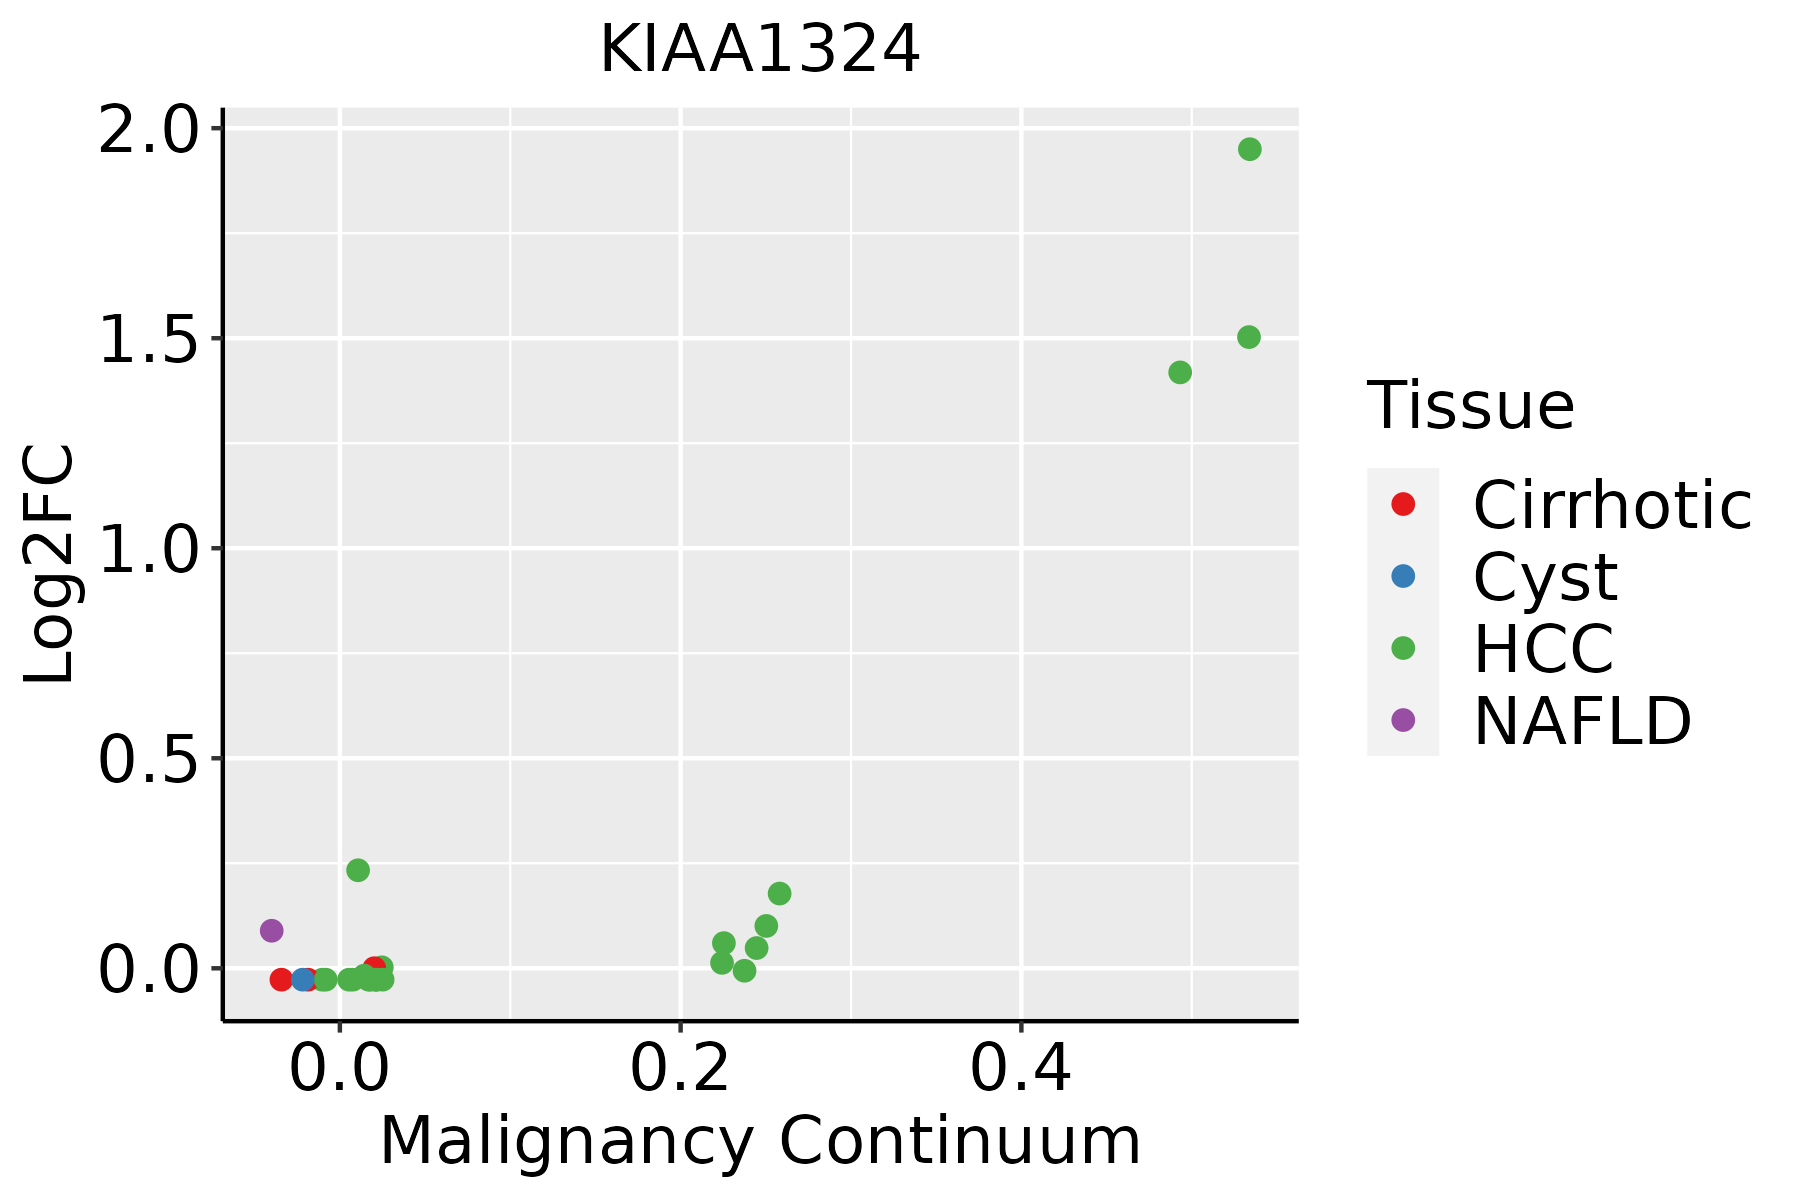 | HCC: Hepatocellular carcinoma |
| NAFLD: Non-alcoholic fatty liver disease | ||
| Oral Cavity | 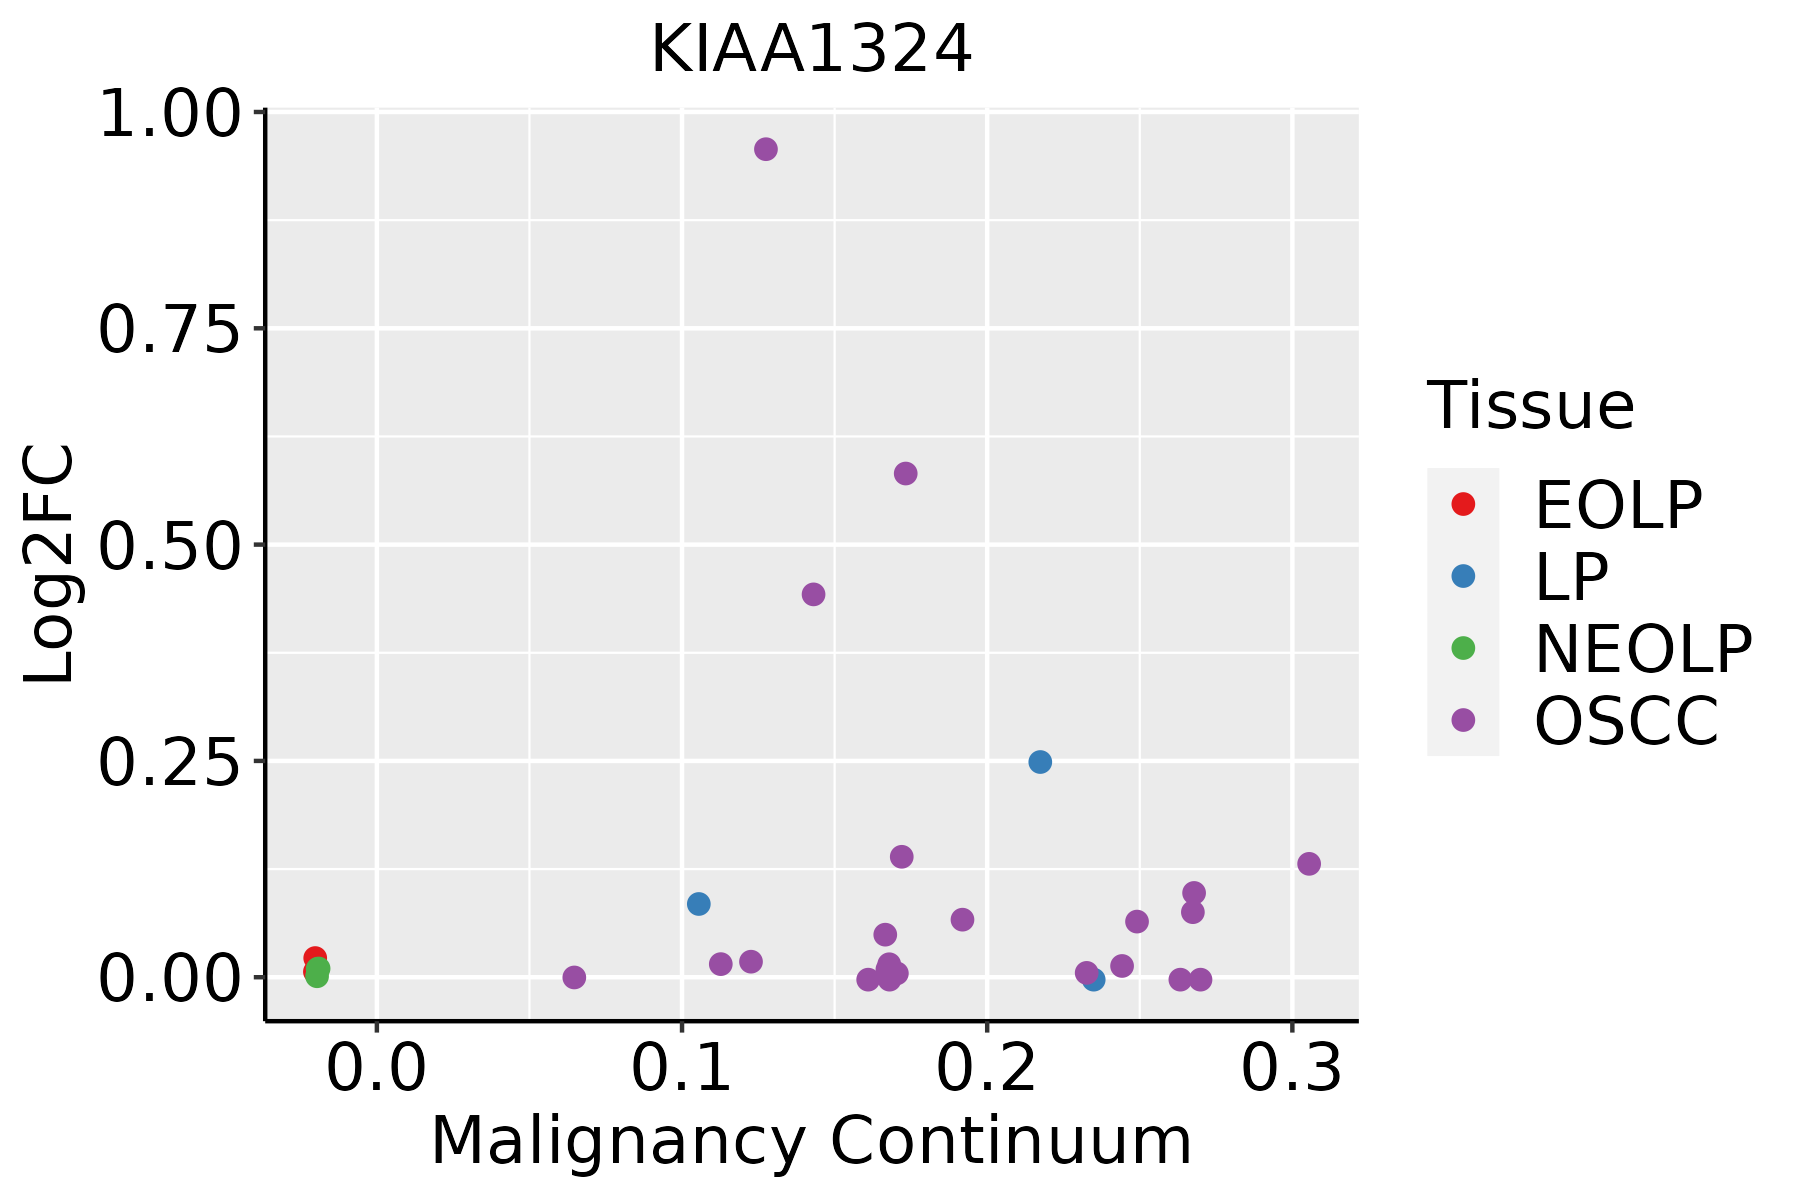 | EOLP: Erosive Oral lichen planus |
| LP: leukoplakia | ||
| NEOLP: Non-erosive oral lichen planus | ||
| OSCC: Oral squamous cell carcinoma |
| ∗log2FC in expression of this searched gene in stem-like cells from each diseased tissue sample relative to stem-like cells in normal samples in each tissue plotted against the malignancy continuum. Samples are colored based on if they are from different disease stage. |
Top |
Malignant transformation related pathway analysis |
| Find out the enriched GO biological processes and KEGG pathways involved in transition from healthy to precancer to cancer |
| Tissue | Disease Stage | Enriched GO biological Processes |
| Colorectum | AD |  |
| Colorectum | SER |  |
| Colorectum | MSS |  |
| Colorectum | MSI-H |  |
| Colorectum | FAP |  |
| ∗Top 15 enriched GO BP terms are showed in the bar plot of each disease state in each tissue. Each row represents a significant GO biological process which is colored according to the -log10(p.adjust). |
| Page: 1 2 3 4 5 6 7 8 9 |
| GO ID | Tissue | Disease Stage | Description | Gene Ratio | Bg Ratio | pvalue | p.adjust | Count |
| Page: 1 |
| Pathway ID | Tissue | Disease Stage | Description | Gene Ratio | Bg Ratio | pvalue | p.adjust | qvalue | Count |
| Page: 1 |
Top |
Cell-cell communication analysis |
| Identification of potential cell-cell interactions between two cell types and their ligand-receptor pairs for different disease states |
| Ligand | Receptor | LRpair | Pathway | Tissue | Disease Stage |
| Page: 1 |
Top |
Single-cell gene regulatory network inference analysis |
| Find out the significant the regulons (TFs) and the target genes of each regulon across cell types for different disease states |
| TF | Cell Type | Tissue | Disease Stage | Target Gene | RSS | Regulon Activity |
| ∗The dot plots of a searched regulon are shown for all cell subpopulations in each disease state of each tissue based on the regulon specific score inferred using pySCENIC and by calculating the average expression. |
| Page: 1 |
Top |
Somatic mutation of malignant transformation related genes |
| Annotation of somatic variants for genes involved in malignant transformation |
| Hugo Symbol | Variant Class | Variant Classification | dbSNP RS | HGVSc | HGVSp | HGVSp Short | SWISSPROT | BIOTYPE | SIFT | PolyPhen | Tumor Sample Barcode | Tissue | Histology | Sex | Age | Stage | Therapy Types | Drugs | Outcome |
| KIAA1324 | SNV | Missense_Mutation | novel | c.1919N>T | p.Pro640Leu | p.P640L | Q6UXG2 | protein_coding | deleterious(0) | benign(0.246) | TCGA-A7-A3RF-01 | Breast | breast invasive carcinoma | Female | >=65 | I/II | Hormone Therapy | anastrozole | PD |
| KIAA1324 | SNV | Missense_Mutation | rs766619909 | c.2884N>A | p.Ala962Thr | p.A962T | Q6UXG2 | protein_coding | deleterious(0) | probably_damaging(0.998) | TCGA-A8-A09Z-01 | Breast | breast invasive carcinoma | Female | >=65 | I/II | Unknown | Unknown | SD |
| KIAA1324 | SNV | Missense_Mutation | novel | c.952N>C | p.Glu318Gln | p.E318Q | Q6UXG2 | protein_coding | tolerated(0.26) | benign(0.162) | TCGA-AC-A8OP-01 | Breast | breast invasive carcinoma | Female | >=65 | I/II | Unknown | Unknown | SD |
| KIAA1324 | SNV | Missense_Mutation | c.557N>G | p.Ser186Cys | p.S186C | Q6UXG2 | protein_coding | deleterious(0.01) | probably_damaging(0.936) | TCGA-BH-A1F8-01 | Breast | breast invasive carcinoma | Female | >=65 | III/IV | Unknown | Unknown | PD | |
| KIAA1324 | SNV | Missense_Mutation | c.2825N>G | p.Ser942Cys | p.S942C | Q6UXG2 | protein_coding | deleterious(0.02) | probably_damaging(0.999) | TCGA-EW-A1PB-01 | Breast | breast invasive carcinoma | Female | >=65 | III/IV | Unknown | Unknown | SD | |
| KIAA1324 | SNV | Missense_Mutation | novel | c.2111G>C | p.Cys704Ser | p.C704S | Q6UXG2 | protein_coding | deleterious(0) | probably_damaging(0.998) | TCGA-JL-A3YW-01 | Breast | breast invasive carcinoma | Female | <65 | I/II | Unknown | Unknown | SD |
| KIAA1324 | insertion | Frame_Shift_Ins | novel | c.104_105insTTGGGAAATTGCGG | p.Phe36TrpfsTer8 | p.F36Wfs*8 | Q6UXG2 | protein_coding | TCGA-A2-A0CP-01 | Breast | breast invasive carcinoma | Female | <65 | I/II | Chemotherapy | cytoxan | SD | ||
| KIAA1324 | insertion | Nonsense_Mutation | novel | c.106_107insAAGGCAAACTCCTCGCTTAAACTCGGA | p.Phe36delinsTer | p.F36delins* | Q6UXG2 | protein_coding | TCGA-A2-A0CP-01 | Breast | breast invasive carcinoma | Female | <65 | I/II | Chemotherapy | cytoxan | SD | ||
| KIAA1324 | insertion | Frame_Shift_Ins | novel | c.1413_1414insACTAAATTCAGGAGAAGAGAGGTCAGGGCTGGCCTCGTCTG | p.Leu472ThrfsTer28 | p.L472Tfs*28 | Q6UXG2 | protein_coding | TCGA-A2-A0EV-01 | Breast | breast invasive carcinoma | Female | >=65 | I/II | Unknown | Unknown | SD | ||
| KIAA1324 | insertion | Frame_Shift_Ins | novel | c.2231_2232insC | p.Glu747ArgfsTer18 | p.E747Rfs*18 | Q6UXG2 | protein_coding | TCGA-A8-A09Z-01 | Breast | breast invasive carcinoma | Female | >=65 | I/II | Unknown | Unknown | SD |
| Page: 1 2 3 4 5 6 7 8 9 |
Top |
Related drugs of malignant transformation related genes |
| Identification of chemicals and drugs interact with genes involved in malignant transfromation |
| (DGIdb 4.0) |
| Entrez ID | Symbol | Category | Interaction Types | Drug Claim Name | Drug Name | PMIDs |
| Page: 1 |

Copyright 2023-Present -The University of Texas Health Science Center at Houston |