
|
|||||
|
 | |
| |
| |
| |
| |
| |
|
Gene: KIAA1217 |
Gene summary for KIAA1217 |
| Gene information | Species | Human | Gene symbol | KIAA1217 | Gene ID | 56243 |
| Gene name | KIAA1217 | |
| Gene Alias | ETL4 | |
| Cytomap | 10p12.2-p12.1 | |
| Gene Type | protein-coding | GO ID | GO:0001501 | UniProtAcc | Q5T5P2 |
Top |
Malignant transformation analysis |
| Identification of the aberrant gene expression in precancerous and cancerous lesions by comparing the gene expression of stem-like cells in diseased tissues with normal stem cells |
| Entrez ID | Symbol | Replicates | Species | Organ | Tissue | Adj P-value | Log2FC | Malignancy |
| 56243 | KIAA1217 | CA_HPV_1 | Human | Cervix | CC | 6.12e-10 | -3.04e-01 | 0.0264 |
| 56243 | KIAA1217 | CA_HPV_3 | Human | Cervix | CC | 4.97e-03 | 1.90e-02 | 0.0414 |
| 56243 | KIAA1217 | HSIL_HPV_1 | Human | Cervix | HSIL_HPV | 3.90e-02 | -2.12e-01 | 0.0116 |
| 56243 | KIAA1217 | N_HPV_1 | Human | Cervix | N_HPV | 2.96e-04 | -2.61e-01 | 0.0079 |
| 56243 | KIAA1217 | CCI_1 | Human | Cervix | CC | 1.27e-16 | 1.72e+00 | 0.528 |
| 56243 | KIAA1217 | CCI_2 | Human | Cervix | CC | 3.47e-22 | 2.79e+00 | 0.5249 |
| 56243 | KIAA1217 | CCI_3 | Human | Cervix | CC | 5.43e-31 | 2.33e+00 | 0.516 |
| 56243 | KIAA1217 | HTA11_347_2000001011 | Human | Colorectum | AD | 9.23e-10 | 6.01e-01 | -0.1954 |
| 56243 | KIAA1217 | HTA11_411_2000001011 | Human | Colorectum | SER | 2.75e-09 | 1.01e+00 | -0.2602 |
| 56243 | KIAA1217 | HTA11_4255_2000001011 | Human | Colorectum | SER | 1.66e-04 | 6.57e-01 | 0.0446 |
| 56243 | KIAA1217 | HTA11_7663_2000001011 | Human | Colorectum | SER | 2.93e-13 | 9.00e-01 | 0.0131 |
| 56243 | KIAA1217 | HTA11_10711_2000001011 | Human | Colorectum | AD | 6.37e-03 | 4.67e-01 | 0.0338 |
| 56243 | KIAA1217 | HTA11_6818_2000001011 | Human | Colorectum | AD | 1.51e-02 | 5.34e-01 | 0.0112 |
| 56243 | KIAA1217 | HTA11_99999965062_69753 | Human | Colorectum | MSI-H | 1.59e-03 | 7.68e-01 | 0.3487 |
| 56243 | KIAA1217 | HTA11_99999965104_69814 | Human | Colorectum | MSS | 1.21e-03 | 4.59e-01 | 0.281 |
| 56243 | KIAA1217 | HTA11_99999971662_82457 | Human | Colorectum | MSS | 2.83e-03 | 7.20e-01 | 0.3859 |
| 56243 | KIAA1217 | A015-C-203 | Human | Colorectum | FAP | 9.40e-31 | -3.77e-01 | -0.1294 |
| 56243 | KIAA1217 | A002-C-201 | Human | Colorectum | FAP | 9.32e-11 | -4.09e-01 | 0.0324 |
| 56243 | KIAA1217 | A001-C-119 | Human | Colorectum | FAP | 5.96e-10 | 2.84e-01 | -0.1557 |
| 56243 | KIAA1217 | A001-C-108 | Human | Colorectum | FAP | 2.90e-18 | 2.18e-01 | -0.0272 |
| Page: 1 2 3 4 5 6 7 8 9 10 11 12 |
| Tissue | Expression Dynamics | Abbreviation |
| Cervix | 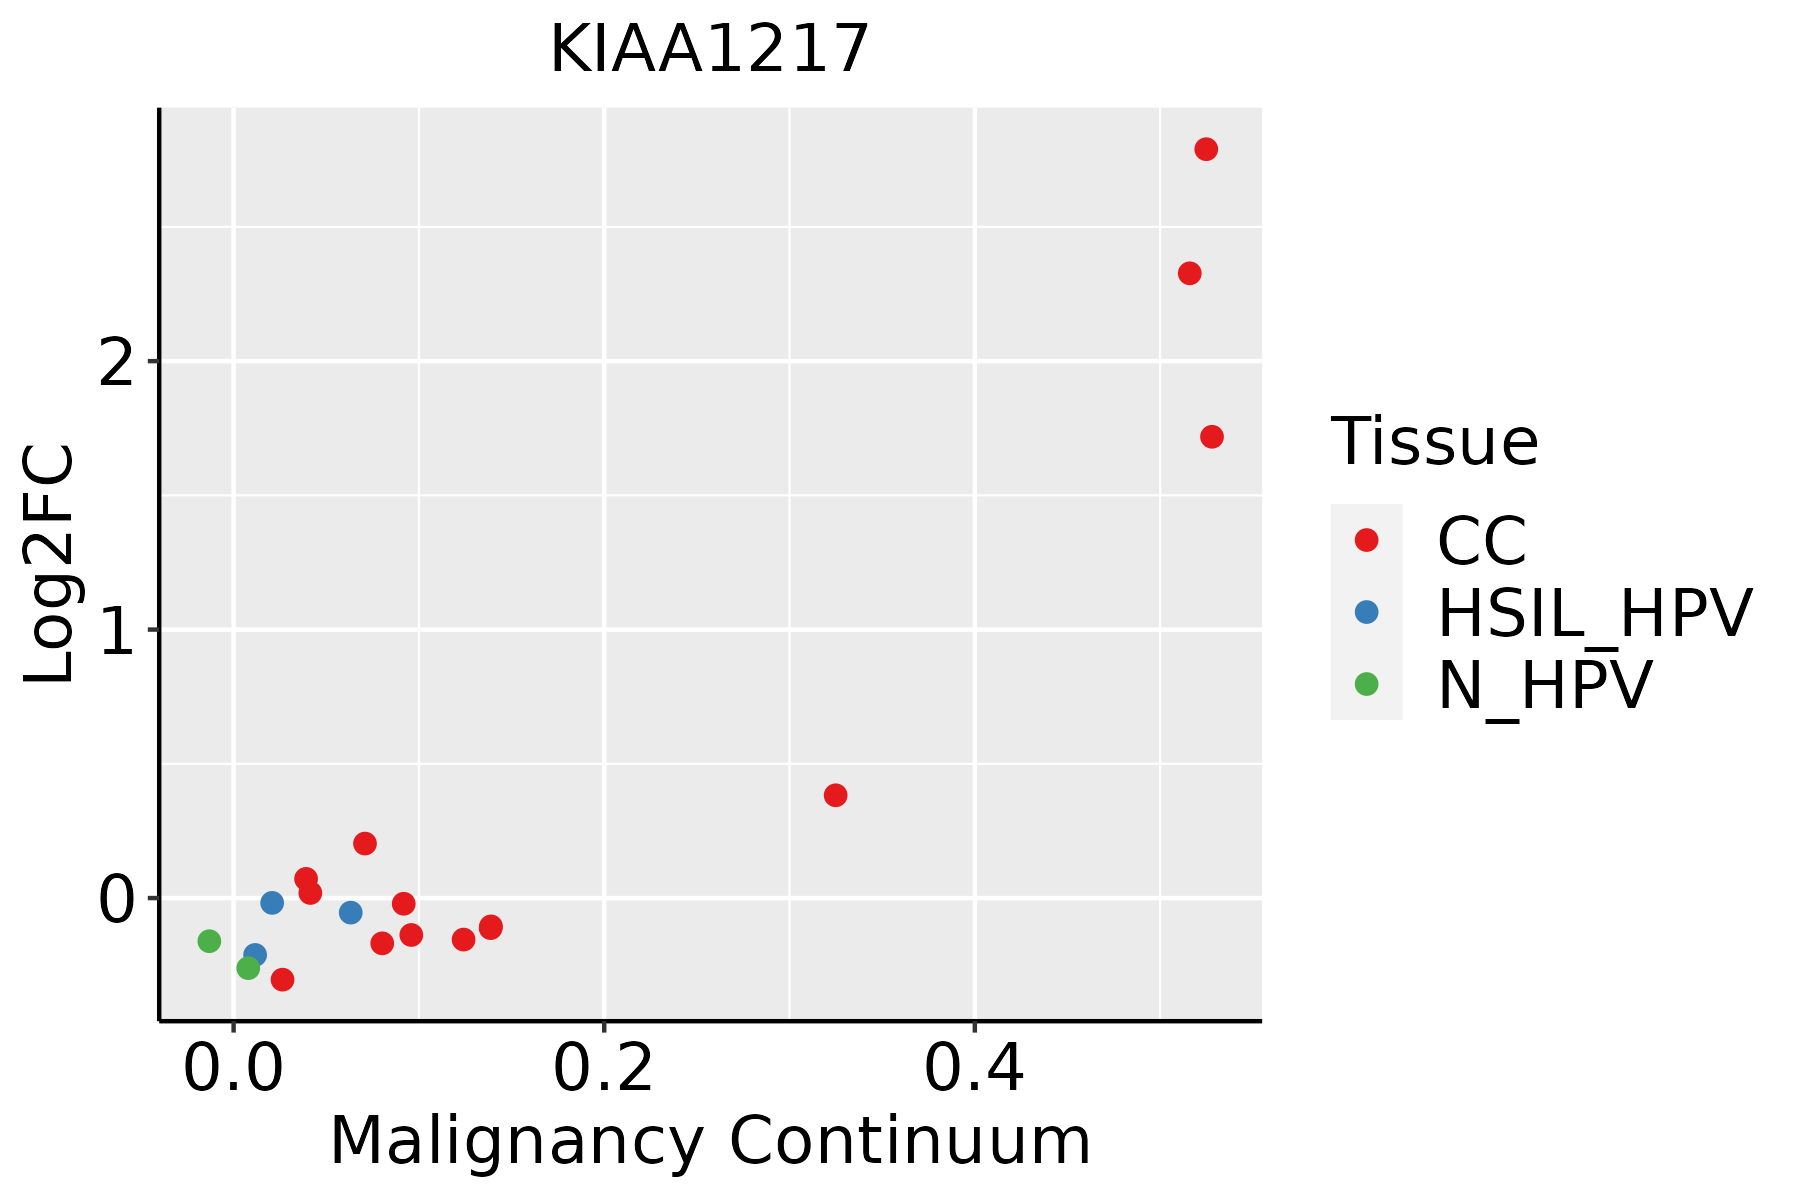 | CC: Cervix cancer |
| HSIL_HPV: HPV-infected high-grade squamous intraepithelial lesions | ||
| N_HPV: HPV-infected normal cervix | ||
| Colorectum (GSE201348) |  | FAP: Familial adenomatous polyposis |
| CRC: Colorectal cancer | ||
| Colorectum (HTA11) |  | AD: Adenomas |
| SER: Sessile serrated lesions | ||
| MSI-H: Microsatellite-high colorectal cancer | ||
| MSS: Microsatellite stable colorectal cancer | ||
| Endometrium | 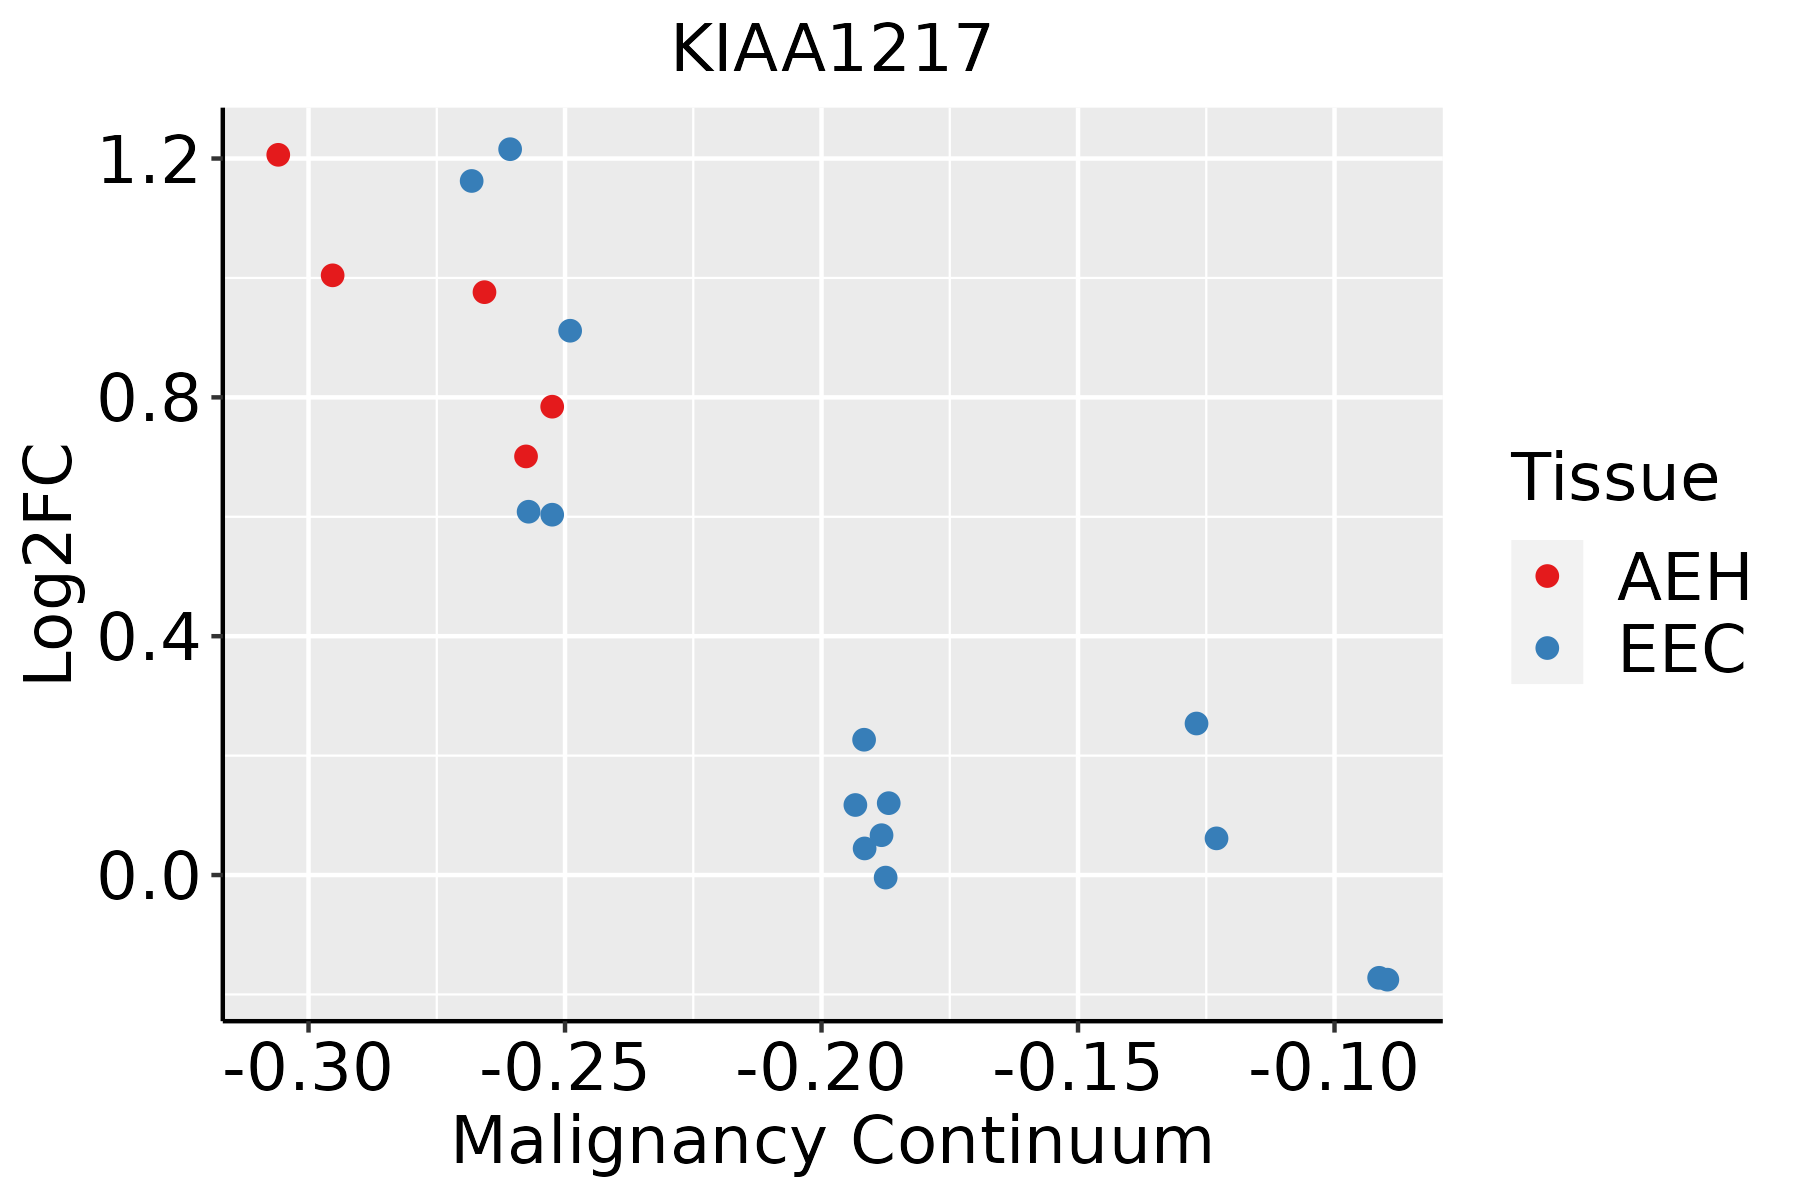 | AEH: Atypical endometrial hyperplasia |
| EEC: Endometrioid Cancer | ||
| Esophagus | 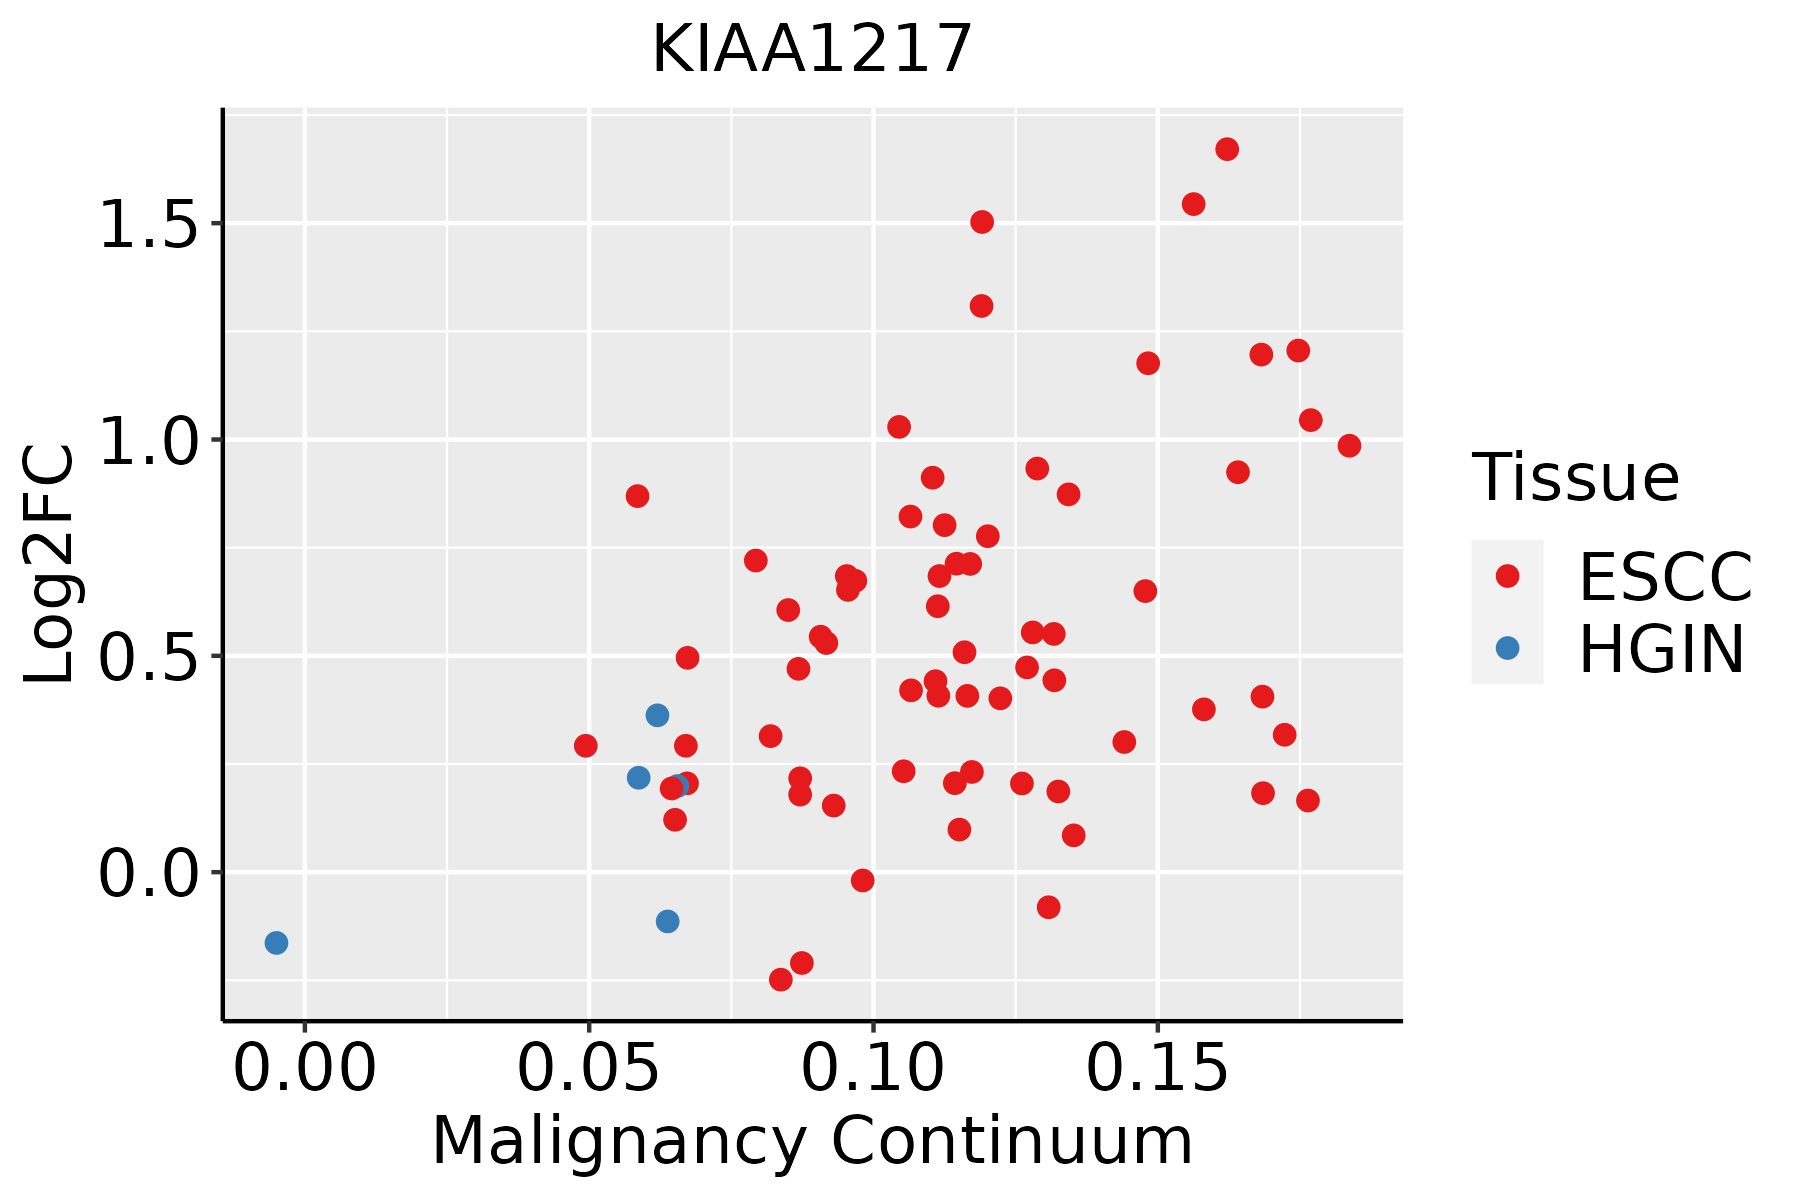 | ESCC: Esophageal squamous cell carcinoma |
| HGIN: High-grade intraepithelial neoplasias | ||
| LGIN: Low-grade intraepithelial neoplasias | ||
| GC | 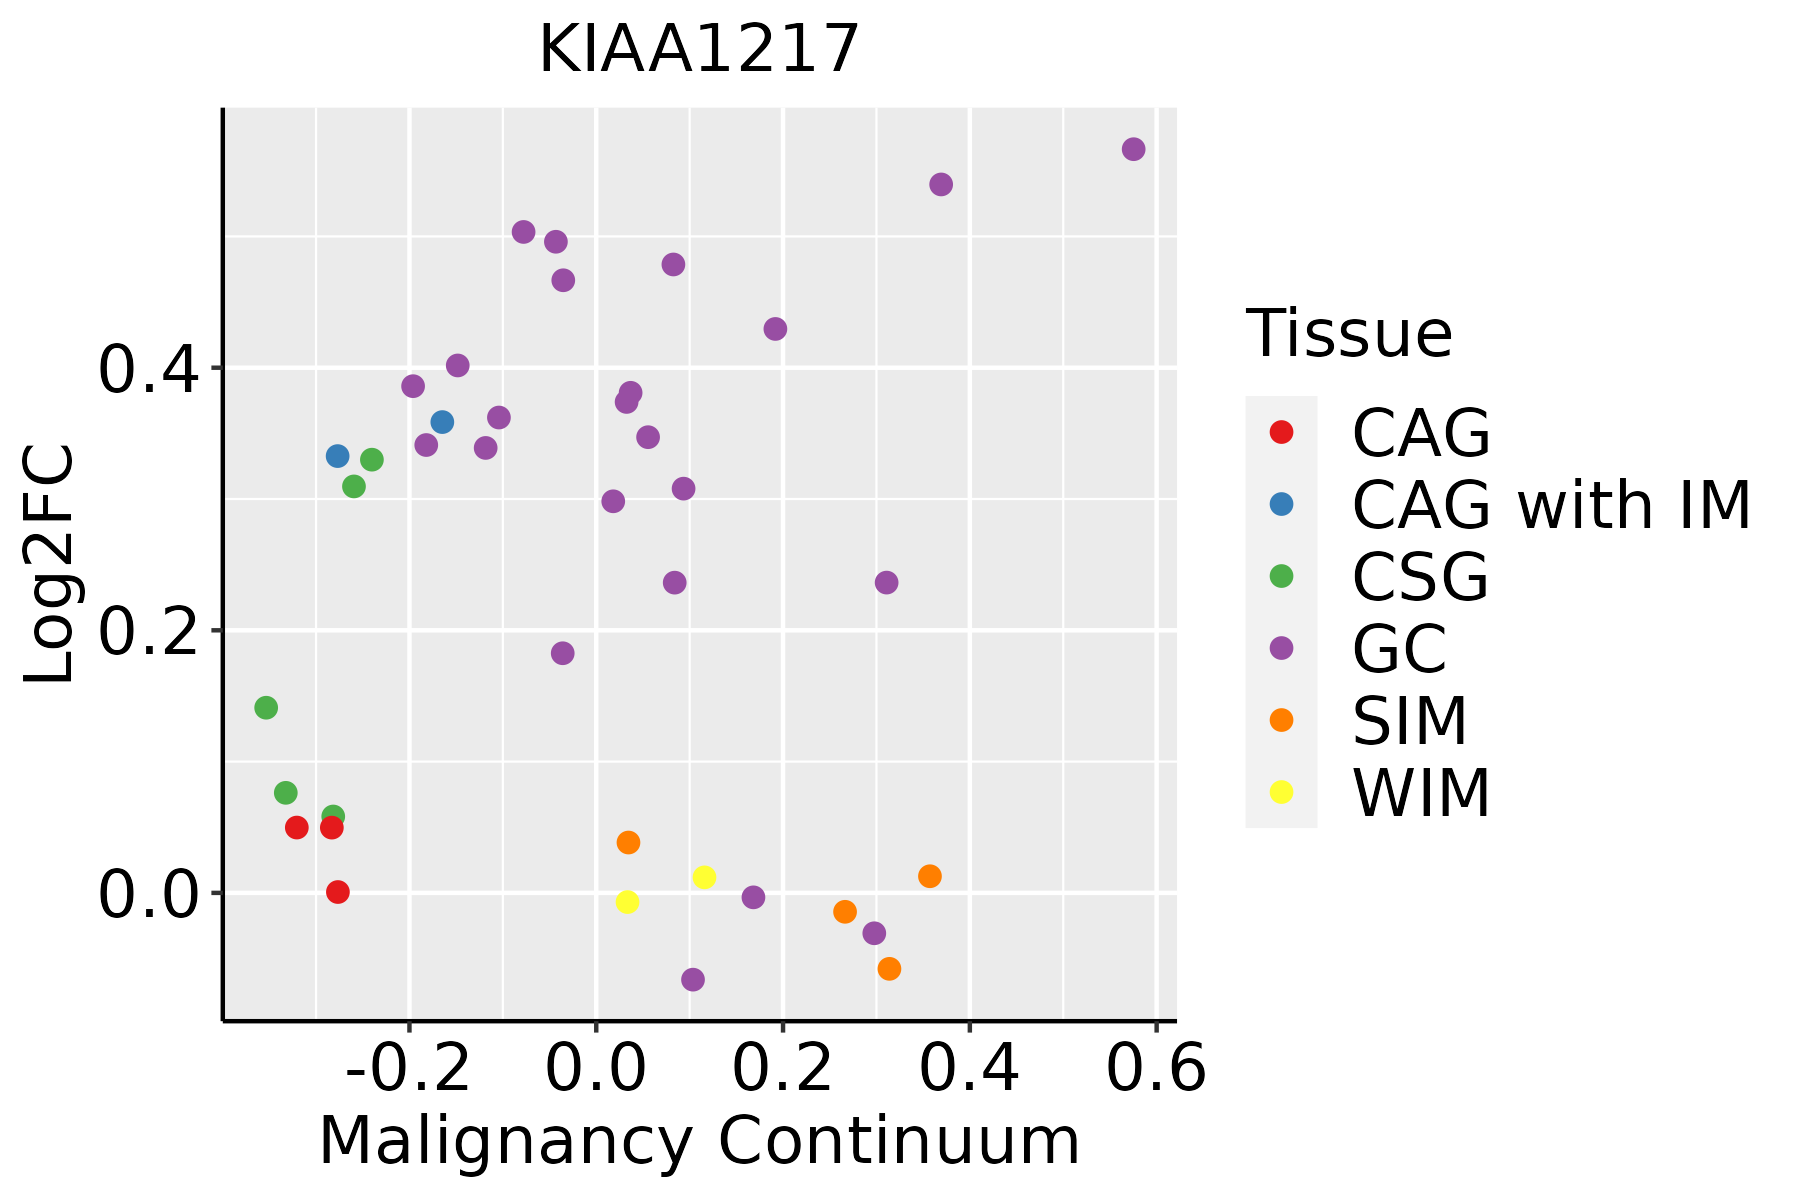 | CAG: Chronic atrophic gastritis |
| CAG with IM: Chronic atrophic gastritis with intestinal metaplasia | ||
| CSG: Chronic superficial gastritis | ||
| GC: Gastric cancer | ||
| SIM: Severe intestinal metaplasia | ||
| WIM: Wild intestinal metaplasia | ||
| Liver | 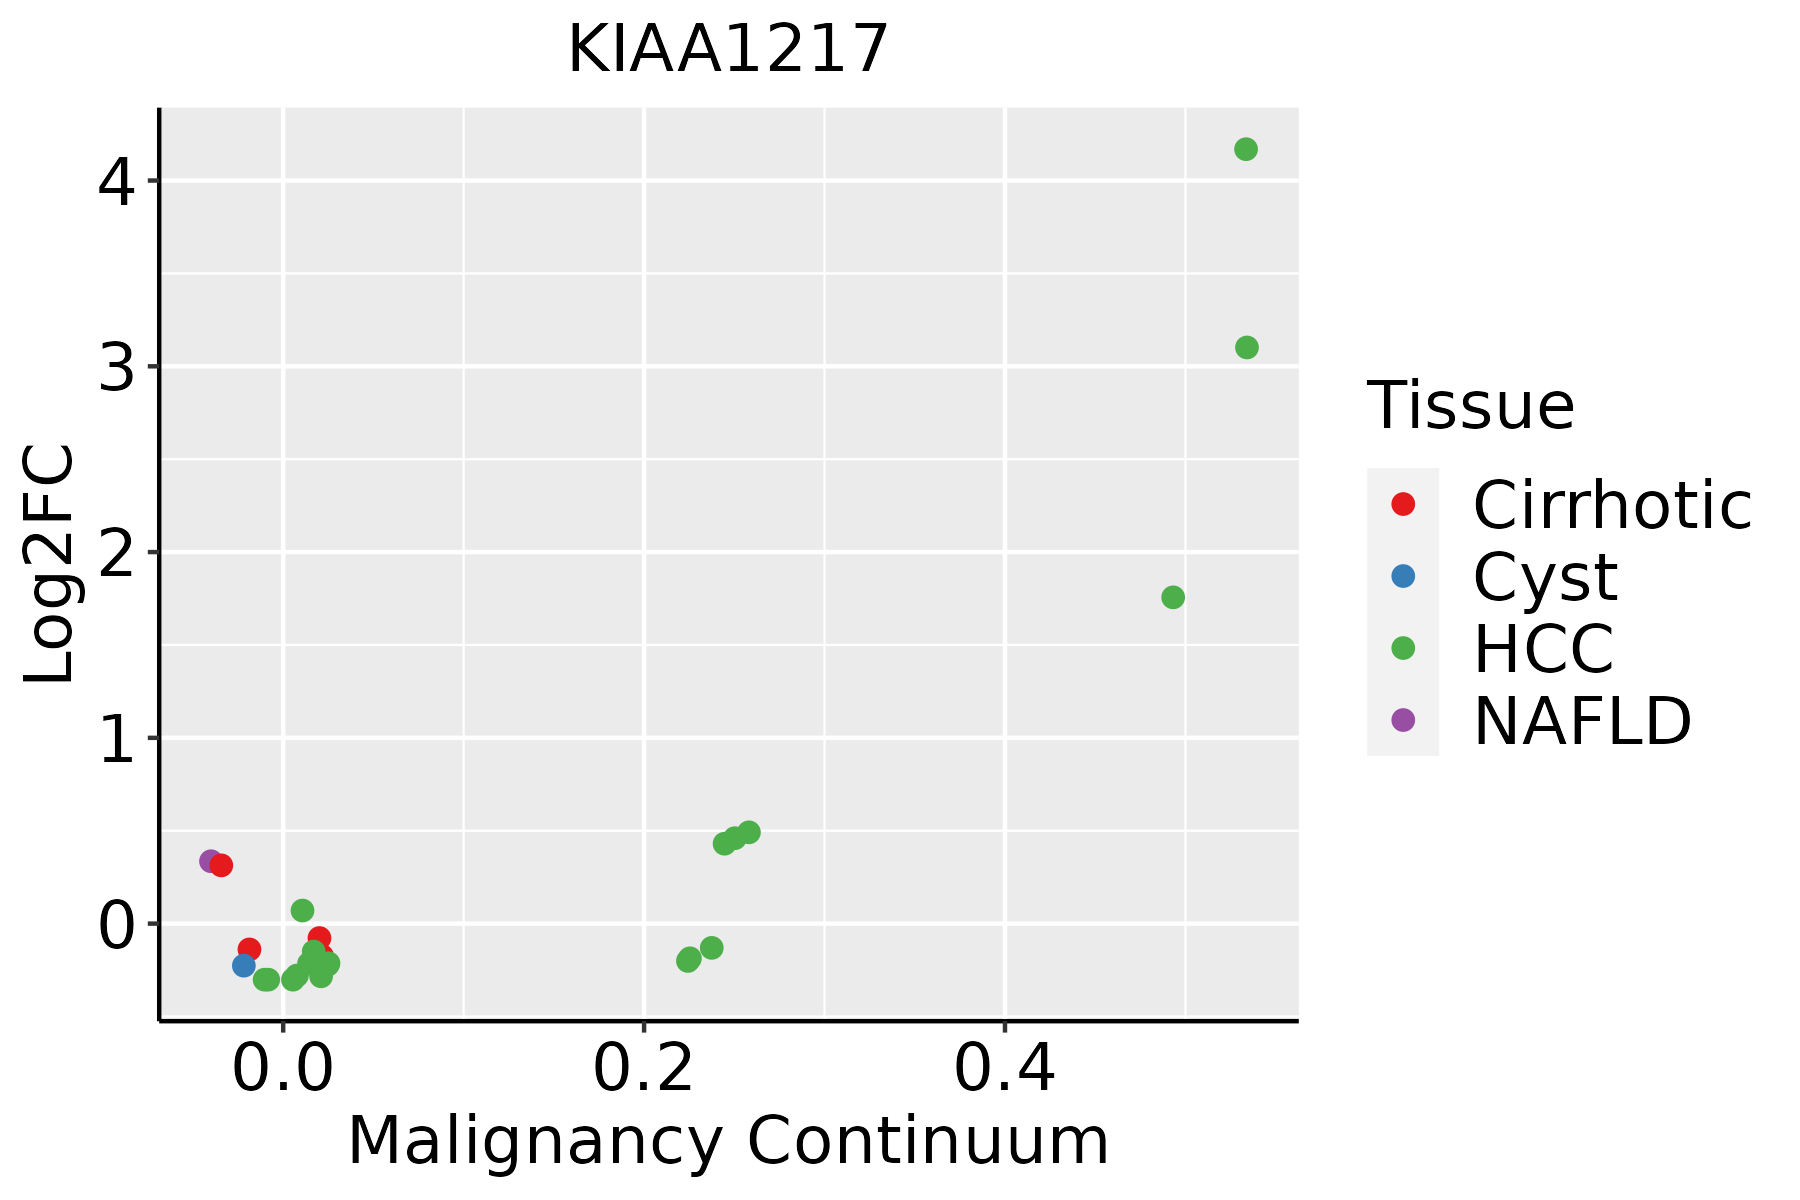 | HCC: Hepatocellular carcinoma |
| NAFLD: Non-alcoholic fatty liver disease | ||
| Lung | 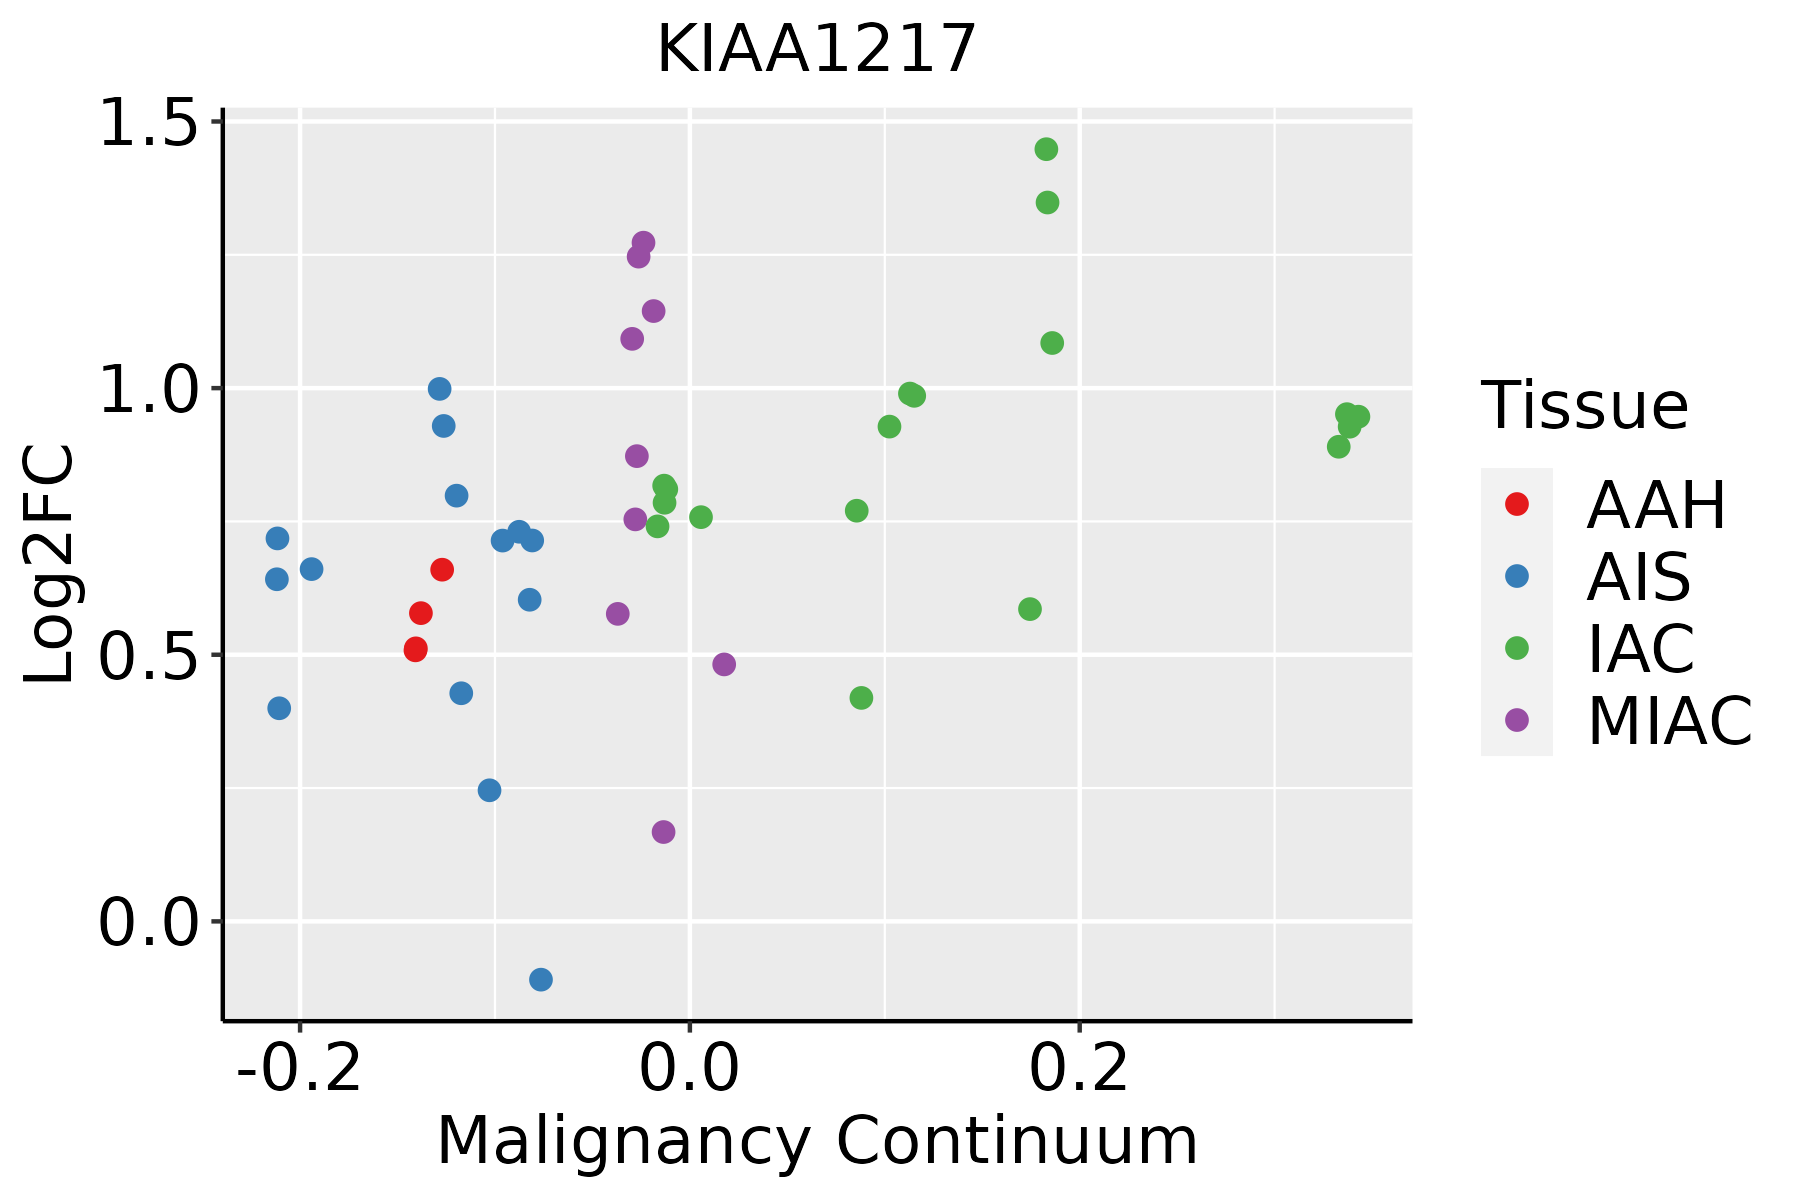 | AAH: Atypical adenomatous hyperplasia |
| AIS: Adenocarcinoma in situ | ||
| IAC: Invasive lung adenocarcinoma | ||
| MIA: Minimally invasive adenocarcinoma | ||
| Oral Cavity | 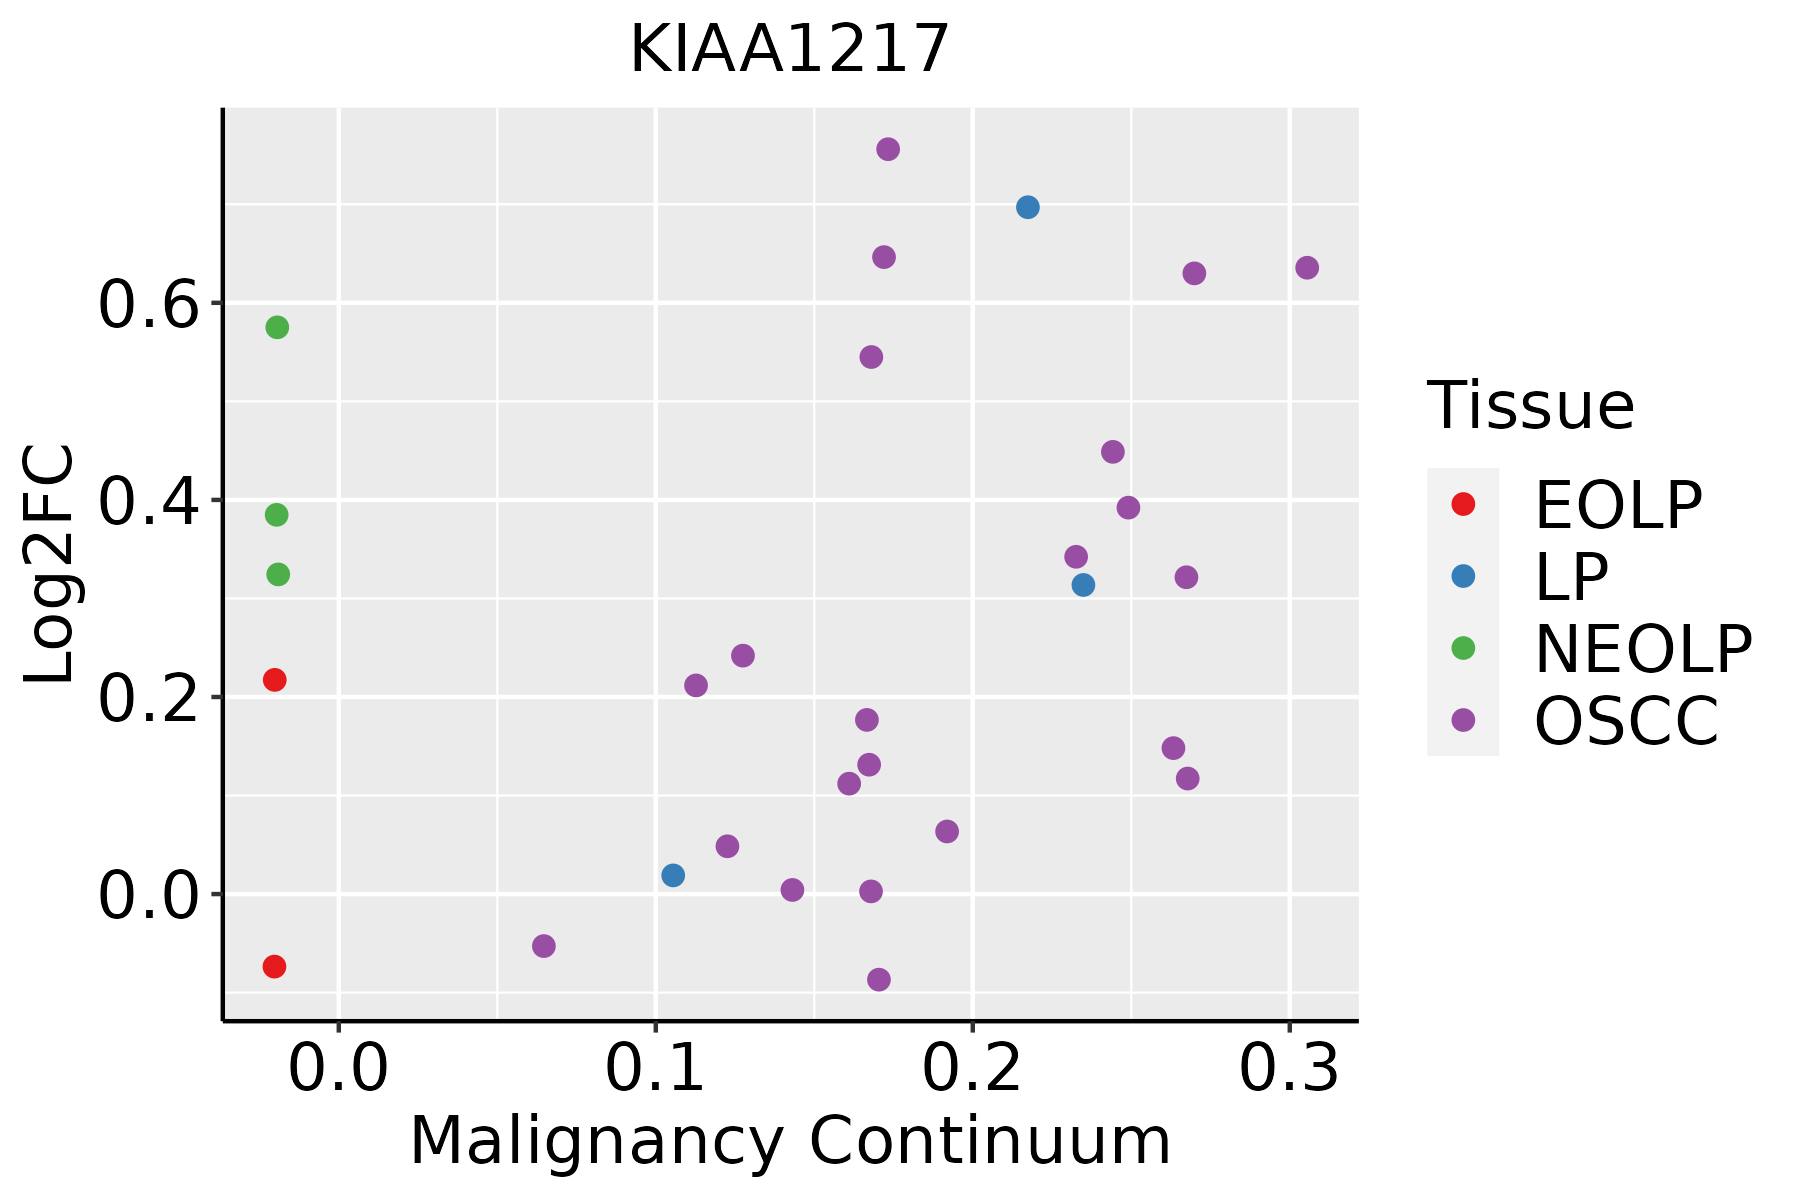 | EOLP: Erosive Oral lichen planus |
| LP: leukoplakia | ||
| NEOLP: Non-erosive oral lichen planus | ||
| OSCC: Oral squamous cell carcinoma | ||
| Prostate | 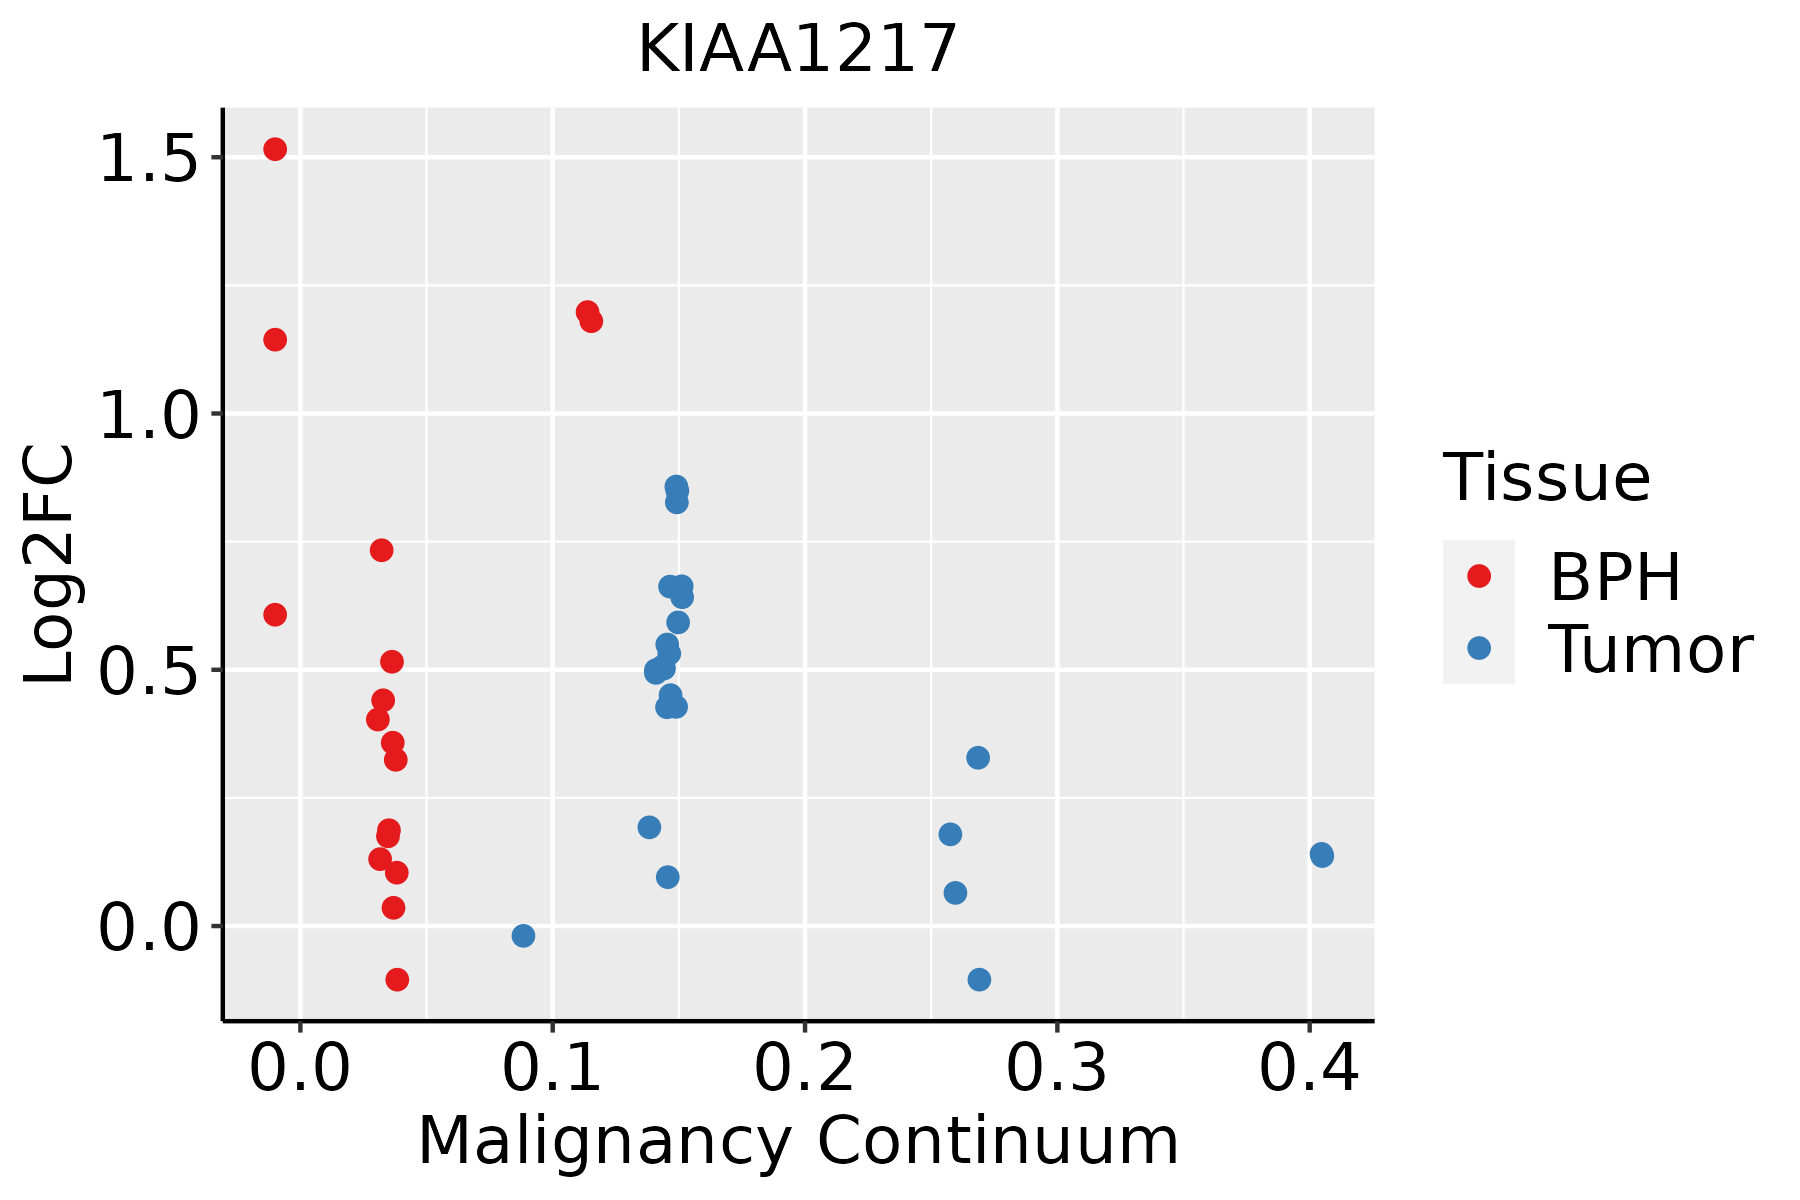 | BPH: Benign Prostatic Hyperplasia |
| Skin |  | AK: Actinic keratosis |
| cSCC: Cutaneous squamous cell carcinoma | ||
| SCCIS:squamous cell carcinoma in situ | ||
| Thyroid | 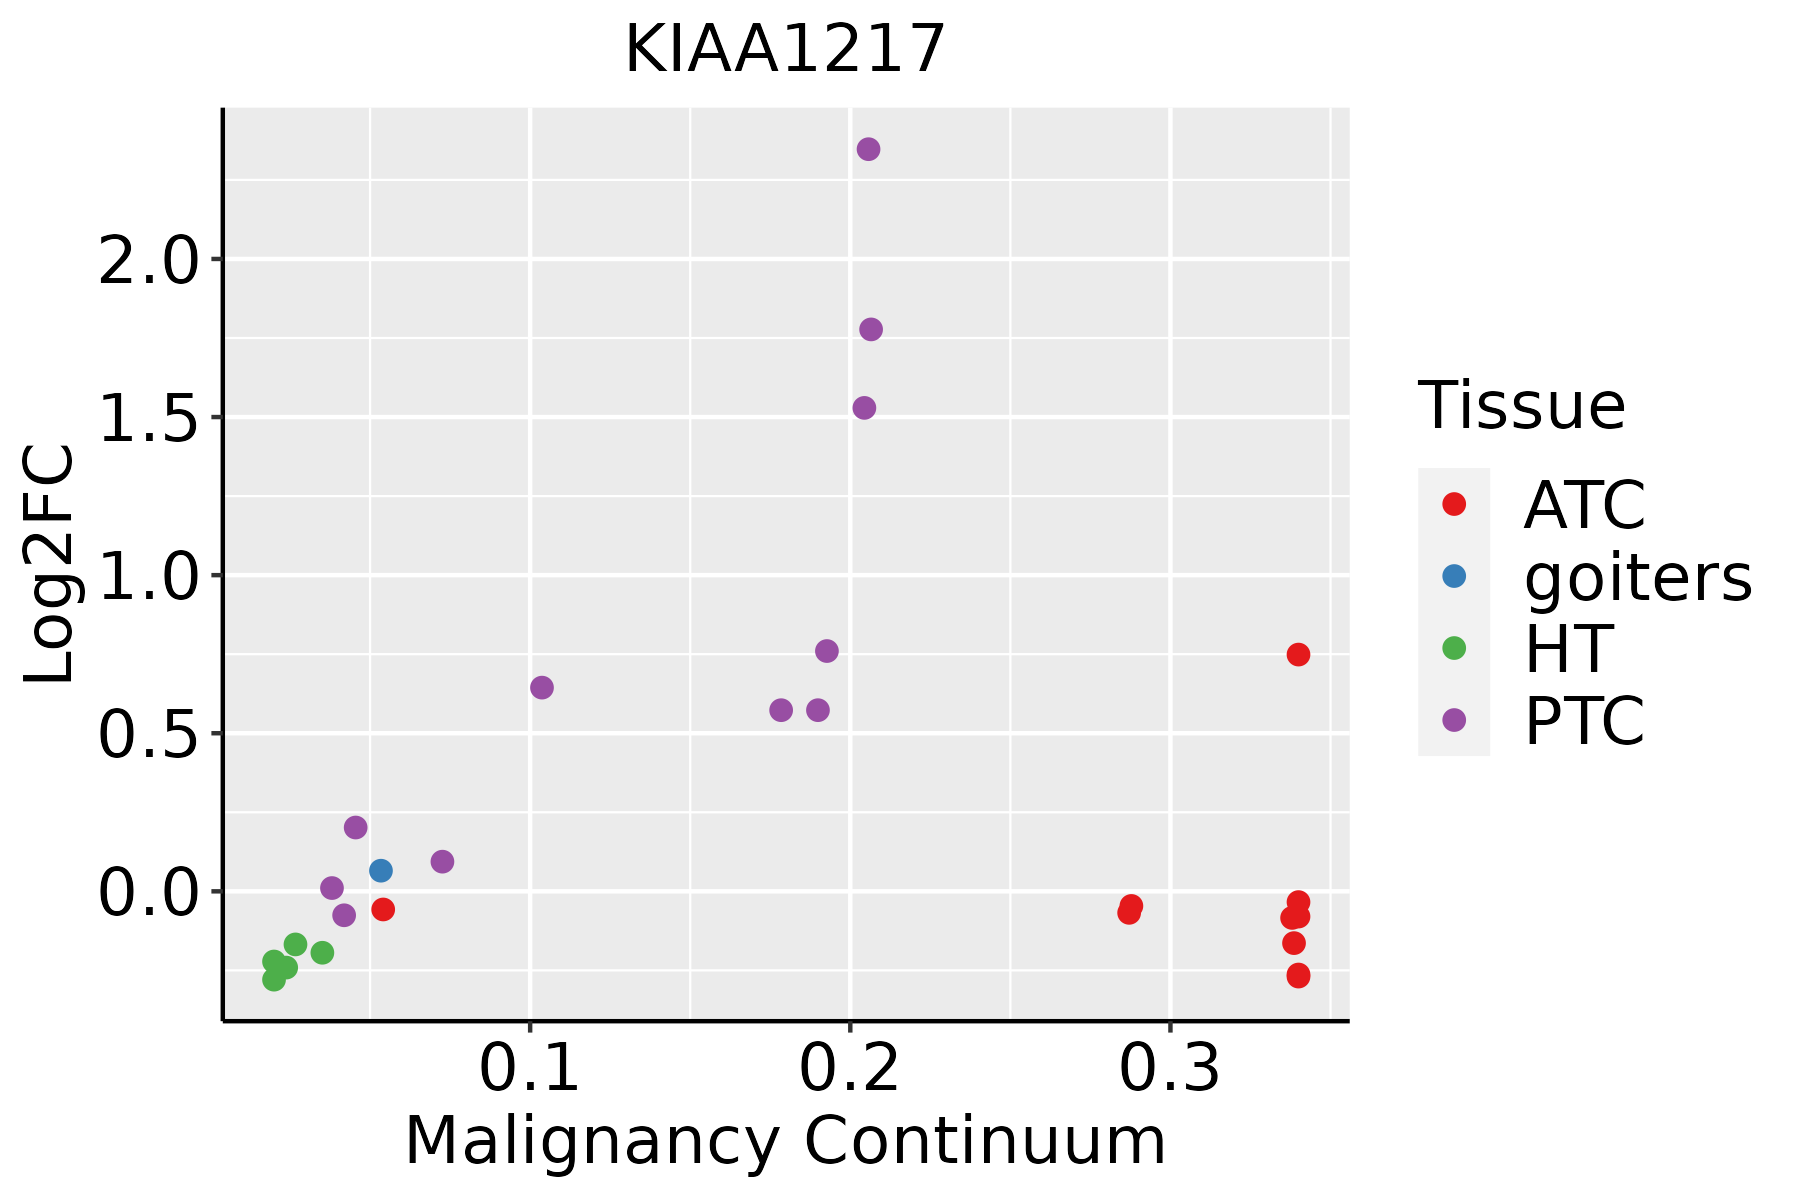 | ATC: Anaplastic thyroid cancer |
| HT: Hashimoto's thyroiditis | ||
| PTC: Papillary thyroid cancer |
| ∗log2FC in expression of this searched gene in stem-like cells from each diseased tissue sample relative to stem-like cells in normal samples in each tissue plotted against the malignancy continuum. Samples are colored based on if they are from different disease stage. |
Top |
Malignant transformation related pathway analysis |
| Find out the enriched GO biological processes and KEGG pathways involved in transition from healthy to precancer to cancer |
| Tissue | Disease Stage | Enriched GO biological Processes |
| Colorectum | AD |  |
| Colorectum | SER |  |
| Colorectum | MSS |  |
| Colorectum | MSI-H |  |
| Colorectum | FAP |  |
| ∗Top 15 enriched GO BP terms are showed in the bar plot of each disease state in each tissue. Each row represents a significant GO biological process which is colored according to the -log10(p.adjust). |
| Page: 1 2 3 4 5 6 7 8 9 |
| GO ID | Tissue | Disease Stage | Description | Gene Ratio | Bg Ratio | pvalue | p.adjust | Count |
| GO:0048706 | Colorectum | CRC | embryonic skeletal system development | 23/2078 | 121/18723 | 6.85e-03 | 4.81e-02 | 23 |
| Page: 1 |
| Pathway ID | Tissue | Disease Stage | Description | Gene Ratio | Bg Ratio | pvalue | p.adjust | qvalue | Count |
| Page: 1 |
Top |
Cell-cell communication analysis |
| Identification of potential cell-cell interactions between two cell types and their ligand-receptor pairs for different disease states |
| Ligand | Receptor | LRpair | Pathway | Tissue | Disease Stage |
| Page: 1 |
Top |
Single-cell gene regulatory network inference analysis |
| Find out the significant the regulons (TFs) and the target genes of each regulon across cell types for different disease states |
| TF | Cell Type | Tissue | Disease Stage | Target Gene | RSS | Regulon Activity |
| ∗The dot plots of a searched regulon are shown for all cell subpopulations in each disease state of each tissue based on the regulon specific score inferred using pySCENIC and by calculating the average expression. |
| Page: 1 |
Top |
Somatic mutation of malignant transformation related genes |
| Annotation of somatic variants for genes involved in malignant transformation |
| Hugo Symbol | Variant Class | Variant Classification | dbSNP RS | HGVSc | HGVSp | HGVSp Short | SWISSPROT | BIOTYPE | SIFT | PolyPhen | Tumor Sample Barcode | Tissue | Histology | Sex | Age | Stage | Therapy Types | Drugs | Outcome |
| KIAA1217 | SNV | Missense_Mutation | novel | c.4831N>T | p.Asp1611Tyr | p.D1611Y | Q5T5P2 | protein_coding | deleterious(0) | probably_damaging(1) | TCGA-A2-A25B-01 | Breast | breast invasive carcinoma | Female | <65 | I/II | Chemotherapy | taxotere | PD |
| KIAA1217 | SNV | Missense_Mutation | c.2287N>C | p.Glu763Gln | p.E763Q | Q5T5P2 | protein_coding | deleterious(0) | probably_damaging(0.995) | TCGA-A7-A4SA-01 | Breast | breast invasive carcinoma | Female | <65 | I/II | Chemotherapy | doxorubicin | CR | |
| KIAA1217 | SNV | Missense_Mutation | c.3389G>C | p.Gly1130Ala | p.G1130A | Q5T5P2 | protein_coding | deleterious(0.01) | probably_damaging(0.999) | TCGA-AC-A23H-01 | Breast | breast invasive carcinoma | Female | >=65 | I/II | Unknown | Unknown | PD | |
| KIAA1217 | SNV | Missense_Mutation | c.5705C>G | p.Ser1902Cys | p.S1902C | Q5T5P2 | protein_coding | deleterious(0) | probably_damaging(0.971) | TCGA-AC-A23H-01 | Breast | breast invasive carcinoma | Female | >=65 | I/II | Unknown | Unknown | PD | |
| KIAA1217 | SNV | Missense_Mutation | rs149633076 | c.2491N>A | p.Ala831Thr | p.A831T | Q5T5P2 | protein_coding | tolerated(0.29) | probably_damaging(0.997) | TCGA-AN-A046-01 | Breast | breast invasive carcinoma | Female | >=65 | I/II | Unknown | Unknown | SD |
| KIAA1217 | SNV | Missense_Mutation | rs748580908 | c.4870N>A | p.Glu1624Lys | p.E1624K | Q5T5P2 | protein_coding | deleterious(0) | probably_damaging(0.998) | TCGA-AN-A046-01 | Breast | breast invasive carcinoma | Female | >=65 | I/II | Unknown | Unknown | SD |
| KIAA1217 | SNV | Missense_Mutation | rs779696488 | c.4009G>A | p.Asp1337Asn | p.D1337N | Q5T5P2 | protein_coding | deleterious(0.02) | benign(0.021) | TCGA-AN-A0AK-01 | Breast | breast invasive carcinoma | Female | >=65 | I/II | Unknown | Unknown | SD |
| KIAA1217 | SNV | Missense_Mutation | c.2656C>A | p.His886Asn | p.H886N | Q5T5P2 | protein_coding | deleterious(0) | benign(0.27) | TCGA-AO-A128-01 | Breast | breast invasive carcinoma | Female | <65 | I/II | Chemotherapy | doxorubicin | SD | |
| KIAA1217 | SNV | Missense_Mutation | novel | c.5289N>C | p.Lys1763Asn | p.K1763N | Q5T5P2 | protein_coding | deleterious(0) | probably_damaging(0.955) | TCGA-BH-A0AW-01 | Breast | breast invasive carcinoma | Female | <65 | I/II | Chemotherapy | carboplatin | SD |
| KIAA1217 | SNV | Missense_Mutation | rs765602010 | c.1220N>T | p.Ala407Val | p.A407V | Q5T5P2 | protein_coding | deleterious(0.01) | probably_damaging(0.997) | TCGA-BH-A0HF-01 | Breast | breast invasive carcinoma | Female | >=65 | I/II | Hormone Therapy | arimidex | SD |
| Page: 1 2 3 4 5 6 7 8 9 10 11 12 13 14 15 16 17 18 19 20 21 22 23 24 |
Top |
Related drugs of malignant transformation related genes |
| Identification of chemicals and drugs interact with genes involved in malignant transfromation |
| (DGIdb 4.0) |
| Entrez ID | Symbol | Category | Interaction Types | Drug Claim Name | Drug Name | PMIDs |
| Page: 1 |

Copyright 2023-Present -The University of Texas Health Science Center at Houston |