
|
|||||
|
 | |
| |
| |
| |
| |
| |
|
Gene: KIAA1191 |
Gene summary for KIAA1191 |
| Gene information | Species | Human | Gene symbol | KIAA1191 | Gene ID | 57179 |
| Gene name | KIAA1191 | |
| Gene Alias | p33MONOX | |
| Cytomap | 5q35.2 | |
| Gene Type | protein-coding | GO ID | GO:0008150 | UniProtAcc | Q96A73 |
Top |
Malignant transformation analysis |
| Identification of the aberrant gene expression in precancerous and cancerous lesions by comparing the gene expression of stem-like cells in diseased tissues with normal stem cells |
| Entrez ID | Symbol | Replicates | Species | Organ | Tissue | Adj P-value | Log2FC | Malignancy |
| 57179 | KIAA1191 | HTA11_1938_2000001011 | Human | Colorectum | AD | 4.78e-02 | 2.64e-01 | -0.0811 |
| 57179 | KIAA1191 | HTA11_78_2000001011 | Human | Colorectum | AD | 1.64e-09 | 4.73e-01 | -0.1088 |
| 57179 | KIAA1191 | HTA11_347_2000001011 | Human | Colorectum | AD | 1.10e-10 | 4.09e-01 | -0.1954 |
| 57179 | KIAA1191 | HTA11_1391_2000001011 | Human | Colorectum | AD | 1.24e-06 | 3.09e-01 | -0.059 |
| 57179 | KIAA1191 | HTA11_5212_2000001011 | Human | Colorectum | AD | 4.62e-02 | 3.04e-01 | -0.2061 |
| 57179 | KIAA1191 | HTA11_7862_2000001011 | Human | Colorectum | AD | 2.08e-03 | 3.65e-01 | -0.0179 |
| 57179 | KIAA1191 | HTA11_866_3004761011 | Human | Colorectum | AD | 1.72e-04 | 2.83e-01 | 0.096 |
| 57179 | KIAA1191 | HTA11_99999970781_79442 | Human | Colorectum | MSS | 8.73e-13 | 4.37e-01 | 0.294 |
| 57179 | KIAA1191 | HTA11_99999965062_69753 | Human | Colorectum | MSI-H | 1.81e-05 | 7.31e-01 | 0.3487 |
| 57179 | KIAA1191 | HTA11_99999971662_82457 | Human | Colorectum | MSS | 1.41e-11 | 4.78e-01 | 0.3859 |
| 57179 | KIAA1191 | LZE4T | Human | Esophagus | ESCC | 8.72e-12 | 2.45e-01 | 0.0811 |
| 57179 | KIAA1191 | LZE5T | Human | Esophagus | ESCC | 1.32e-03 | 1.07e-01 | 0.0514 |
| 57179 | KIAA1191 | LZE8T | Human | Esophagus | ESCC | 9.77e-12 | 1.67e-01 | 0.067 |
| 57179 | KIAA1191 | LZE20T | Human | Esophagus | ESCC | 7.99e-03 | 4.26e-02 | 0.0662 |
| 57179 | KIAA1191 | LZE24T | Human | Esophagus | ESCC | 3.23e-17 | 5.55e-01 | 0.0596 |
| 57179 | KIAA1191 | LZE21T | Human | Esophagus | ESCC | 3.94e-06 | 2.41e-01 | 0.0655 |
| 57179 | KIAA1191 | P1T-E | Human | Esophagus | ESCC | 7.78e-04 | 3.85e-01 | 0.0875 |
| 57179 | KIAA1191 | P2T-E | Human | Esophagus | ESCC | 1.52e-45 | 8.60e-01 | 0.1177 |
| 57179 | KIAA1191 | P4T-E | Human | Esophagus | ESCC | 6.06e-18 | 4.06e-01 | 0.1323 |
| 57179 | KIAA1191 | P5T-E | Human | Esophagus | ESCC | 2.17e-08 | 9.97e-02 | 0.1327 |
| Page: 1 2 3 4 5 6 |
| Tissue | Expression Dynamics | Abbreviation |
| Colorectum (GSE201348) |  | FAP: Familial adenomatous polyposis |
| CRC: Colorectal cancer | ||
| Colorectum (HTA11) | 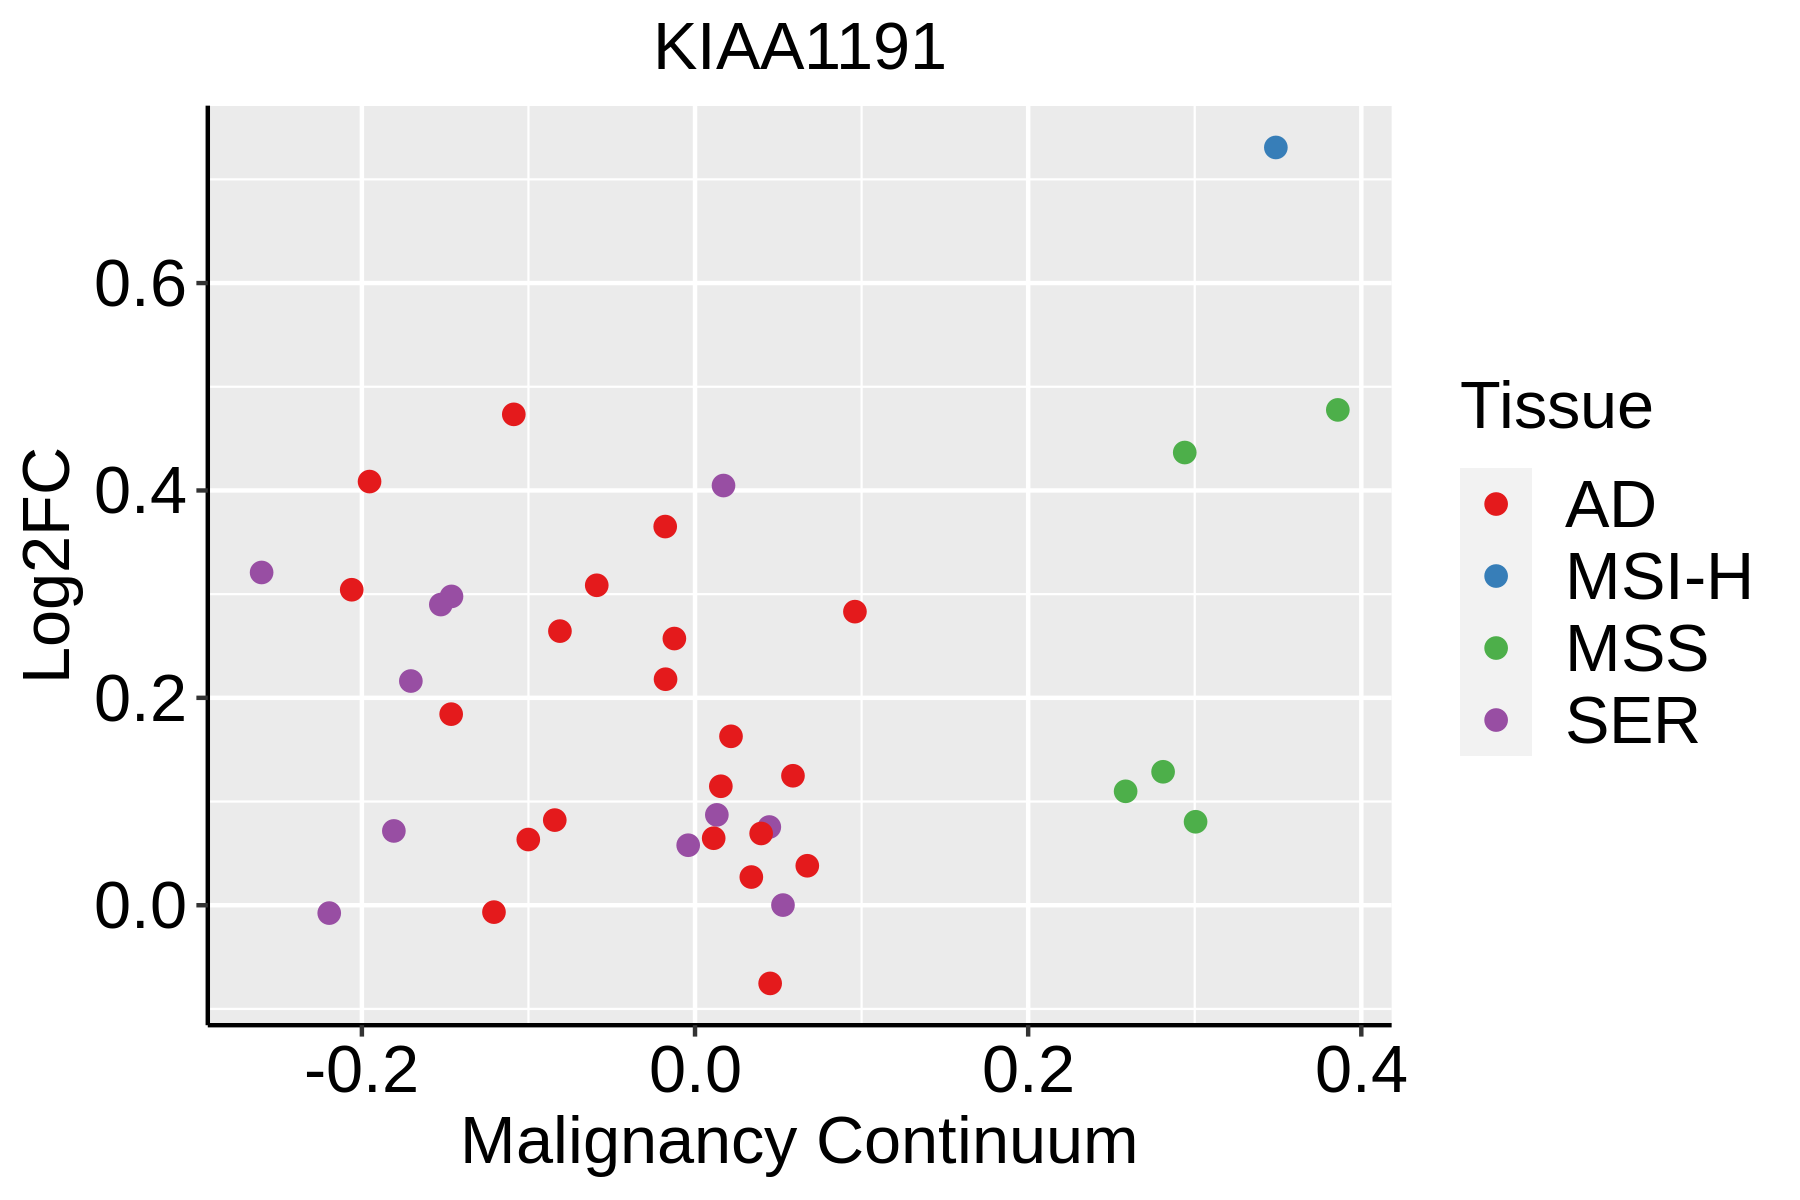 | AD: Adenomas |
| SER: Sessile serrated lesions | ||
| MSI-H: Microsatellite-high colorectal cancer | ||
| MSS: Microsatellite stable colorectal cancer | ||
| Esophagus | 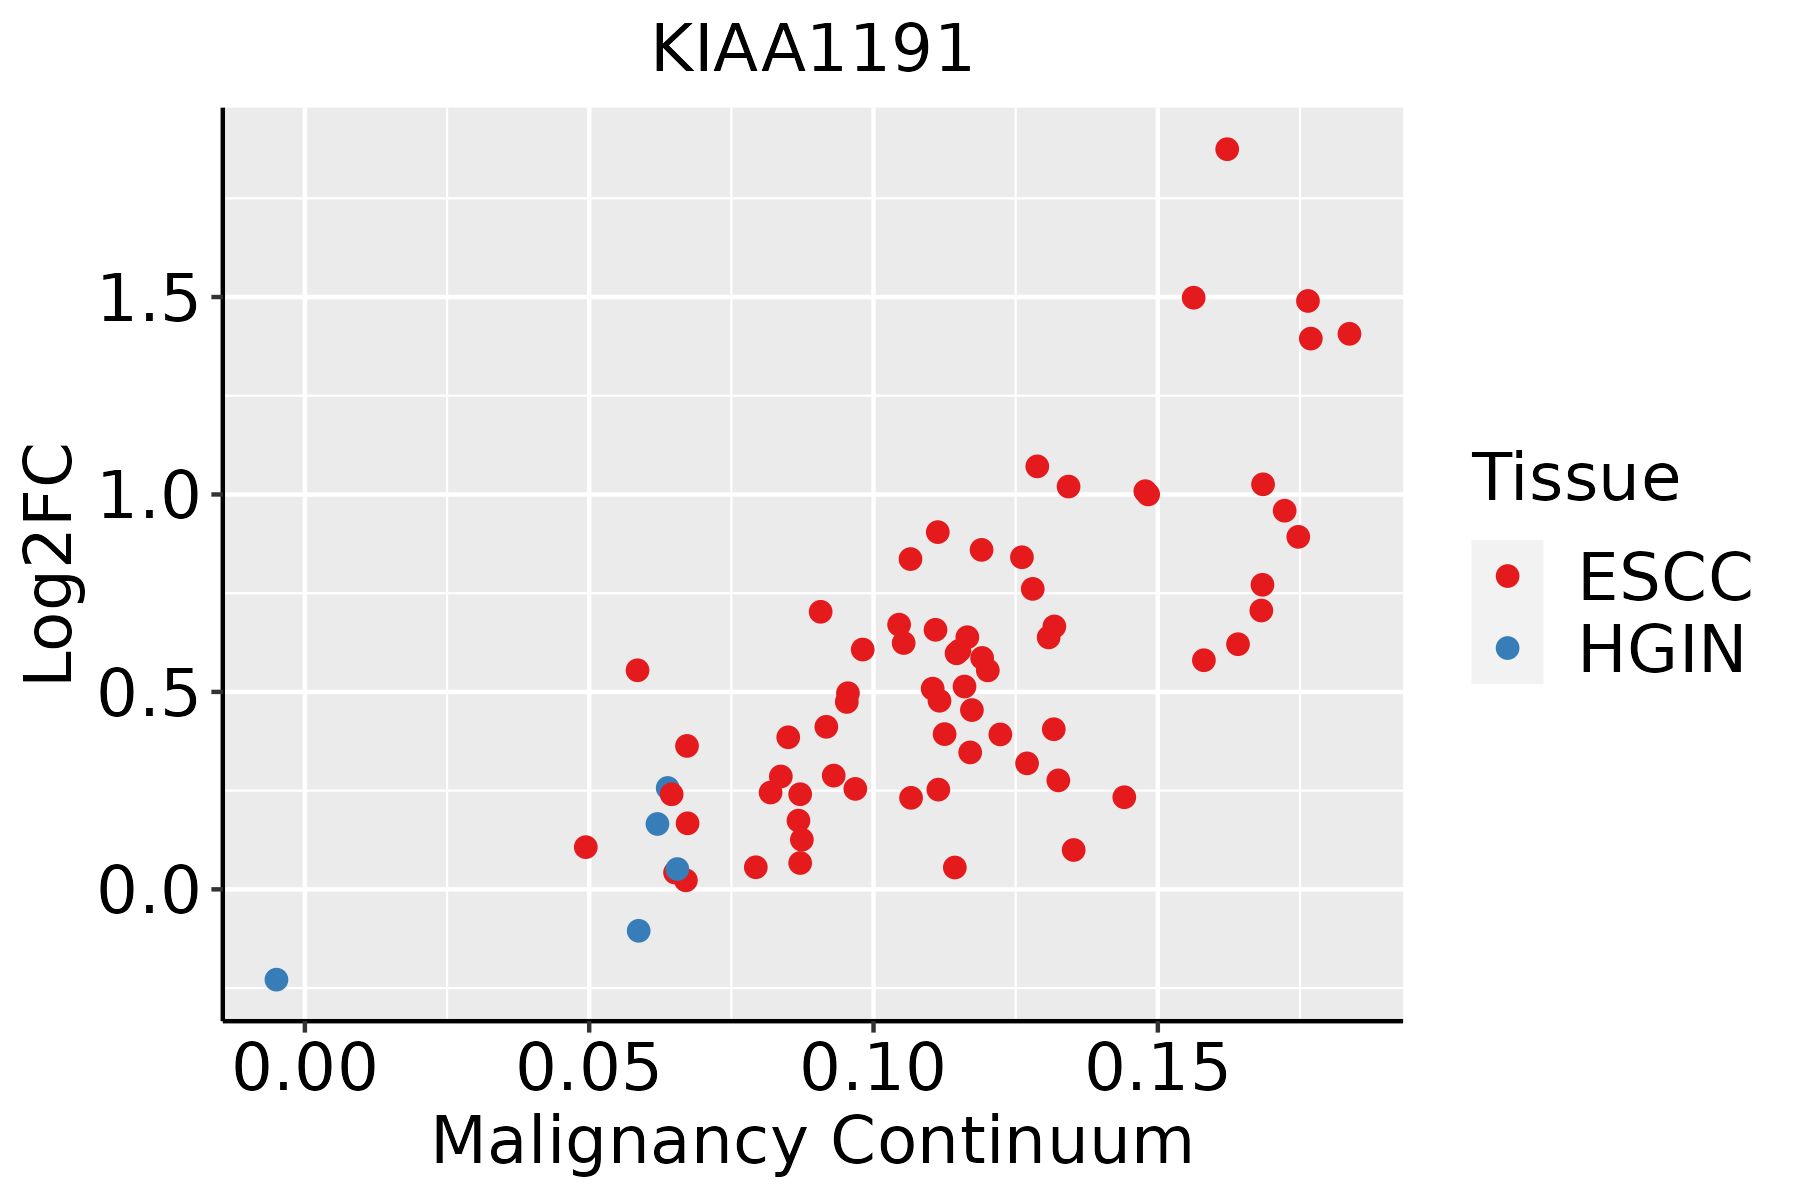 | ESCC: Esophageal squamous cell carcinoma |
| HGIN: High-grade intraepithelial neoplasias | ||
| LGIN: Low-grade intraepithelial neoplasias | ||
| Liver |  | HCC: Hepatocellular carcinoma |
| NAFLD: Non-alcoholic fatty liver disease | ||
| Oral Cavity | 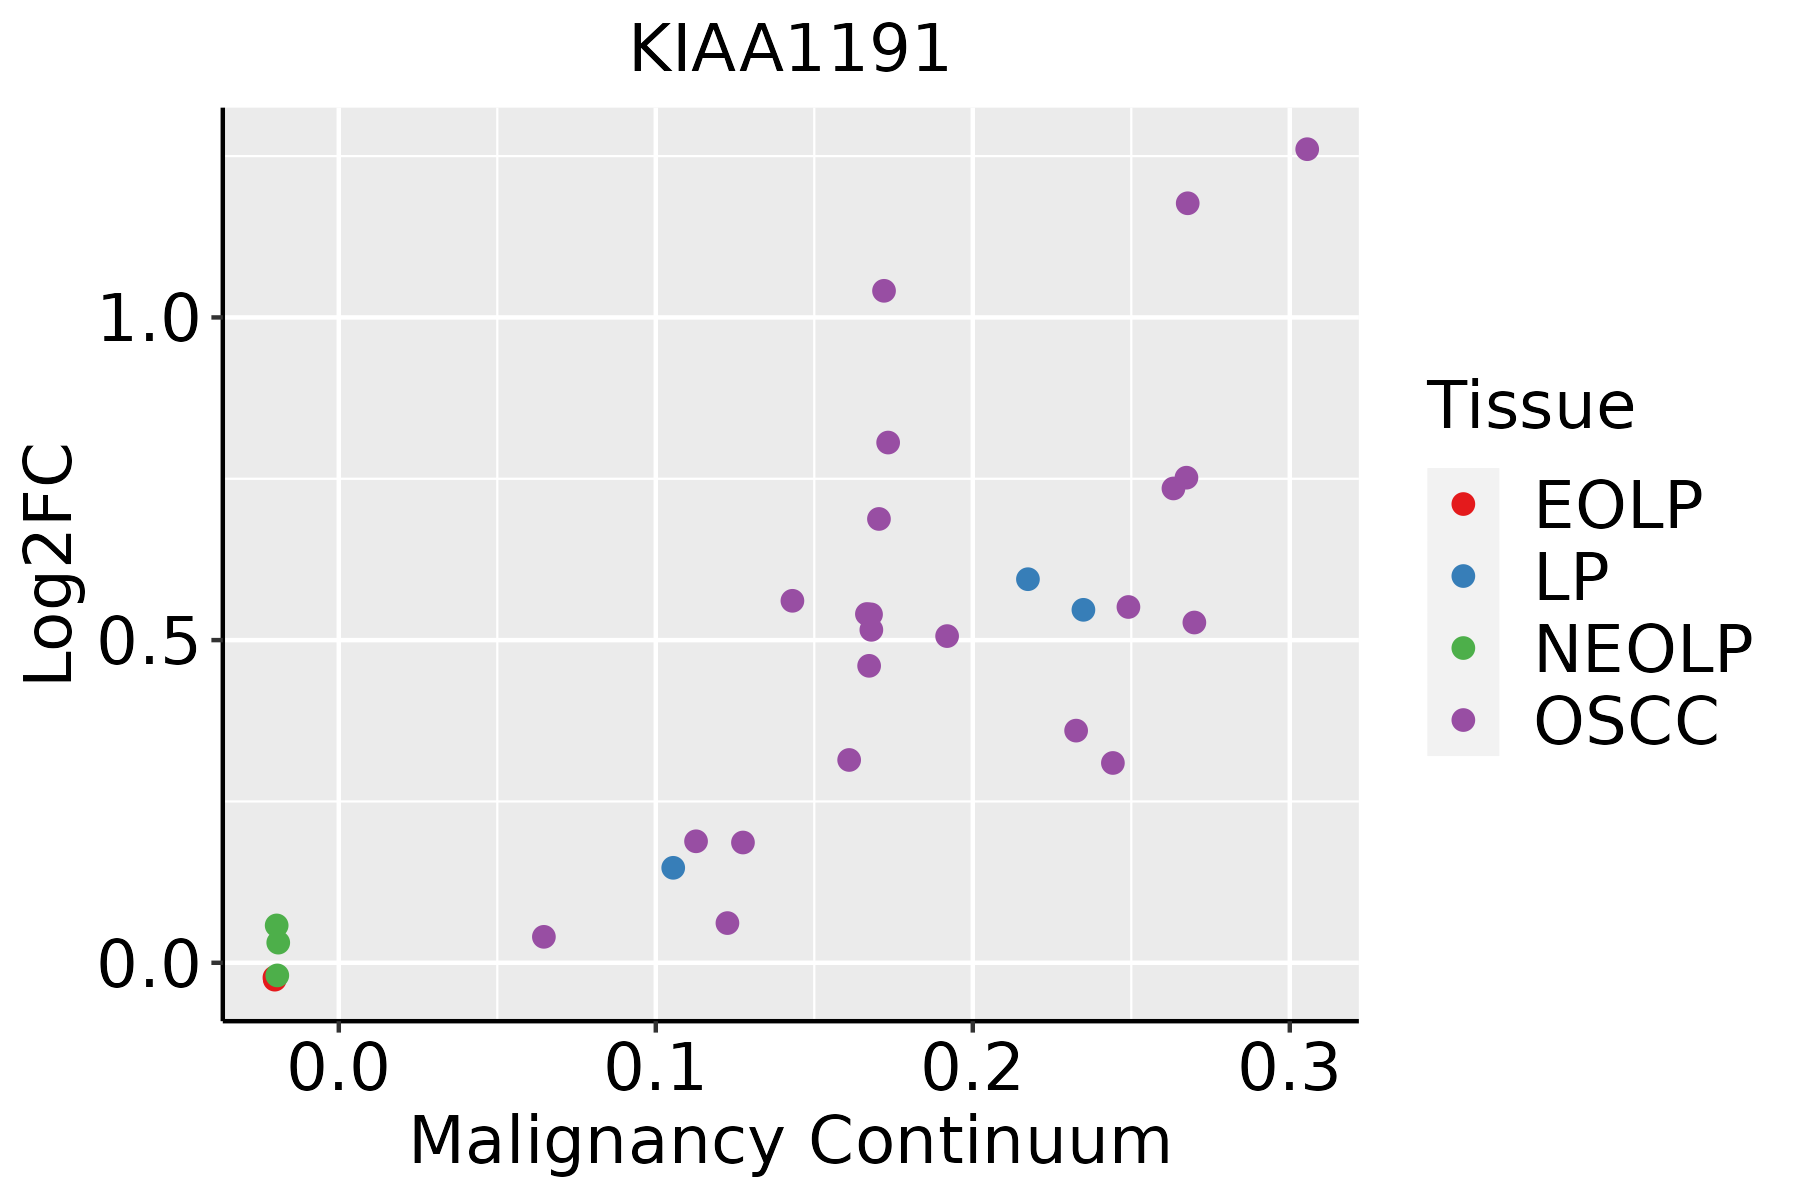 | EOLP: Erosive Oral lichen planus |
| LP: leukoplakia | ||
| NEOLP: Non-erosive oral lichen planus | ||
| OSCC: Oral squamous cell carcinoma | ||
| Prostate | 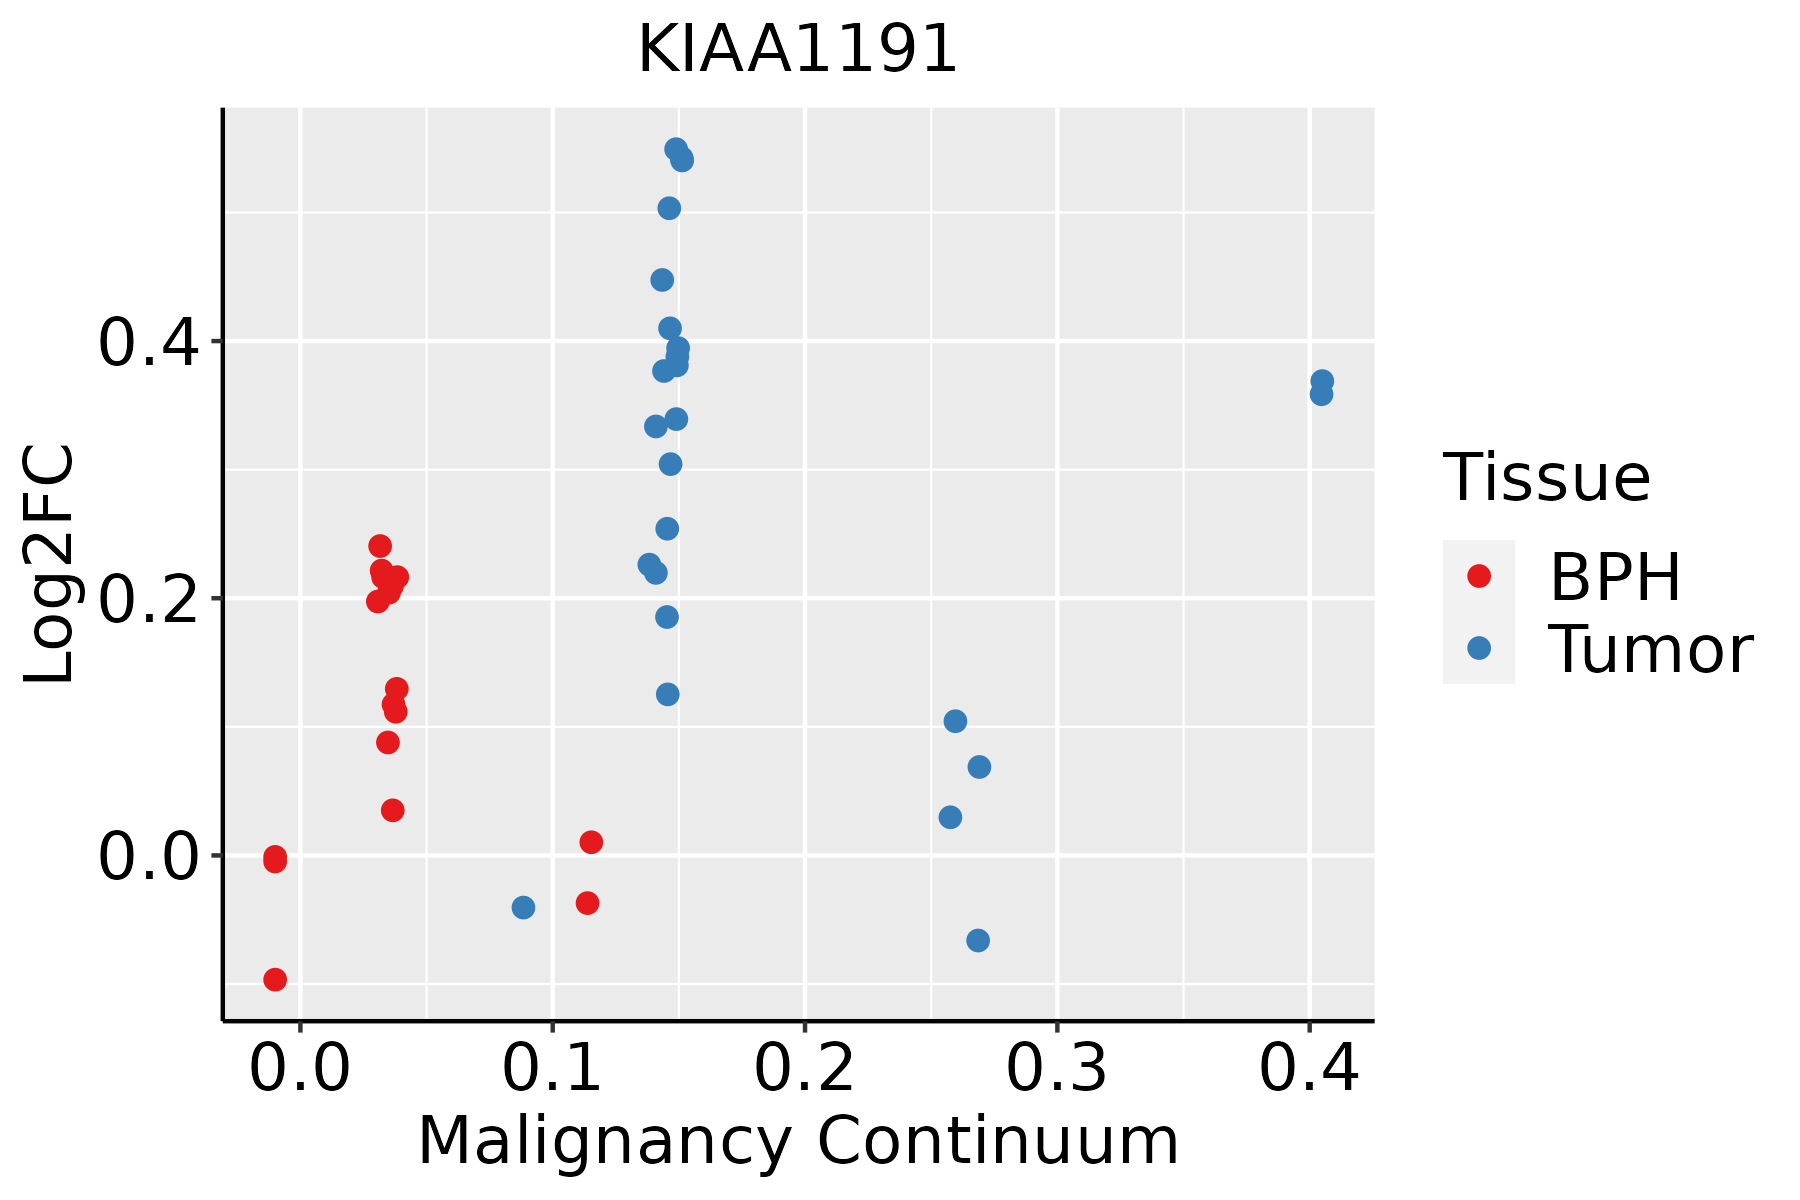 | BPH: Benign Prostatic Hyperplasia |
| Skin |  | AK: Actinic keratosis |
| cSCC: Cutaneous squamous cell carcinoma | ||
| SCCIS:squamous cell carcinoma in situ |
| ∗log2FC in expression of this searched gene in stem-like cells from each diseased tissue sample relative to stem-like cells in normal samples in each tissue plotted against the malignancy continuum. Samples are colored based on if they are from different disease stage. |
Top |
Malignant transformation related pathway analysis |
| Find out the enriched GO biological processes and KEGG pathways involved in transition from healthy to precancer to cancer |
| Tissue | Disease Stage | Enriched GO biological Processes |
| Colorectum | AD |  |
| Colorectum | SER |  |
| Colorectum | MSS |  |
| Colorectum | MSI-H |  |
| Colorectum | FAP |  |
| ∗Top 15 enriched GO BP terms are showed in the bar plot of each disease state in each tissue. Each row represents a significant GO biological process which is colored according to the -log10(p.adjust). |
| Page: 1 2 3 4 5 6 7 8 9 |
| GO ID | Tissue | Disease Stage | Description | Gene Ratio | Bg Ratio | pvalue | p.adjust | Count |
| Page: 1 |
| Pathway ID | Tissue | Disease Stage | Description | Gene Ratio | Bg Ratio | pvalue | p.adjust | qvalue | Count |
| Page: 1 |
Top |
Cell-cell communication analysis |
| Identification of potential cell-cell interactions between two cell types and their ligand-receptor pairs for different disease states |
| Ligand | Receptor | LRpair | Pathway | Tissue | Disease Stage |
| Page: 1 |
Top |
Single-cell gene regulatory network inference analysis |
| Find out the significant the regulons (TFs) and the target genes of each regulon across cell types for different disease states |
| TF | Cell Type | Tissue | Disease Stage | Target Gene | RSS | Regulon Activity |
| ∗The dot plots of a searched regulon are shown for all cell subpopulations in each disease state of each tissue based on the regulon specific score inferred using pySCENIC and by calculating the average expression. |
| Page: 1 |
Top |
Somatic mutation of malignant transformation related genes |
| Annotation of somatic variants for genes involved in malignant transformation |
| Hugo Symbol | Variant Class | Variant Classification | dbSNP RS | HGVSc | HGVSp | HGVSp Short | SWISSPROT | BIOTYPE | SIFT | PolyPhen | Tumor Sample Barcode | Tissue | Histology | Sex | Age | Stage | Therapy Types | Drugs | Outcome |
| KIAA1191 | SNV | Missense_Mutation | rs777312602 | c.235N>C | p.Ser79Pro | p.S79P | Q96A73 | protein_coding | tolerated(0.24) | benign(0.001) | TCGA-A2-A0ET-01 | Breast | breast invasive carcinoma | Female | <65 | III/IV | Chemotherapy | cytoxan | SD |
| KIAA1191 | SNV | Missense_Mutation | c.77T>C | p.Ile26Thr | p.I26T | Q96A73 | protein_coding | deleterious(0.01) | benign(0.007) | TCGA-D8-A1XK-01 | Breast | breast invasive carcinoma | Female | <65 | I/II | Chemotherapy | doxorubicine+cyclophosphamide | SD | |
| KIAA1191 | SNV | Missense_Mutation | novel | c.86N>A | p.Arg29Gln | p.R29Q | Q96A73 | protein_coding | tolerated(0.12) | benign(0.314) | TCGA-E9-A5FL-01 | Breast | breast invasive carcinoma | Female | >=65 | I/II | Unknown | Unknown | SD |
| KIAA1191 | insertion | Nonsense_Mutation | novel | c.763_764insATTAAACTTTTTTAAAGTAAAGGAGATGGTAGA | p.Leu255delinsHisTerThrPheLeuLysTerArgArgTrpTerMet | p.L255delinsH*TFLK*RRW*M | Q96A73 | protein_coding | TCGA-A8-A08H-01 | Breast | breast invasive carcinoma | Female | >=65 | I/II | Unknown | Unknown | SD | ||
| KIAA1191 | SNV | Missense_Mutation | novel | c.388G>A | p.Ala130Thr | p.A130T | Q96A73 | protein_coding | tolerated(0.31) | possibly_damaging(0.723) | TCGA-2W-A8YY-01 | Cervix | cervical & endocervical cancer | Female | <65 | I/II | Chemotherapy | cisplatin | CR |
| KIAA1191 | SNV | Missense_Mutation | novel | c.915C>G | p.Phe305Leu | p.F305L | Q96A73 | protein_coding | deleterious(0.02) | probably_damaging(0.994) | TCGA-C5-A7X5-01 | Cervix | cervical & endocervical cancer | Female | >=65 | I/II | Chemotherapy | carboplatin | PD |
| KIAA1191 | SNV | Missense_Mutation | rs139751460 | c.769C>T | p.Arg257Cys | p.R257C | Q96A73 | protein_coding | deleterious(0.03) | benign(0.015) | TCGA-NH-A5IV-01 | Colorectum | colon adenocarcinoma | Female | >=65 | I/II | Unknown | Unknown | SD |
| KIAA1191 | SNV | Missense_Mutation | novel | c.812N>C | p.Lys271Thr | p.K271T | Q96A73 | protein_coding | deleterious(0.02) | possibly_damaging(0.747) | TCGA-F5-6814-01 | Colorectum | rectum adenocarcinoma | Male | <65 | I/II | Unknown | Unknown | SD |
| KIAA1191 | insertion | Frame_Shift_Ins | novel | c.819_820insC | p.Lys274GlnfsTer18 | p.K274Qfs*18 | Q96A73 | protein_coding | TCGA-A6-2686-01 | Colorectum | colon adenocarcinoma | Female | >=65 | I/II | Unknown | Unknown | SD | ||
| KIAA1191 | SNV | Missense_Mutation | rs202202440 | c.770N>A | p.Arg257His | p.R257H | Q96A73 | protein_coding | tolerated(0.13) | benign(0.015) | TCGA-A5-A0G1-01 | Endometrium | uterine corpus endometrioid carcinoma | Female | >=65 | I/II | Unknown | Unknown | SD |
| Page: 1 2 3 |
Top |
Related drugs of malignant transformation related genes |
| Identification of chemicals and drugs interact with genes involved in malignant transfromation |
| (DGIdb 4.0) |
| Entrez ID | Symbol | Category | Interaction Types | Drug Claim Name | Drug Name | PMIDs |
| Page: 1 |

Copyright 2023-Present -The University of Texas Health Science Center at Houston |