
|
|||||
|
 | |
| |
| |
| |
| |
| |
|
Gene: KIAA1147 |
Gene summary for KIAA1147 |
| Gene information | Species | Human | Gene symbol | KIAA1147 | Gene ID | 57189 |
| Gene name | DENN domain containing 11 | |
| Gene Alias | KIAA1147 | |
| Cytomap | 7q34 | |
| Gene Type | protein-coding | GO ID | GO:0008150 | UniProtAcc | A4D1U4 |
Top |
Malignant transformation analysis |
| Identification of the aberrant gene expression in precancerous and cancerous lesions by comparing the gene expression of stem-like cells in diseased tissues with normal stem cells |
| Entrez ID | Symbol | Replicates | Species | Organ | Tissue | Adj P-value | Log2FC | Malignancy |
| 57189 | KIAA1147 | HCC1_Meng | Human | Liver | HCC | 1.70e-13 | 1.37e-02 | 0.0246 |
| 57189 | KIAA1147 | HCC2_Meng | Human | Liver | HCC | 2.32e-14 | 1.15e-01 | 0.0107 |
| 57189 | KIAA1147 | HCC1 | Human | Liver | HCC | 5.57e-05 | 2.14e+00 | 0.5336 |
| 57189 | KIAA1147 | HCC2 | Human | Liver | HCC | 9.26e-19 | 2.84e+00 | 0.5341 |
| 57189 | KIAA1147 | Pt14.a | Human | Liver | HCC | 1.50e-10 | 4.37e-01 | 0.0169 |
| 57189 | KIAA1147 | S014 | Human | Liver | HCC | 4.80e-08 | 2.63e-01 | 0.2254 |
| 57189 | KIAA1147 | S015 | Human | Liver | HCC | 1.78e-03 | 1.79e-01 | 0.2375 |
| 57189 | KIAA1147 | S016 | Human | Liver | HCC | 8.48e-12 | 2.86e-01 | 0.2243 |
| 57189 | KIAA1147 | S027 | Human | Liver | HCC | 5.77e-10 | 5.61e-01 | 0.2446 |
| 57189 | KIAA1147 | S028 | Human | Liver | HCC | 7.26e-19 | 4.98e-01 | 0.2503 |
| 57189 | KIAA1147 | S029 | Human | Liver | HCC | 3.46e-18 | 5.60e-01 | 0.2581 |
| 57189 | KIAA1147 | Dong_P1 | Human | Prostate | Tumor | 5.06e-10 | 1.07e-01 | 0.035 |
| 57189 | KIAA1147 | Dong_P3 | Human | Prostate | Tumor | 3.81e-06 | 8.87e-02 | 0.0278 |
| 57189 | KIAA1147 | Dong_P5 | Human | Prostate | Tumor | 2.16e-03 | 3.62e-02 | 0.053 |
| 57189 | KIAA1147 | GSM5353216_PA_PB1A_Pool_1_3_S50_L002 | Human | Prostate | Tumor | 2.22e-03 | 4.94e-01 | 0.159 |
| 57189 | KIAA1147 | GSM5353221_PA_PB2A_Pool_1_3_S25_L001 | Human | Prostate | Tumor | 3.76e-15 | 5.74e-01 | 0.1633 |
| 57189 | KIAA1147 | GSM5353222_PA_PB2B_Pool_1_3_S52_L002 | Human | Prostate | Tumor | 2.29e-20 | 6.02e-01 | 0.1608 |
| 57189 | KIAA1147 | GSM5353223_PA_PB2B_Pool_2_S26_L001 | Human | Prostate | Tumor | 6.09e-10 | 4.88e-01 | 0.1604 |
| 57189 | KIAA1147 | GSM5353224_PA_PR5186_Pool_1_2_3_S27_L001 | Human | Prostate | Tumor | 3.08e-06 | 3.30e-01 | 0.1621 |
| 57189 | KIAA1147 | GSM5353225_PA_PR5196-1_Pool_1_2_3_S53_L002 | Human | Prostate | Tumor | 3.50e-02 | 2.66e-01 | 0.1619 |
| Page: 1 2 |
| Tissue | Expression Dynamics | Abbreviation |
| Liver |  | HCC: Hepatocellular carcinoma |
| NAFLD: Non-alcoholic fatty liver disease | ||
| Prostate | 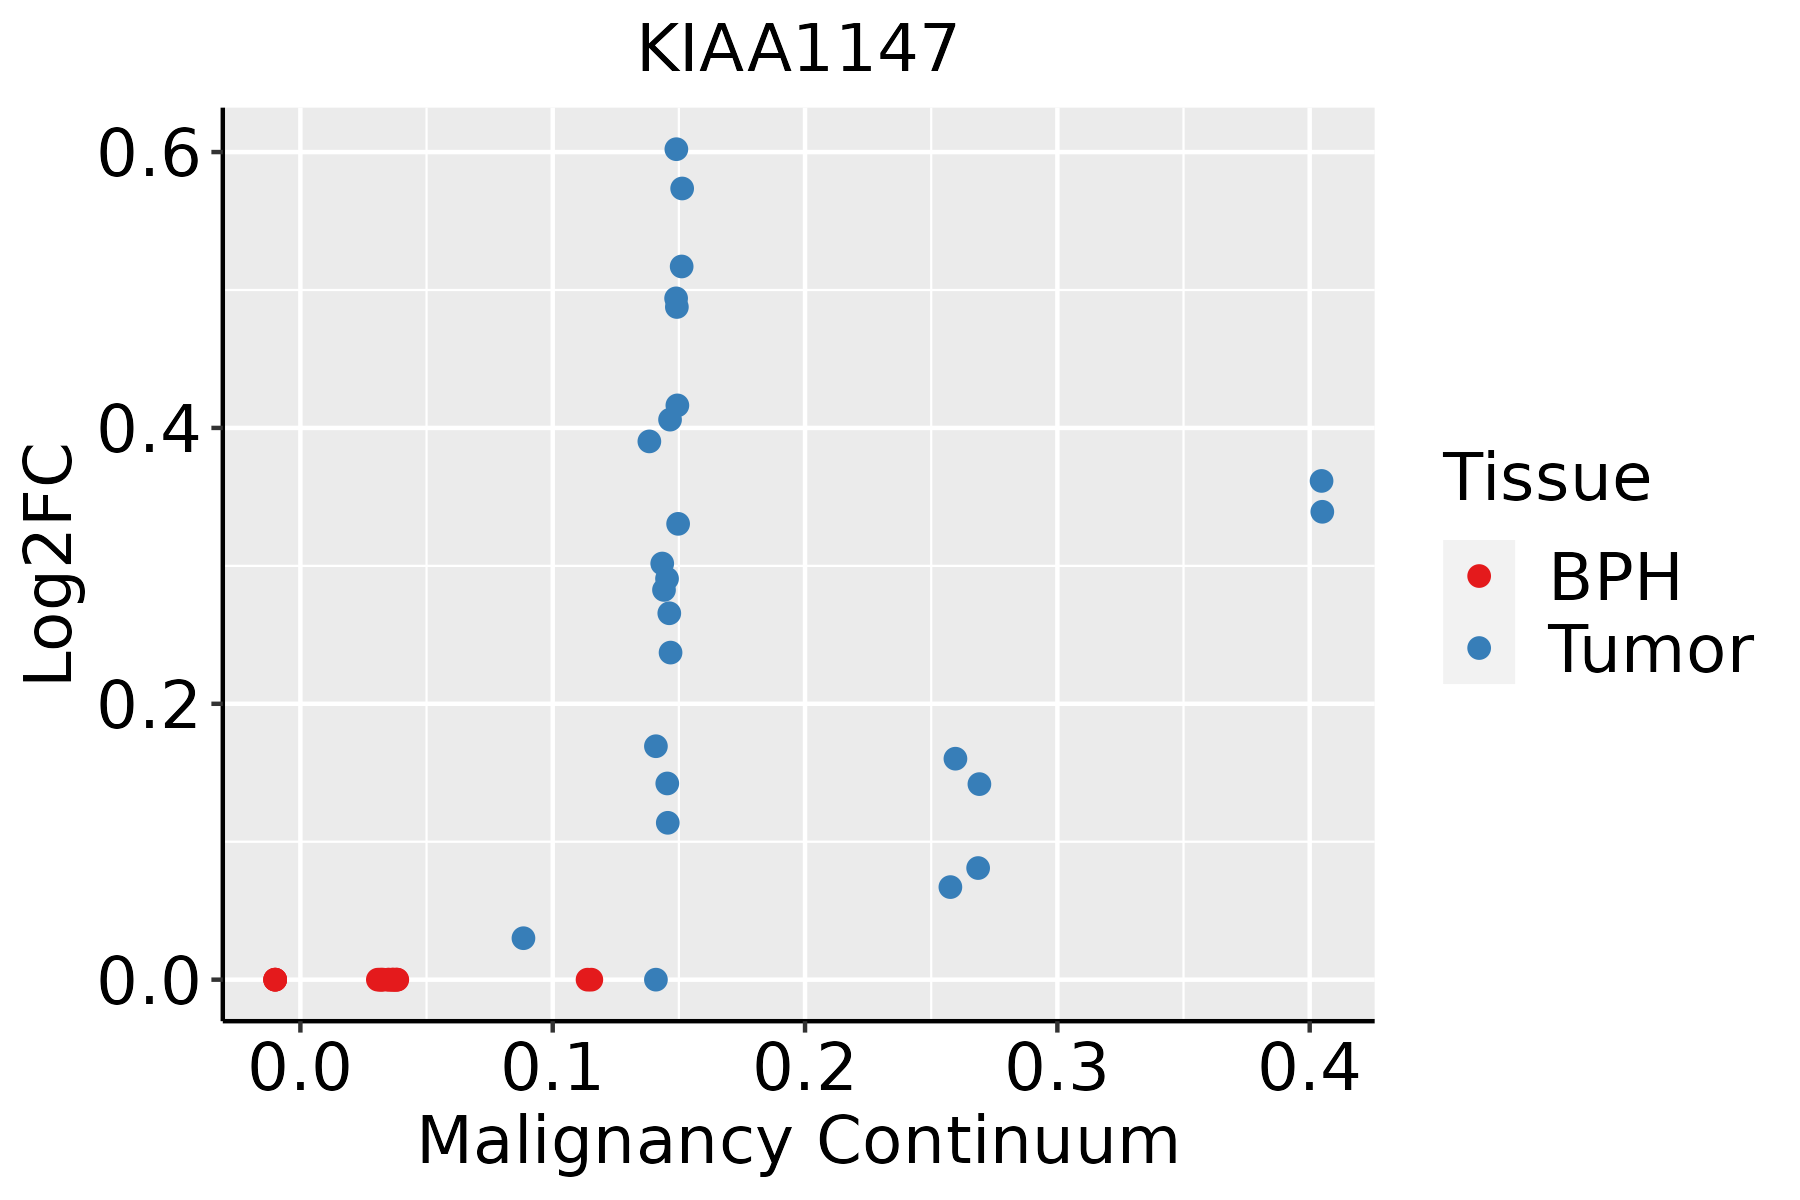 | BPH: Benign Prostatic Hyperplasia |
| ∗log2FC in expression of this searched gene in stem-like cells from each diseased tissue sample relative to stem-like cells in normal samples in each tissue plotted against the malignancy continuum. Samples are colored based on if they are from different disease stage. |
Top |
Malignant transformation related pathway analysis |
| Find out the enriched GO biological processes and KEGG pathways involved in transition from healthy to precancer to cancer |
| Tissue | Disease Stage | Enriched GO biological Processes |
| Colorectum | AD |  |
| Colorectum | SER |  |
| Colorectum | MSS |  |
| Colorectum | MSI-H |  |
| Colorectum | FAP |  |
| ∗Top 15 enriched GO BP terms are showed in the bar plot of each disease state in each tissue. Each row represents a significant GO biological process which is colored according to the -log10(p.adjust). |
| Page: 1 2 3 4 5 6 7 8 9 |
| GO ID | Tissue | Disease Stage | Description | Gene Ratio | Bg Ratio | pvalue | p.adjust | Count |
| Page: 1 |
| Pathway ID | Tissue | Disease Stage | Description | Gene Ratio | Bg Ratio | pvalue | p.adjust | qvalue | Count |
| Page: 1 |
Top |
Cell-cell communication analysis |
| Identification of potential cell-cell interactions between two cell types and their ligand-receptor pairs for different disease states |
| Ligand | Receptor | LRpair | Pathway | Tissue | Disease Stage |
| Page: 1 |
Top |
Single-cell gene regulatory network inference analysis |
| Find out the significant the regulons (TFs) and the target genes of each regulon across cell types for different disease states |
| TF | Cell Type | Tissue | Disease Stage | Target Gene | RSS | Regulon Activity |
| ∗The dot plots of a searched regulon are shown for all cell subpopulations in each disease state of each tissue based on the regulon specific score inferred using pySCENIC and by calculating the average expression. |
| Page: 1 |
Top |
Somatic mutation of malignant transformation related genes |
| Annotation of somatic variants for genes involved in malignant transformation |
| Hugo Symbol | Variant Class | Variant Classification | dbSNP RS | HGVSc | HGVSp | HGVSp Short | SWISSPROT | BIOTYPE | SIFT | PolyPhen | Tumor Sample Barcode | Tissue | Histology | Sex | Age | Stage | Therapy Types | Drugs | Outcome |
| KIAA1147 | SNV | Missense_Mutation | c.1290N>G | p.Asp430Glu | p.D430E | A4D1U4 | protein_coding | deleterious(0) | probably_damaging(0.997) | TCGA-A2-A0D0-01 | Breast | breast invasive carcinoma | Female | <65 | I/II | Chemotherapy | cytoxan | SD | |
| KIAA1147 | SNV | Missense_Mutation | novel | c.1067N>A | p.Ala356Asp | p.A356D | A4D1U4 | protein_coding | deleterious(0) | possibly_damaging(0.812) | TCGA-A2-A25A-01 | Breast | breast invasive carcinoma | Female | <65 | I/II | Unspecific | Cytoxan | SD |
| KIAA1147 | SNV | Missense_Mutation | rs763103451 | c.1138G>A | p.Asp380Asn | p.D380N | A4D1U4 | protein_coding | tolerated(0.18) | possibly_damaging(0.815) | TCGA-AN-A046-01 | Breast | breast invasive carcinoma | Female | >=65 | I/II | Unknown | Unknown | SD |
| KIAA1147 | insertion | Frame_Shift_Ins | novel | c.1143_1144insCAGCTTCCTGTTTGGTCTTCCAGGGGTGAGG | p.Asn382GlnfsTer14 | p.N382Qfs*14 | A4D1U4 | protein_coding | TCGA-AO-A0J9-01 | Breast | breast invasive carcinoma | Female | <65 | III/IV | Chemotherapy | cyclophosphamide | PD | ||
| KIAA1147 | insertion | Frame_Shift_Ins | novel | c.1356_1357insA | p.Cys453MetfsTer49 | p.C453Mfs*49 | A4D1U4 | protein_coding | TCGA-2W-A8YY-01 | Cervix | cervical & endocervical cancer | Female | <65 | I/II | Chemotherapy | cisplatin | CR | ||
| KIAA1147 | SNV | Missense_Mutation | c.995N>T | p.Asp332Val | p.D332V | A4D1U4 | protein_coding | deleterious(0) | probably_damaging(0.999) | TCGA-A6-3809-01 | Colorectum | colon adenocarcinoma | Female | >=65 | I/II | Unknown | Unknown | SD | |
| KIAA1147 | SNV | Missense_Mutation | rs758501488 | c.865G>A | p.Gly289Arg | p.G289R | A4D1U4 | protein_coding | tolerated(0.11) | possibly_damaging(0.825) | TCGA-AA-3977-01 | Colorectum | colon adenocarcinoma | Male | >=65 | I/II | Unknown | Unknown | SD |
| KIAA1147 | SNV | Missense_Mutation | rs761806017 | c.526N>T | p.Arg176Trp | p.R176W | A4D1U4 | protein_coding | deleterious(0) | probably_damaging(0.98) | TCGA-AY-A69D-01 | Colorectum | colon adenocarcinoma | Female | <65 | I/II | Unknown | Unknown | SD |
| KIAA1147 | SNV | Missense_Mutation | rs774706582 | c.773N>A | p.Arg258His | p.R258H | A4D1U4 | protein_coding | deleterious(0) | probably_damaging(0.931) | TCGA-CA-6718-01 | Colorectum | colon adenocarcinoma | Male | <65 | I/II | Unknown | Unknown | PD |
| KIAA1147 | SNV | Missense_Mutation | rs184004901 | c.1085N>A | p.Arg362His | p.R362H | A4D1U4 | protein_coding | deleterious(0.01) | possibly_damaging(0.594) | TCGA-CM-6170-01 | Colorectum | colon adenocarcinoma | Female | >=65 | I/II | Unknown | Unknown | SD |
| Page: 1 2 3 4 |
Top |
Related drugs of malignant transformation related genes |
| Identification of chemicals and drugs interact with genes involved in malignant transfromation |
| (DGIdb 4.0) |
| Entrez ID | Symbol | Category | Interaction Types | Drug Claim Name | Drug Name | PMIDs |
| Page: 1 |

Copyright 2023-Present -The University of Texas Health Science Center at Houston |