
|
|||||
|
 | |
| |
| |
| |
| |
| |
|
Gene: KIAA0907 |
Gene summary for KIAA0907 |
| Gene information | Species | Human | Gene symbol | KIAA0907 | Gene ID | 22889 |
| Gene name | KH domain containing 4, pre-mRNA splicing factor | |
| Gene Alias | BLOM7 | |
| Cytomap | 1q22 | |
| Gene Type | protein-coding | GO ID | GO:0000245 | UniProtAcc | Q7Z7F0 |
Top |
Malignant transformation analysis |
| Identification of the aberrant gene expression in precancerous and cancerous lesions by comparing the gene expression of stem-like cells in diseased tissues with normal stem cells |
| Entrez ID | Symbol | Replicates | Species | Organ | Tissue | Adj P-value | Log2FC | Malignancy |
| 22889 | KIAA0907 | HTA11_99999970781_79442 | Human | Colorectum | MSS | 1.11e-46 | 8.18e-01 | 0.294 |
| 22889 | KIAA0907 | HTA11_99999965062_69753 | Human | Colorectum | MSI-H | 6.28e-10 | 7.66e-01 | 0.3487 |
| 22889 | KIAA0907 | HTA11_99999965104_69814 | Human | Colorectum | MSS | 1.31e-25 | 6.23e-01 | 0.281 |
| 22889 | KIAA0907 | HTA11_99999971662_82457 | Human | Colorectum | MSS | 8.45e-42 | 8.36e-01 | 0.3859 |
| 22889 | KIAA0907 | HTA11_99999973899_84307 | Human | Colorectum | MSS | 1.57e-07 | 2.95e-01 | 0.2585 |
| 22889 | KIAA0907 | HTA11_99999974143_84620 | Human | Colorectum | MSS | 4.93e-21 | 4.16e-01 | 0.3005 |
| 22889 | KIAA0907 | P1T-E | Human | Esophagus | ESCC | 6.60e-11 | 5.93e-01 | 0.0875 |
| 22889 | KIAA0907 | P2T-E | Human | Esophagus | ESCC | 1.84e-18 | 4.14e-01 | 0.1177 |
| 22889 | KIAA0907 | P4T-E | Human | Esophagus | ESCC | 8.61e-22 | 3.34e-01 | 0.1323 |
| 22889 | KIAA0907 | P5T-E | Human | Esophagus | ESCC | 1.65e-21 | 4.09e-01 | 0.1327 |
| 22889 | KIAA0907 | P8T-E | Human | Esophagus | ESCC | 9.29e-21 | 3.70e-01 | 0.0889 |
| 22889 | KIAA0907 | P9T-E | Human | Esophagus | ESCC | 1.80e-10 | 3.21e-01 | 0.1131 |
| 22889 | KIAA0907 | P10T-E | Human | Esophagus | ESCC | 7.42e-37 | 7.41e-01 | 0.116 |
| 22889 | KIAA0907 | P11T-E | Human | Esophagus | ESCC | 5.61e-09 | 6.86e-01 | 0.1426 |
| 22889 | KIAA0907 | P12T-E | Human | Esophagus | ESCC | 4.34e-19 | 3.84e-01 | 0.1122 |
| 22889 | KIAA0907 | P15T-E | Human | Esophagus | ESCC | 1.32e-19 | 6.02e-01 | 0.1149 |
| 22889 | KIAA0907 | P16T-E | Human | Esophagus | ESCC | 2.33e-10 | 3.60e-01 | 0.1153 |
| 22889 | KIAA0907 | P17T-E | Human | Esophagus | ESCC | 2.37e-07 | 1.84e-01 | 0.1278 |
| 22889 | KIAA0907 | P20T-E | Human | Esophagus | ESCC | 1.29e-14 | 4.49e-01 | 0.1124 |
| 22889 | KIAA0907 | P21T-E | Human | Esophagus | ESCC | 1.62e-12 | 2.53e-01 | 0.1617 |
| Page: 1 2 3 4 5 |
| Tissue | Expression Dynamics | Abbreviation |
| Colorectum (GSE201348) |  | FAP: Familial adenomatous polyposis |
| CRC: Colorectal cancer | ||
| Colorectum (HTA11) | 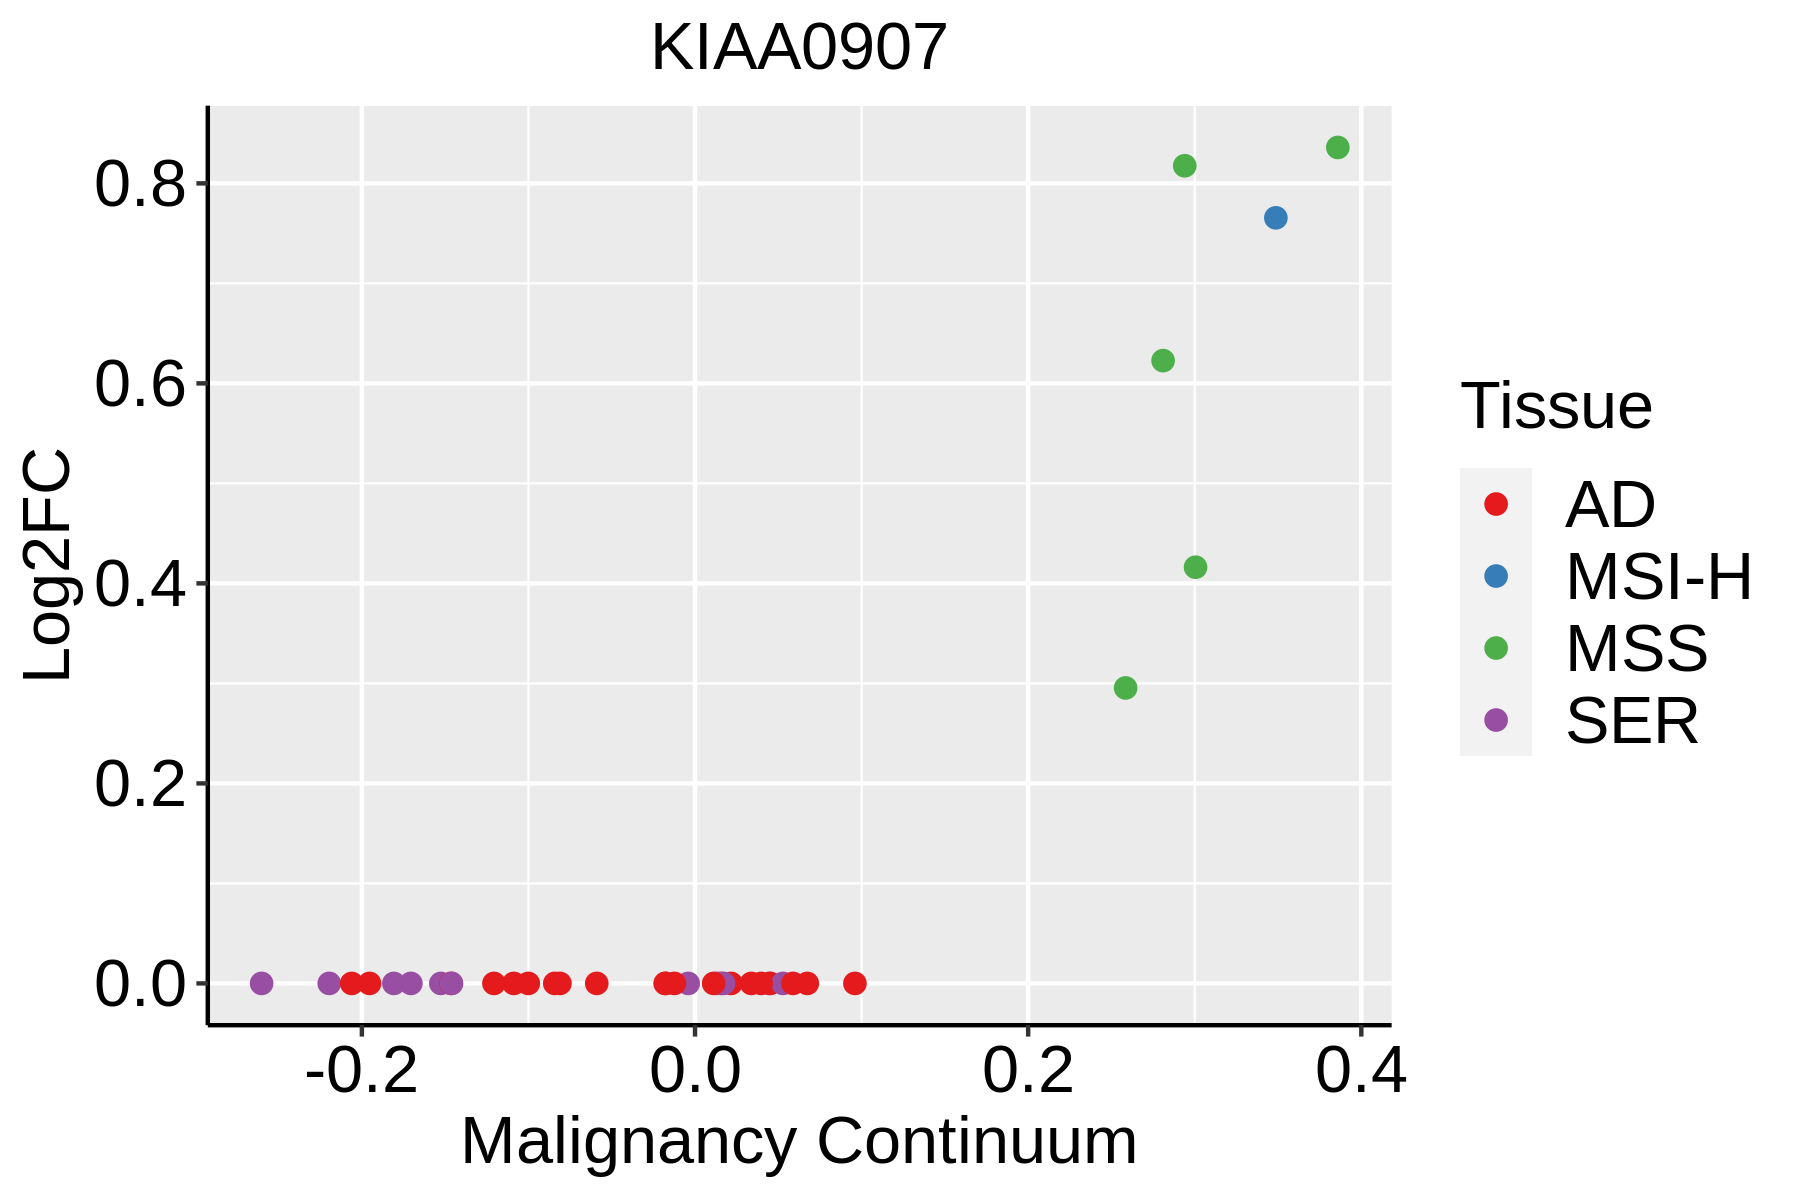 | AD: Adenomas |
| SER: Sessile serrated lesions | ||
| MSI-H: Microsatellite-high colorectal cancer | ||
| MSS: Microsatellite stable colorectal cancer | ||
| Esophagus | 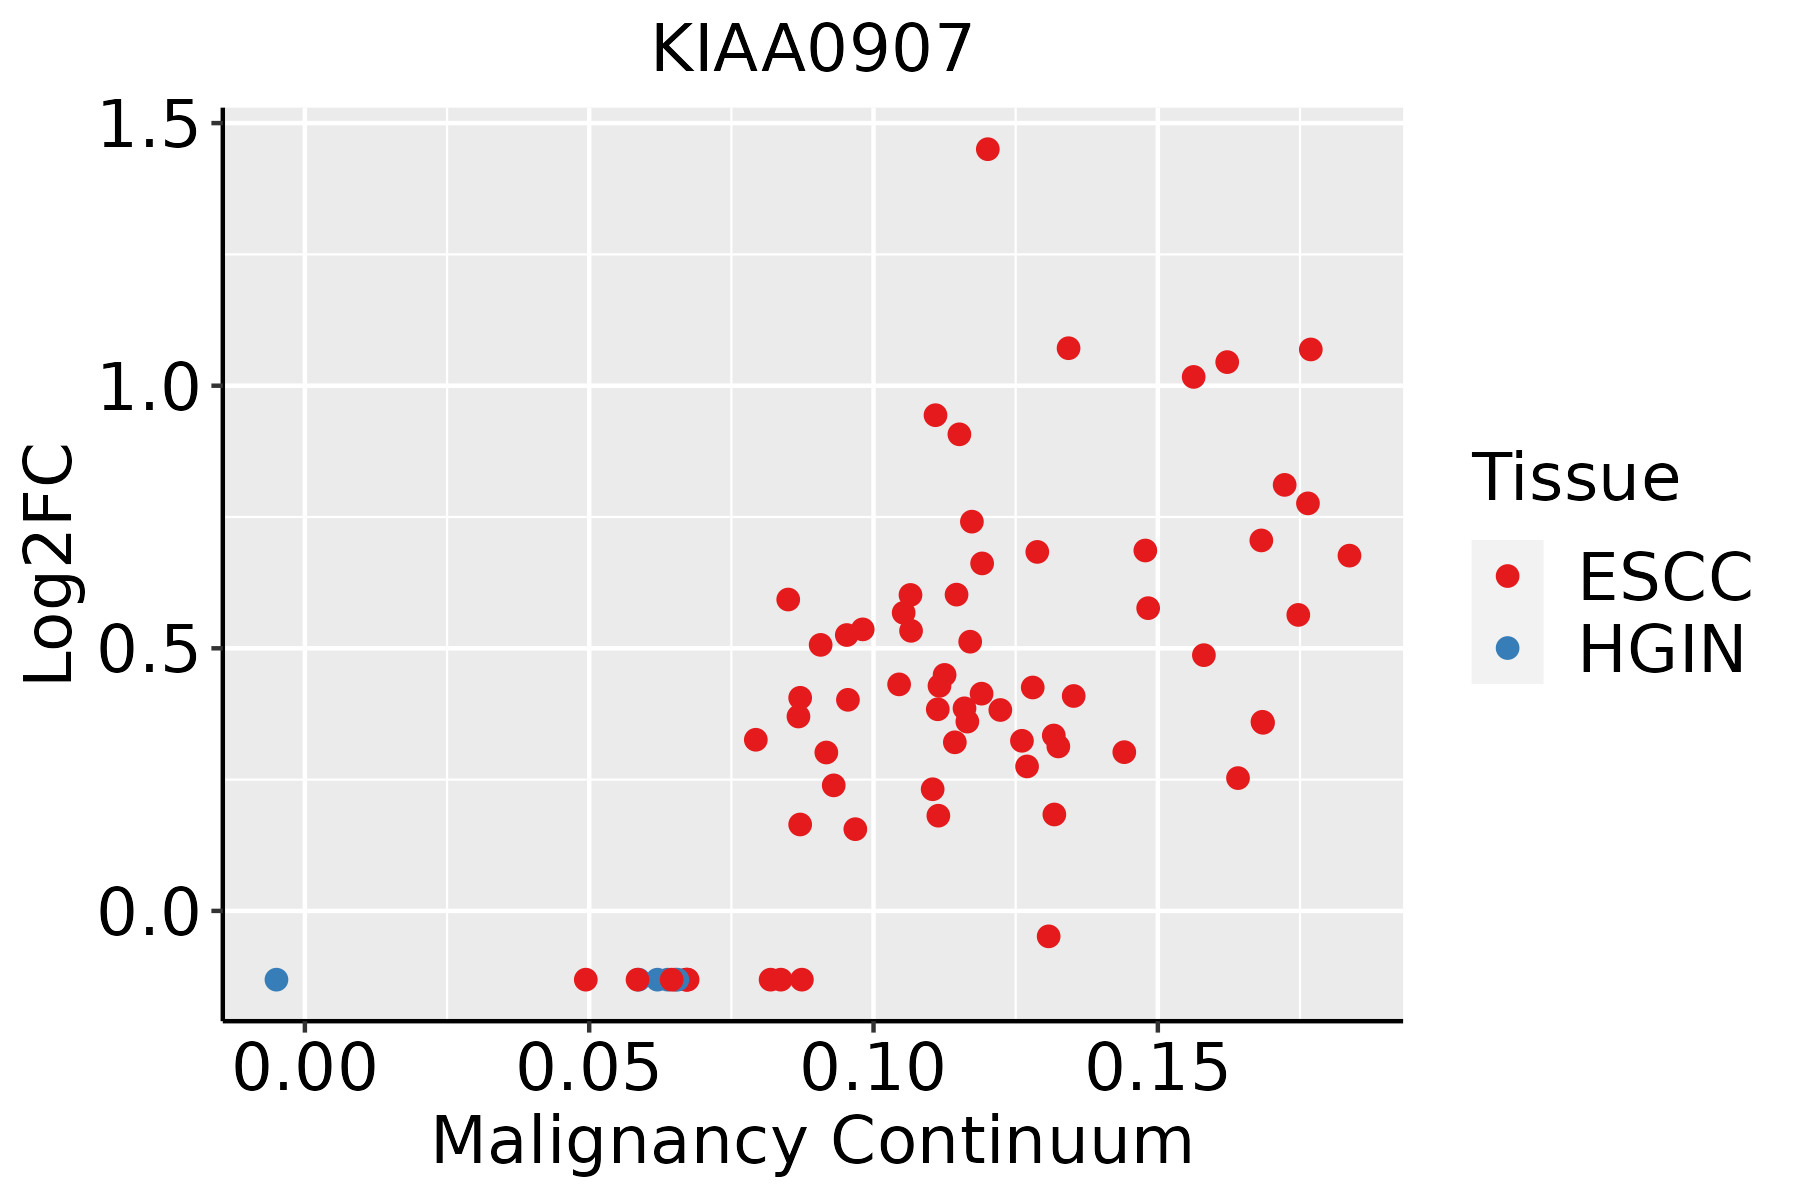 | ESCC: Esophageal squamous cell carcinoma |
| HGIN: High-grade intraepithelial neoplasias | ||
| LGIN: Low-grade intraepithelial neoplasias | ||
| Liver | 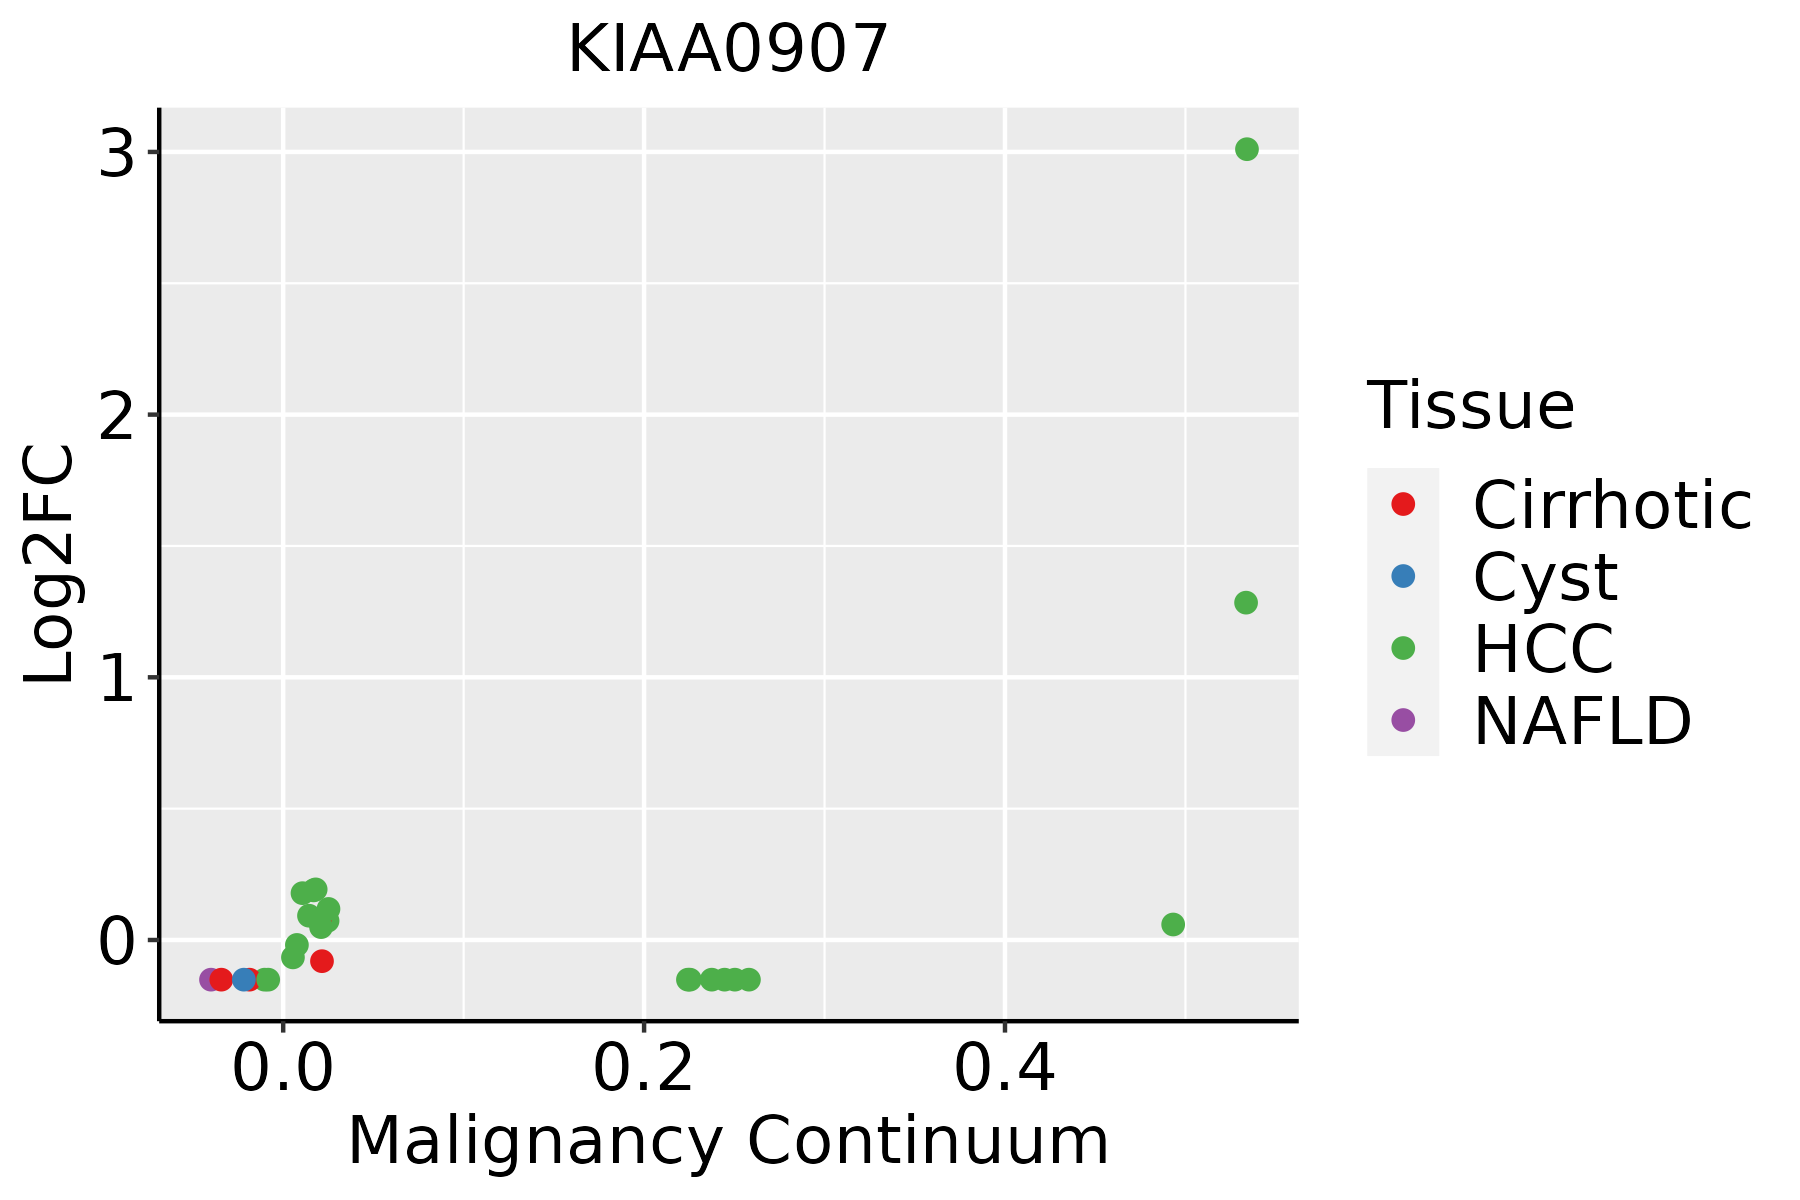 | HCC: Hepatocellular carcinoma |
| NAFLD: Non-alcoholic fatty liver disease | ||
| Oral Cavity | 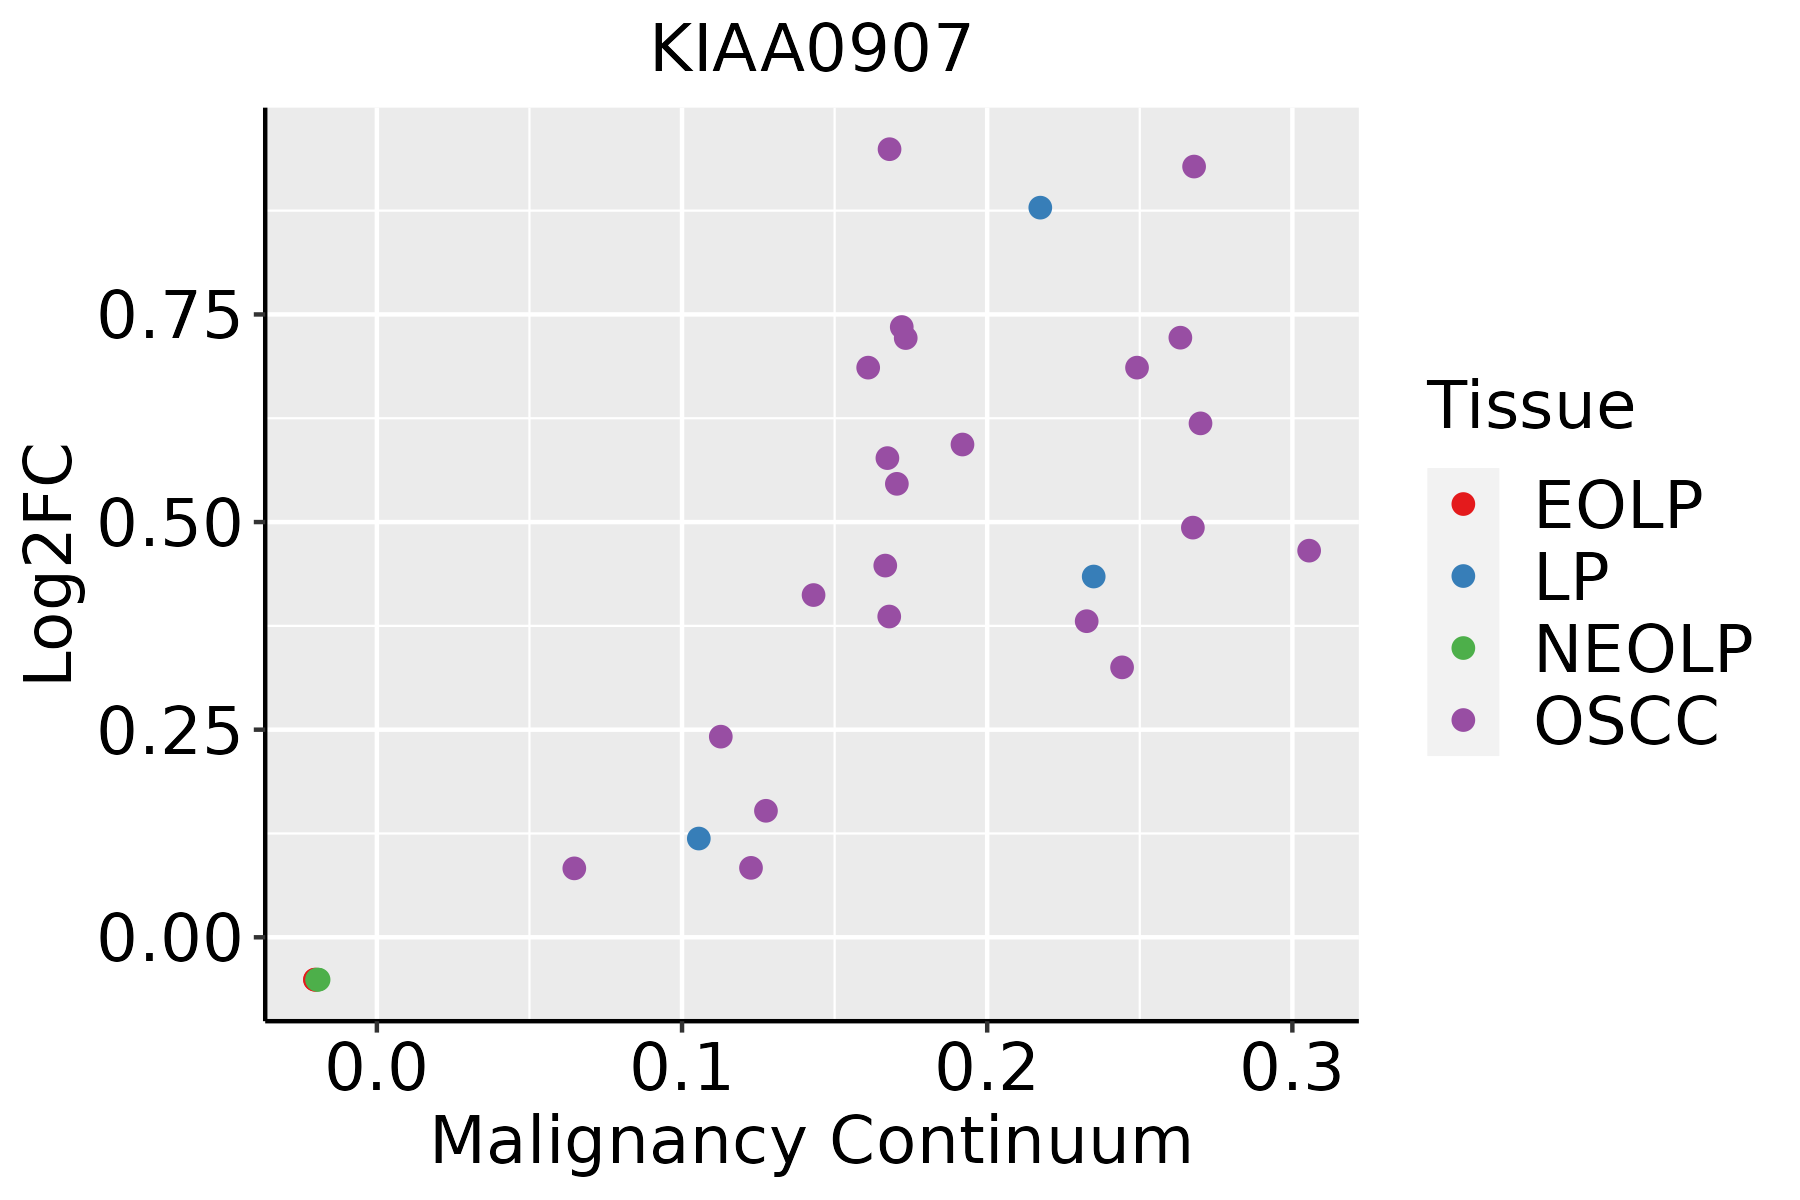 | EOLP: Erosive Oral lichen planus |
| LP: leukoplakia | ||
| NEOLP: Non-erosive oral lichen planus | ||
| OSCC: Oral squamous cell carcinoma | ||
| Prostate |  | BPH: Benign Prostatic Hyperplasia |
| ∗log2FC in expression of this searched gene in stem-like cells from each diseased tissue sample relative to stem-like cells in normal samples in each tissue plotted against the malignancy continuum. Samples are colored based on if they are from different disease stage. |
Top |
Malignant transformation related pathway analysis |
| Find out the enriched GO biological processes and KEGG pathways involved in transition from healthy to precancer to cancer |
| Tissue | Disease Stage | Enriched GO biological Processes |
| Colorectum | AD |  |
| Colorectum | SER |  |
| Colorectum | MSS |  |
| Colorectum | MSI-H |  |
| Colorectum | FAP |  |
| ∗Top 15 enriched GO BP terms are showed in the bar plot of each disease state in each tissue. Each row represents a significant GO biological process which is colored according to the -log10(p.adjust). |
| Page: 1 2 3 4 5 6 7 8 9 |
| GO ID | Tissue | Disease Stage | Description | Gene Ratio | Bg Ratio | pvalue | p.adjust | Count |
| Page: 1 |
| Pathway ID | Tissue | Disease Stage | Description | Gene Ratio | Bg Ratio | pvalue | p.adjust | qvalue | Count |
| Page: 1 |
Top |
Cell-cell communication analysis |
| Identification of potential cell-cell interactions between two cell types and their ligand-receptor pairs for different disease states |
| Ligand | Receptor | LRpair | Pathway | Tissue | Disease Stage |
| Page: 1 |
Top |
Single-cell gene regulatory network inference analysis |
| Find out the significant the regulons (TFs) and the target genes of each regulon across cell types for different disease states |
| TF | Cell Type | Tissue | Disease Stage | Target Gene | RSS | Regulon Activity |
| ∗The dot plots of a searched regulon are shown for all cell subpopulations in each disease state of each tissue based on the regulon specific score inferred using pySCENIC and by calculating the average expression. |
| Page: 1 |
Top |
Somatic mutation of malignant transformation related genes |
| Annotation of somatic variants for genes involved in malignant transformation |
| Hugo Symbol | Variant Class | Variant Classification | dbSNP RS | HGVSc | HGVSp | HGVSp Short | SWISSPROT | BIOTYPE | SIFT | PolyPhen | Tumor Sample Barcode | Tissue | Histology | Sex | Age | Stage | Therapy Types | Drugs | Outcome |
| KIAA0907 | SNV | Missense_Mutation | c.917C>G | p.Ala306Gly | p.A306G | Q7Z7F0 | protein_coding | tolerated(0.09) | benign(0.208) | TCGA-A8-A09M-01 | Breast | breast invasive carcinoma | Female | >=65 | III/IV | Chemotherapy | paclitaxel | CR | |
| KIAA0907 | SNV | Missense_Mutation | novel | c.617A>C | p.His206Pro | p.H206P | Q7Z7F0 | protein_coding | tolerated(0.35) | benign(0.003) | TCGA-AO-A1KP-01 | Breast | breast invasive carcinoma | Female | >=65 | I/II | Chemotherapy | fluorouracil | SD |
| KIAA0907 | SNV | Missense_Mutation | c.304N>G | p.Leu102Val | p.L102V | Q7Z7F0 | protein_coding | tolerated(0.14) | benign(0.188) | TCGA-AR-A256-01 | Breast | breast invasive carcinoma | Female | <65 | I/II | Chemotherapy | doxorubicin | PD | |
| KIAA0907 | SNV | Missense_Mutation | c.968A>G | p.Tyr323Cys | p.Y323C | Q7Z7F0 | protein_coding | deleterious(0) | probably_damaging(0.973) | TCGA-BH-A18G-01 | Breast | breast invasive carcinoma | Female | >=65 | I/II | Unknown | Unknown | SD | |
| KIAA0907 | SNV | Missense_Mutation | novel | c.617N>C | p.His206Pro | p.H206P | Q7Z7F0 | protein_coding | tolerated(0.35) | benign(0.003) | TCGA-D8-A1JI-01 | Breast | breast invasive carcinoma | Female | <65 | I/II | Chemotherapy | doxorubicine | SD |
| KIAA0907 | SNV | Missense_Mutation | novel | c.617N>C | p.His206Pro | p.H206P | Q7Z7F0 | protein_coding | tolerated(0.35) | benign(0.003) | TCGA-D8-A1X7-01 | Breast | breast invasive carcinoma | Female | <65 | I/II | ChemotherapyHormone Therapy | doxorubicine+cyclophosphamide+tamoxifen | SD |
| KIAA0907 | SNV | Missense_Mutation | c.1743N>A | p.His581Gln | p.H581Q | Q7Z7F0 | protein_coding | tolerated_low_confidence(0.17) | benign(0.005) | TCGA-D8-A1XK-01 | Breast | breast invasive carcinoma | Female | <65 | I/II | Chemotherapy | doxorubicine+cyclophosphamide | SD | |
| KIAA0907 | SNV | Missense_Mutation | novel | c.1394C>G | p.Thr465Arg | p.T465R | Q7Z7F0 | protein_coding | tolerated(0.16) | probably_damaging(0.994) | TCGA-PL-A8LV-01 | Breast | breast invasive carcinoma | Female | <65 | III/IV | Unknown | Unknown | SD |
| KIAA0907 | insertion | Frame_Shift_Ins | novel | c.1618_1619insATCACACC | p.Gly540AspfsTer8 | p.G540Dfs*8 | Q7Z7F0 | protein_coding | TCGA-A8-A08H-01 | Breast | breast invasive carcinoma | Female | >=65 | I/II | Unknown | Unknown | SD | ||
| KIAA0907 | insertion | Frame_Shift_Ins | novel | c.1617_1618insCACTTGAACTTGGGAGGTGGAGGTTGCCGTGAGCCAA | p.Gly540HisfsTer22 | p.G540Hfs*22 | Q7Z7F0 | protein_coding | TCGA-A8-A08H-01 | Breast | breast invasive carcinoma | Female | >=65 | I/II | Unknown | Unknown | SD |
| Page: 1 2 3 4 5 6 7 8 |
Top |
Related drugs of malignant transformation related genes |
| Identification of chemicals and drugs interact with genes involved in malignant transfromation |
| (DGIdb 4.0) |
| Entrez ID | Symbol | Category | Interaction Types | Drug Claim Name | Drug Name | PMIDs |
| Page: 1 |

Copyright 2023-Present -The University of Texas Health Science Center at Houston |