
|
|||||
|
 | |
| |
| |
| |
| |
| |
|
Gene: KIAA0586 |
Gene summary for KIAA0586 |
| Gene information | Species | Human | Gene symbol | KIAA0586 | Gene ID | 9786 |
| Gene name | KIAA0586 | |
| Gene Alias | JBTS23 | |
| Cytomap | 14q23.1 | |
| Gene Type | protein-coding | GO ID | GO:0006996 | UniProtAcc | Q9BVV6 |
Top |
Malignant transformation analysis |
| Identification of the aberrant gene expression in precancerous and cancerous lesions by comparing the gene expression of stem-like cells in diseased tissues with normal stem cells |
| Entrez ID | Symbol | Replicates | Species | Organ | Tissue | Adj P-value | Log2FC | Malignancy |
| 9786 | KIAA0586 | LZE4T | Human | Esophagus | ESCC | 4.91e-11 | 2.57e-01 | 0.0811 |
| 9786 | KIAA0586 | LZE5T | Human | Esophagus | ESCC | 8.31e-04 | 2.48e-01 | 0.0514 |
| 9786 | KIAA0586 | LZE21D1 | Human | Esophagus | HGIN | 2.96e-02 | 2.24e-01 | 0.0632 |
| 9786 | KIAA0586 | LZE24T | Human | Esophagus | ESCC | 1.33e-04 | 1.46e-01 | 0.0596 |
| 9786 | KIAA0586 | P1T-E | Human | Esophagus | ESCC | 3.86e-02 | 1.81e-01 | 0.0875 |
| 9786 | KIAA0586 | P2T-E | Human | Esophagus | ESCC | 2.05e-07 | 1.80e-01 | 0.1177 |
| 9786 | KIAA0586 | P4T-E | Human | Esophagus | ESCC | 1.41e-04 | 2.12e-01 | 0.1323 |
| 9786 | KIAA0586 | P5T-E | Human | Esophagus | ESCC | 1.78e-03 | 9.30e-02 | 0.1327 |
| 9786 | KIAA0586 | P8T-E | Human | Esophagus | ESCC | 2.02e-06 | 1.49e-01 | 0.0889 |
| 9786 | KIAA0586 | P9T-E | Human | Esophagus | ESCC | 3.50e-03 | 8.31e-02 | 0.1131 |
| 9786 | KIAA0586 | P10T-E | Human | Esophagus | ESCC | 4.12e-11 | 1.92e-01 | 0.116 |
| 9786 | KIAA0586 | P12T-E | Human | Esophagus | ESCC | 9.02e-11 | 2.52e-01 | 0.1122 |
| 9786 | KIAA0586 | P15T-E | Human | Esophagus | ESCC | 1.33e-12 | 3.37e-01 | 0.1149 |
| 9786 | KIAA0586 | P16T-E | Human | Esophagus | ESCC | 4.17e-05 | 1.22e-01 | 0.1153 |
| 9786 | KIAA0586 | P17T-E | Human | Esophagus | ESCC | 1.83e-02 | 1.70e-01 | 0.1278 |
| 9786 | KIAA0586 | P19T-E | Human | Esophagus | ESCC | 2.12e-03 | 2.46e-01 | 0.1662 |
| 9786 | KIAA0586 | P20T-E | Human | Esophagus | ESCC | 1.97e-02 | 1.17e-01 | 0.1124 |
| 9786 | KIAA0586 | P21T-E | Human | Esophagus | ESCC | 4.17e-05 | 1.27e-01 | 0.1617 |
| 9786 | KIAA0586 | P23T-E | Human | Esophagus | ESCC | 4.80e-10 | 1.60e-01 | 0.108 |
| 9786 | KIAA0586 | P24T-E | Human | Esophagus | ESCC | 2.02e-06 | 1.72e-01 | 0.1287 |
| Page: 1 2 3 |
| Tissue | Expression Dynamics | Abbreviation |
| Esophagus | 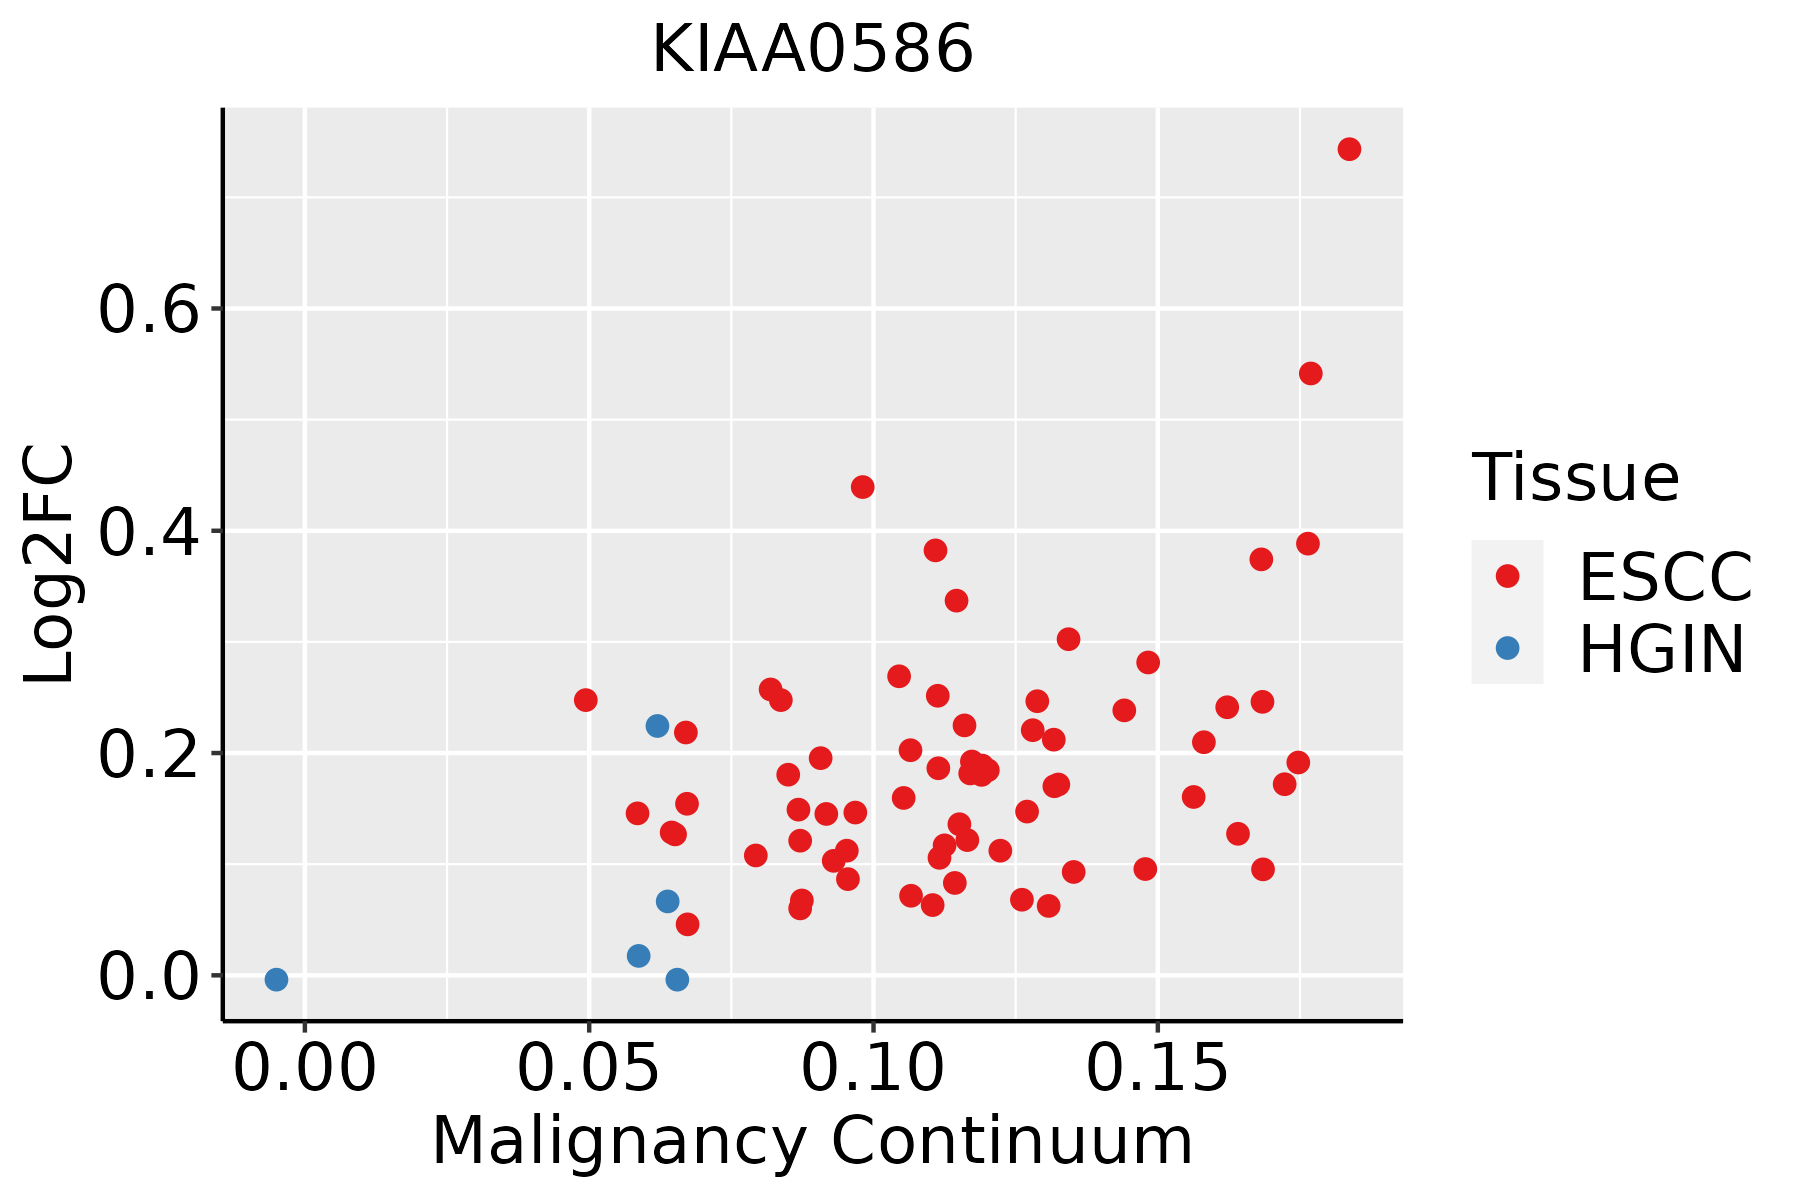 | ESCC: Esophageal squamous cell carcinoma |
| HGIN: High-grade intraepithelial neoplasias | ||
| LGIN: Low-grade intraepithelial neoplasias |
| ∗log2FC in expression of this searched gene in stem-like cells from each diseased tissue sample relative to stem-like cells in normal samples in each tissue plotted against the malignancy continuum. Samples are colored based on if they are from different disease stage. |
Top |
Malignant transformation related pathway analysis |
| Find out the enriched GO biological processes and KEGG pathways involved in transition from healthy to precancer to cancer |
| Tissue | Disease Stage | Enriched GO biological Processes |
| Colorectum | AD |  |
| Colorectum | SER |  |
| Colorectum | MSS |  |
| Colorectum | MSI-H |  |
| Colorectum | FAP |  |
| ∗Top 15 enriched GO BP terms are showed in the bar plot of each disease state in each tissue. Each row represents a significant GO biological process which is colored according to the -log10(p.adjust). |
| Page: 1 2 3 4 5 6 7 8 9 |
| GO ID | Tissue | Disease Stage | Description | Gene Ratio | Bg Ratio | pvalue | p.adjust | Count |
| Page: 1 |
| Pathway ID | Tissue | Disease Stage | Description | Gene Ratio | Bg Ratio | pvalue | p.adjust | qvalue | Count |
| Page: 1 |
Top |
Cell-cell communication analysis |
| Identification of potential cell-cell interactions between two cell types and their ligand-receptor pairs for different disease states |
| Ligand | Receptor | LRpair | Pathway | Tissue | Disease Stage |
| Page: 1 |
Top |
Single-cell gene regulatory network inference analysis |
| Find out the significant the regulons (TFs) and the target genes of each regulon across cell types for different disease states |
| TF | Cell Type | Tissue | Disease Stage | Target Gene | RSS | Regulon Activity |
| ∗The dot plots of a searched regulon are shown for all cell subpopulations in each disease state of each tissue based on the regulon specific score inferred using pySCENIC and by calculating the average expression. |
| Page: 1 |
Top |
Somatic mutation of malignant transformation related genes |
| Annotation of somatic variants for genes involved in malignant transformation |
| Hugo Symbol | Variant Class | Variant Classification | dbSNP RS | HGVSc | HGVSp | HGVSp Short | SWISSPROT | BIOTYPE | SIFT | PolyPhen | Tumor Sample Barcode | Tissue | Histology | Sex | Age | Stage | Therapy Types | Drugs | Outcome |
| KIAA0586 | SNV | Missense_Mutation | c.2825N>G | p.Ser942Cys | p.S942C | Q9BVV6 | protein_coding | tolerated(0.18) | possibly_damaging(0.614) | TCGA-A2-A0D4-01 | Breast | breast invasive carcinoma | Female | <65 | I/II | Chemotherapy | adriamycin | SD | |
| KIAA0586 | SNV | Missense_Mutation | c.715N>A | p.Ala239Thr | p.A239T | Q9BVV6 | protein_coding | deleterious(0.01) | probably_damaging(0.998) | TCGA-A8-A07W-01 | Breast | breast invasive carcinoma | Female | >=65 | III/IV | Hormone Therapy | exemestane | SD | |
| KIAA0586 | SNV | Missense_Mutation | novel | c.395N>A | p.Ser132Tyr | p.S132Y | Q9BVV6 | protein_coding | deleterious(0) | possibly_damaging(0.509) | TCGA-AN-A046-01 | Breast | breast invasive carcinoma | Female | >=65 | I/II | Unknown | Unknown | SD |
| KIAA0586 | SNV | Missense_Mutation | c.649N>G | p.Gln217Glu | p.Q217E | Q9BVV6 | protein_coding | tolerated(0.1) | benign(0.359) | TCGA-D8-A1JA-01 | Breast | breast invasive carcinoma | Female | <65 | III/IV | Chemotherapy | adriamycin | PD | |
| KIAA0586 | SNV | Missense_Mutation | c.115C>G | p.Gln39Glu | p.Q39E | Q9BVV6 | protein_coding | deleterious(0) | benign(0.043) | TCGA-EW-A1J5-01 | Breast | breast invasive carcinoma | Female | <65 | I/II | Chemotherapy | adriamycin | SD | |
| KIAA0586 | SNV | Missense_Mutation | novel | c.2434N>A | p.Asp812Asn | p.D812N | Q9BVV6 | protein_coding | tolerated(0.46) | possibly_damaging(0.905) | TCGA-PE-A5DE-01 | Breast | breast invasive carcinoma | Female | <65 | I/II | Chemotherapy | taxotere | CR |
| KIAA0586 | SNV | Missense_Mutation | novel | c.61N>A | p.Glu21Lys | p.E21K | Q9BVV6 | protein_coding | deleterious_low_confidence(0.02) | benign(0.003) | TCGA-Z7-A8R6-01 | Breast | breast invasive carcinoma | Female | <65 | I/II | Chemotherapy | taxol | CR |
| KIAA0586 | insertion | Nonsense_Mutation | novel | c.4275_4276insCATACCAGCATTTAGTGGTTTT | p.Asp1426HisfsTer5 | p.D1426Hfs*5 | Q9BVV6 | protein_coding | TCGA-BH-A0DS-01 | Breast | breast invasive carcinoma | Female | >=65 | III/IV | Chemotherapy | cyclophosphamide | SD | ||
| KIAA0586 | insertion | Nonsense_Mutation | novel | c.4910_4911insTCTTCACTGACACTATTTTATCCTCACTATACTGTGCAAAGTAGGT | p.Gln1638LeufsTer3 | p.Q1638Lfs*3 | Q9BVV6 | protein_coding | TCGA-BH-A0HU-01 | Breast | breast invasive carcinoma | Female | <65 | I/II | Chemotherapy | docetaxel | SD | ||
| KIAA0586 | deletion | Frame_Shift_Del | novel | c.2778delN | p.Ile927SerfsTer55 | p.I927Sfs*55 | Q9BVV6 | protein_coding | TCGA-D8-A27V-01 | Breast | breast invasive carcinoma | Female | <65 | I/II | Hormone Therapy | tamoxiphen | SD |
| Page: 1 2 3 4 5 6 7 8 9 10 11 12 13 14 15 16 |
Top |
Related drugs of malignant transformation related genes |
| Identification of chemicals and drugs interact with genes involved in malignant transfromation |
| (DGIdb 4.0) |
| Entrez ID | Symbol | Category | Interaction Types | Drug Claim Name | Drug Name | PMIDs |
| Page: 1 |

Copyright 2023-Present -The University of Texas Health Science Center at Houston |