
|
|||||
|
 | |
| |
| |
| |
| |
| |
|
Gene: KIAA0368 |
Gene summary for KIAA0368 |
| Gene information | Species | Human | Gene symbol | KIAA0368 | Gene ID | 23392 |
| Gene name | Ecm29 proteasome adaptor and scaffold | |
| Gene Alias | ECM29 | |
| Cytomap | 9q31.3 | |
| Gene Type | protein-coding | GO ID | GO:0006508 | UniProtAcc | NA |
Top |
Malignant transformation analysis |
| Identification of the aberrant gene expression in precancerous and cancerous lesions by comparing the gene expression of stem-like cells in diseased tissues with normal stem cells |
| Entrez ID | Symbol | Replicates | Species | Organ | Tissue | Adj P-value | Log2FC | Malignancy |
| 23392 | KIAA0368 | HTA11_99999970781_79442 | Human | Colorectum | MSS | 4.12e-43 | 7.58e-01 | 0.294 |
| 23392 | KIAA0368 | HTA11_99999965062_69753 | Human | Colorectum | MSI-H | 5.11e-13 | 1.58e+00 | 0.3487 |
| 23392 | KIAA0368 | HTA11_99999965104_69814 | Human | Colorectum | MSS | 2.99e-33 | 8.59e-01 | 0.281 |
| 23392 | KIAA0368 | HTA11_99999971662_82457 | Human | Colorectum | MSS | 2.49e-45 | 7.91e-01 | 0.3859 |
| 23392 | KIAA0368 | HTA11_99999973899_84307 | Human | Colorectum | MSS | 1.57e-07 | 3.35e-01 | 0.2585 |
| 23392 | KIAA0368 | HTA11_99999974143_84620 | Human | Colorectum | MSS | 7.63e-19 | 3.75e-01 | 0.3005 |
| 23392 | KIAA0368 | P1T-E | Human | Esophagus | ESCC | 7.20e-08 | 4.51e-01 | 0.0875 |
| 23392 | KIAA0368 | P2T-E | Human | Esophagus | ESCC | 3.16e-29 | 5.26e-01 | 0.1177 |
| 23392 | KIAA0368 | P4T-E | Human | Esophagus | ESCC | 1.46e-07 | 1.30e-01 | 0.1323 |
| 23392 | KIAA0368 | P5T-E | Human | Esophagus | ESCC | 9.20e-21 | 3.54e-01 | 0.1327 |
| 23392 | KIAA0368 | P8T-E | Human | Esophagus | ESCC | 7.74e-14 | 1.66e-01 | 0.0889 |
| 23392 | KIAA0368 | P9T-E | Human | Esophagus | ESCC | 1.01e-08 | 2.07e-01 | 0.1131 |
| 23392 | KIAA0368 | P10T-E | Human | Esophagus | ESCC | 2.43e-15 | 2.04e-01 | 0.116 |
| 23392 | KIAA0368 | P11T-E | Human | Esophagus | ESCC | 6.82e-04 | 3.29e-01 | 0.1426 |
| 23392 | KIAA0368 | P12T-E | Human | Esophagus | ESCC | 3.11e-14 | 2.03e-01 | 0.1122 |
| 23392 | KIAA0368 | P15T-E | Human | Esophagus | ESCC | 4.38e-13 | 2.99e-01 | 0.1149 |
| 23392 | KIAA0368 | P16T-E | Human | Esophagus | ESCC | 2.52e-12 | 9.17e-02 | 0.1153 |
| 23392 | KIAA0368 | P17T-E | Human | Esophagus | ESCC | 2.28e-07 | 4.24e-01 | 0.1278 |
| 23392 | KIAA0368 | P19T-E | Human | Esophagus | ESCC | 3.64e-02 | 3.70e-01 | 0.1662 |
| 23392 | KIAA0368 | P20T-E | Human | Esophagus | ESCC | 1.14e-11 | 8.94e-02 | 0.1124 |
| Page: 1 2 3 4 5 6 |
| Tissue | Expression Dynamics | Abbreviation |
| Colorectum (GSE201348) |  | FAP: Familial adenomatous polyposis |
| CRC: Colorectal cancer | ||
| Colorectum (HTA11) |  | AD: Adenomas |
| SER: Sessile serrated lesions | ||
| MSI-H: Microsatellite-high colorectal cancer | ||
| MSS: Microsatellite stable colorectal cancer | ||
| Esophagus | 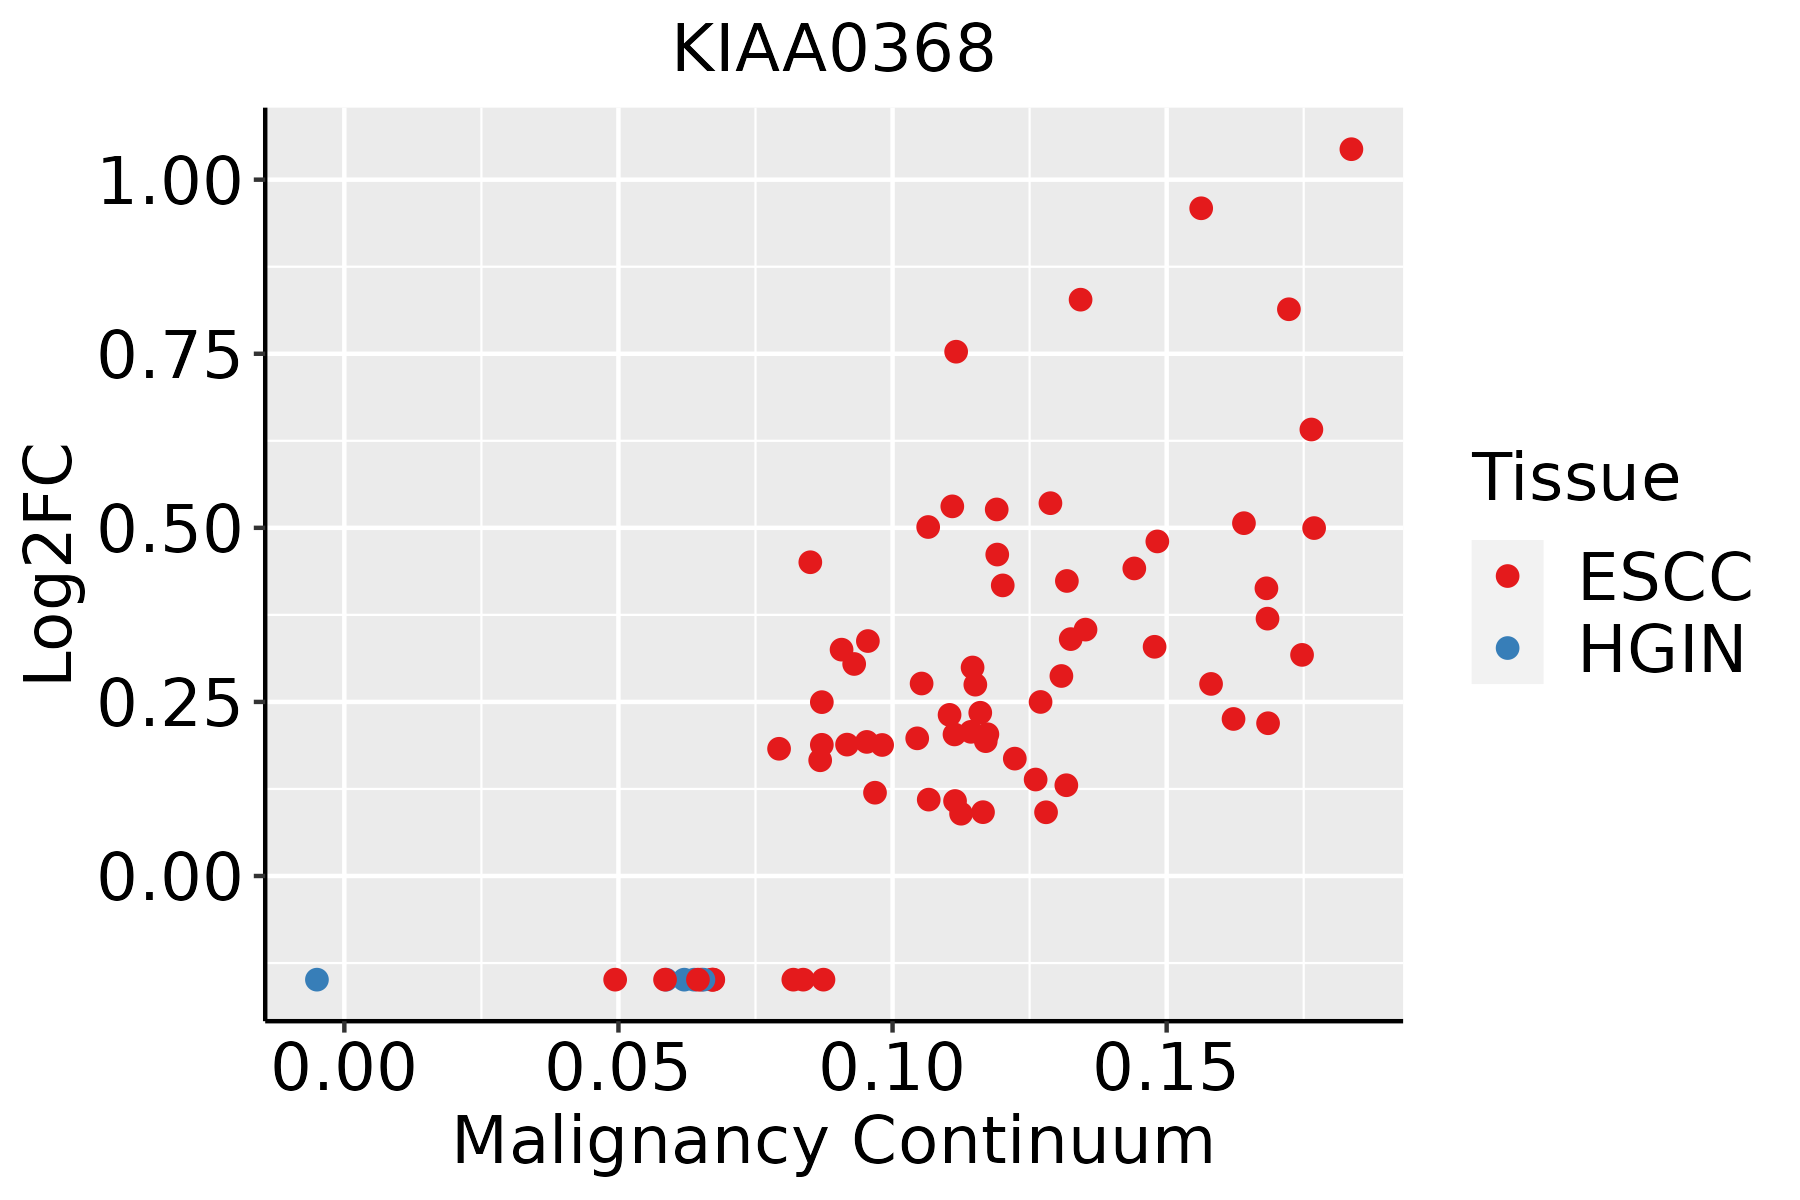 | ESCC: Esophageal squamous cell carcinoma |
| HGIN: High-grade intraepithelial neoplasias | ||
| LGIN: Low-grade intraepithelial neoplasias | ||
| Liver | 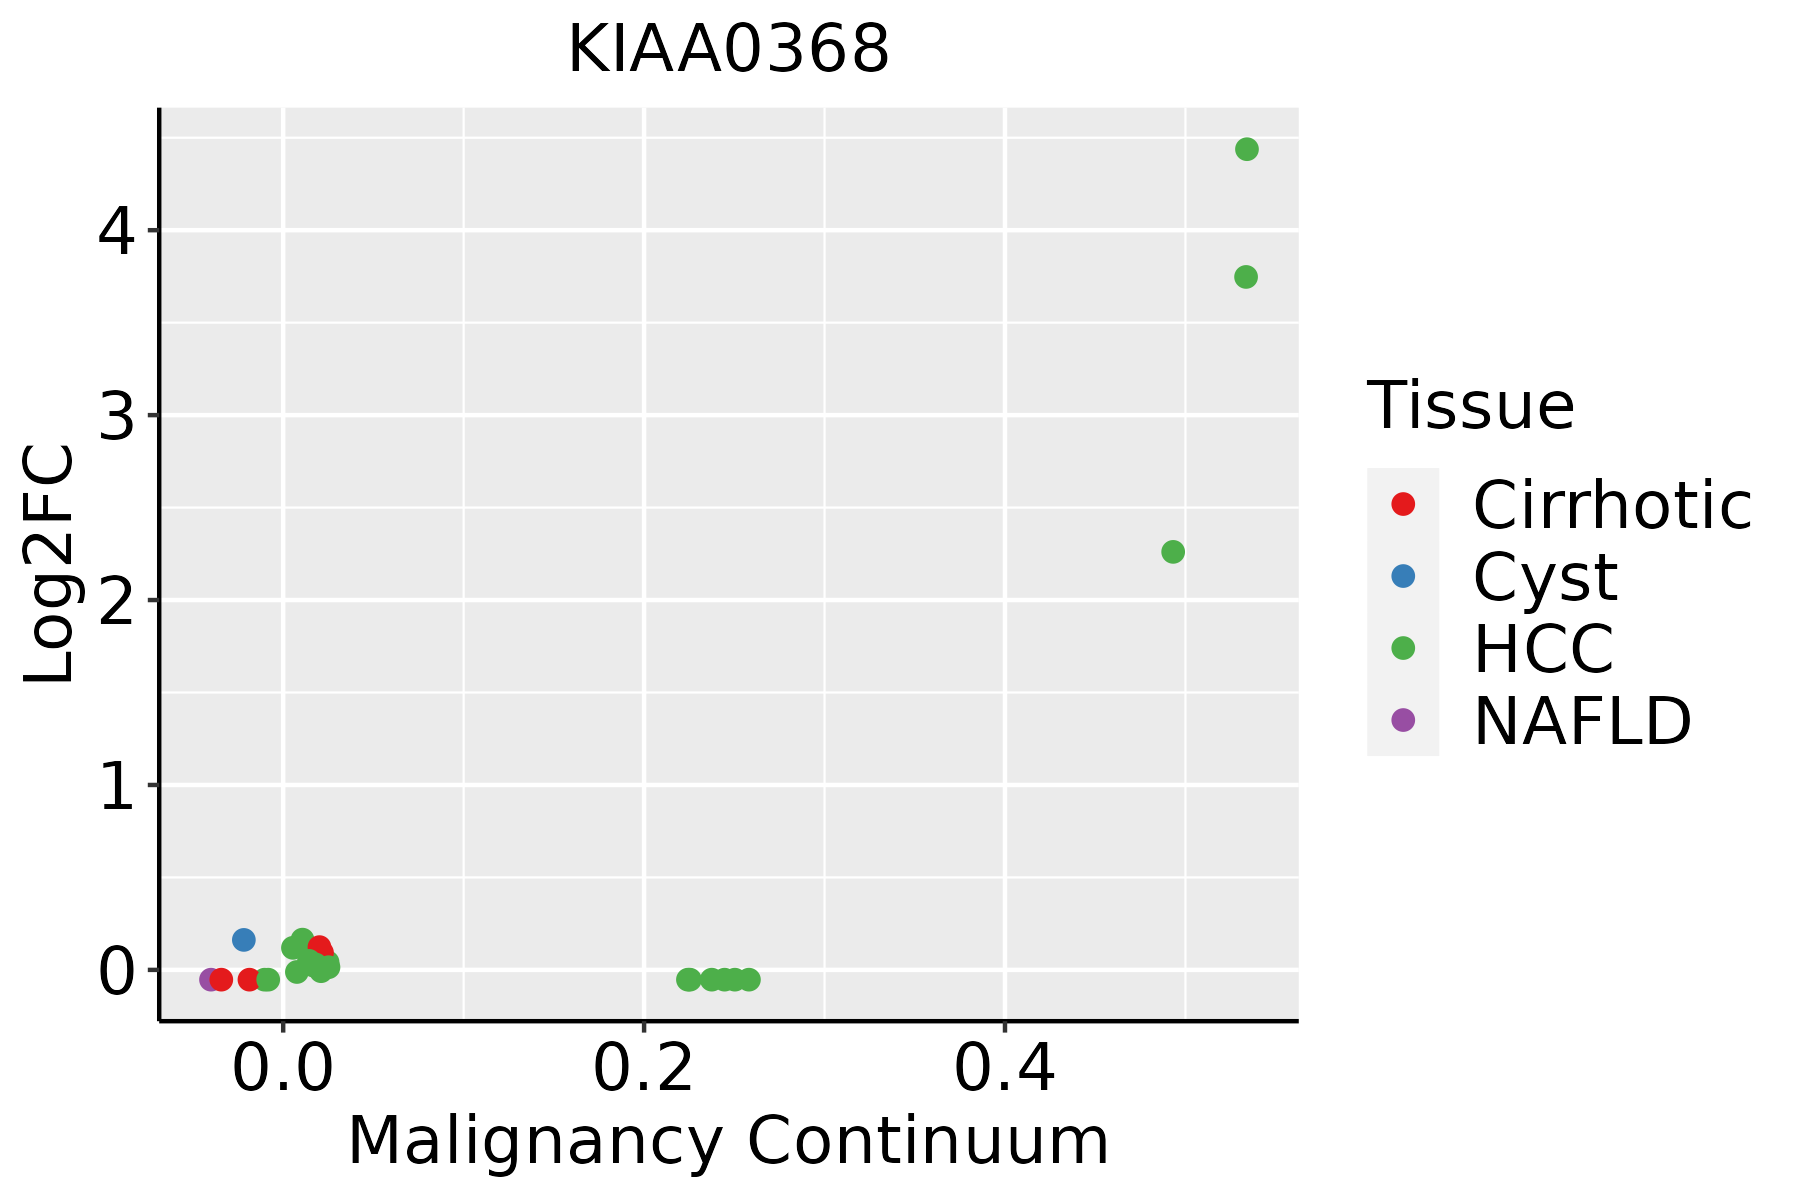 | HCC: Hepatocellular carcinoma |
| NAFLD: Non-alcoholic fatty liver disease | ||
| Oral Cavity | 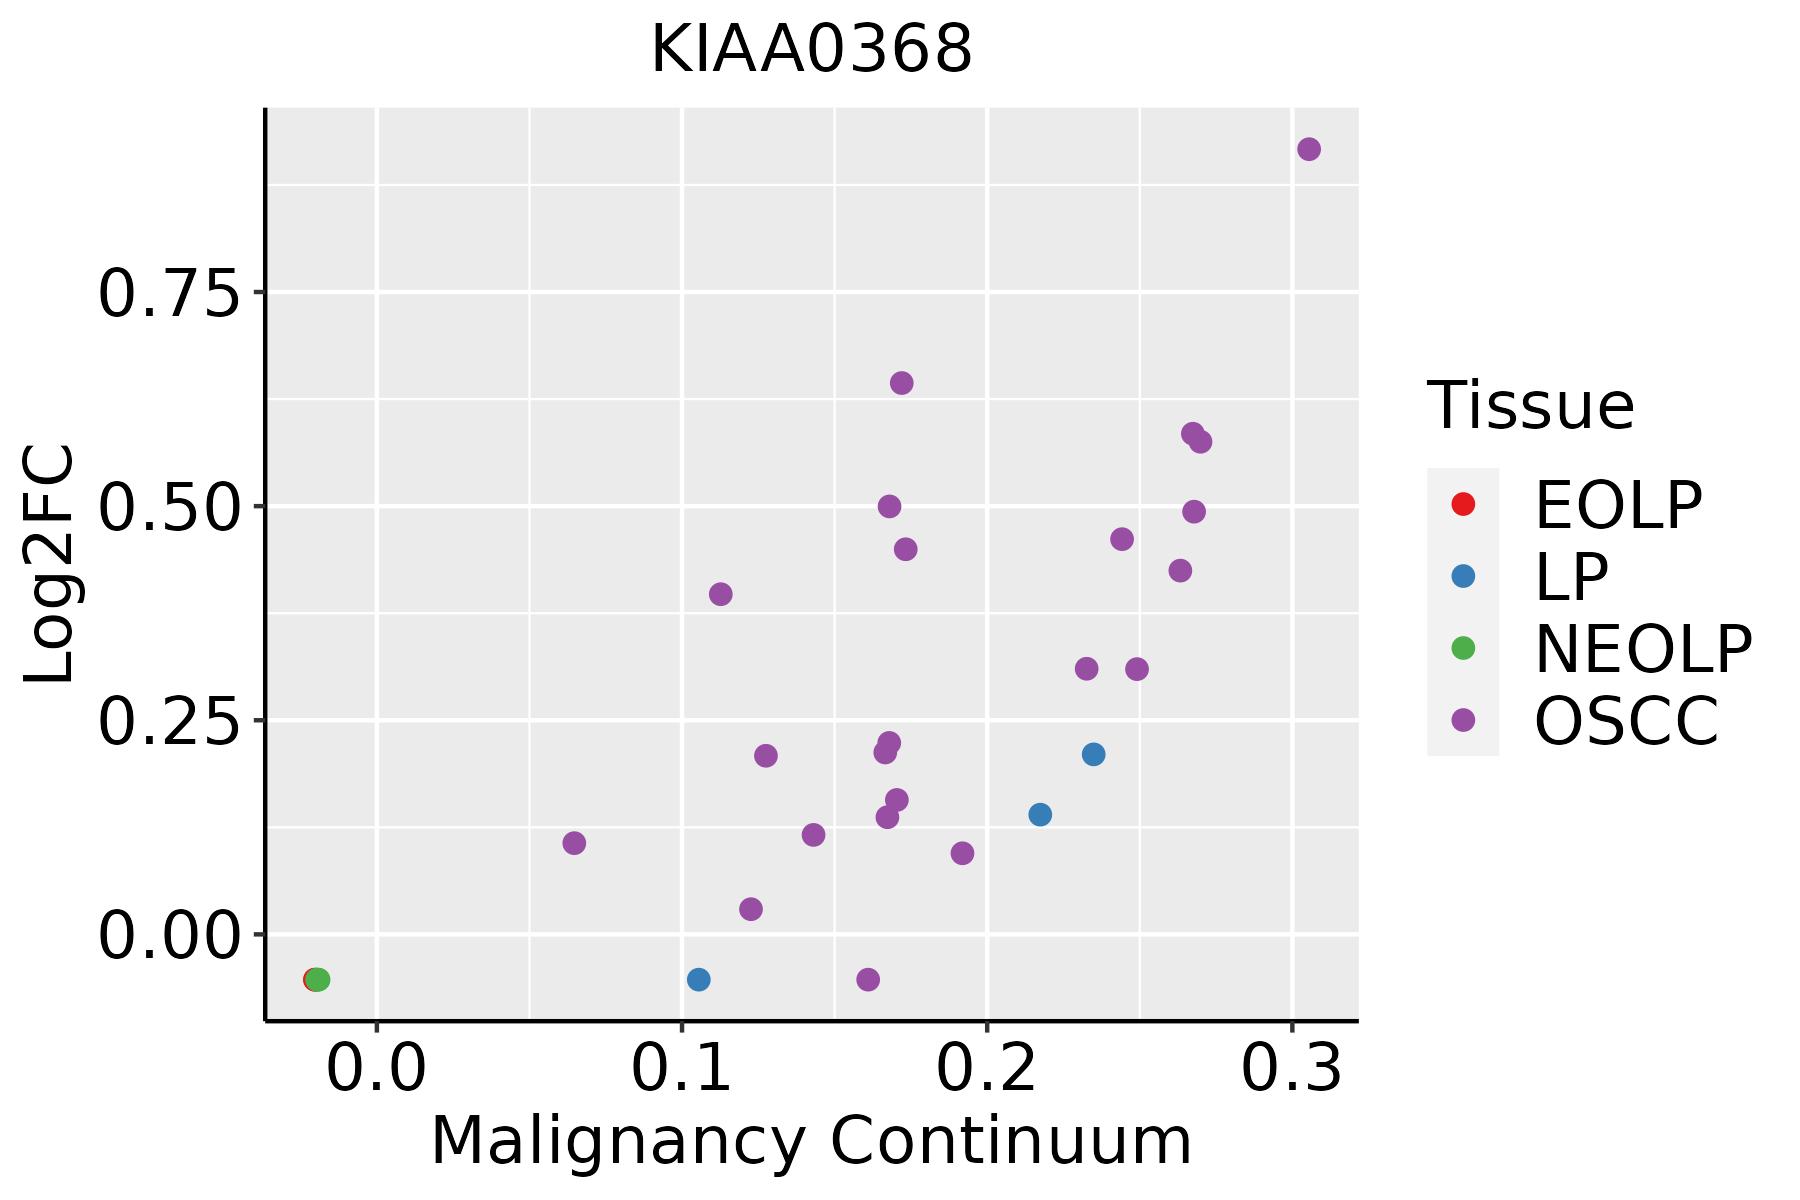 | EOLP: Erosive Oral lichen planus |
| LP: leukoplakia | ||
| NEOLP: Non-erosive oral lichen planus | ||
| OSCC: Oral squamous cell carcinoma | ||
| Prostate |  | BPH: Benign Prostatic Hyperplasia |
| ∗log2FC in expression of this searched gene in stem-like cells from each diseased tissue sample relative to stem-like cells in normal samples in each tissue plotted against the malignancy continuum. Samples are colored based on if they are from different disease stage. |
Top |
Malignant transformation related pathway analysis |
| Find out the enriched GO biological processes and KEGG pathways involved in transition from healthy to precancer to cancer |
| Tissue | Disease Stage | Enriched GO biological Processes |
| Colorectum | AD |  |
| Colorectum | SER |  |
| Colorectum | MSS |  |
| Colorectum | MSI-H |  |
| Colorectum | FAP |  |
| ∗Top 15 enriched GO BP terms are showed in the bar plot of each disease state in each tissue. Each row represents a significant GO biological process which is colored according to the -log10(p.adjust). |
| Page: 1 2 3 4 5 6 7 8 9 |
| GO ID | Tissue | Disease Stage | Description | Gene Ratio | Bg Ratio | pvalue | p.adjust | Count |
| Page: 1 |
| Pathway ID | Tissue | Disease Stage | Description | Gene Ratio | Bg Ratio | pvalue | p.adjust | qvalue | Count |
| Page: 1 |
Top |
Cell-cell communication analysis |
| Identification of potential cell-cell interactions between two cell types and their ligand-receptor pairs for different disease states |
| Ligand | Receptor | LRpair | Pathway | Tissue | Disease Stage |
| Page: 1 |
Top |
Single-cell gene regulatory network inference analysis |
| Find out the significant the regulons (TFs) and the target genes of each regulon across cell types for different disease states |
| TF | Cell Type | Tissue | Disease Stage | Target Gene | RSS | Regulon Activity |
| ∗The dot plots of a searched regulon are shown for all cell subpopulations in each disease state of each tissue based on the regulon specific score inferred using pySCENIC and by calculating the average expression. |
| Page: 1 |
Top |
Somatic mutation of malignant transformation related genes |
| Annotation of somatic variants for genes involved in malignant transformation |
| Hugo Symbol | Variant Class | Variant Classification | dbSNP RS | HGVSc | HGVSp | HGVSp Short | SWISSPROT | BIOTYPE | SIFT | PolyPhen | Tumor Sample Barcode | Tissue | Histology | Sex | Age | Stage | Therapy Types | Drugs | Outcome |
| KIAA0368 | SNV | Missense_Mutation | c.1820C>G | p.Thr607Ser | p.T607S | protein_coding | tolerated(0.11) | benign(0.098) | TCGA-A2-A04T-01 | Breast | breast invasive carcinoma | Female | <65 | I/II | Chemotherapy | cyclophosphamide | SD | ||
| KIAA0368 | SNV | Missense_Mutation | c.4230N>T | p.Met1410Ile | p.M1410I | protein_coding | tolerated(0.43) | benign(0.01) | TCGA-A8-A08R-01 | Breast | breast invasive carcinoma | Female | <65 | I/II | Unknown | Unknown | SD | ||
| KIAA0368 | SNV | Missense_Mutation | rs781679050 | c.4564T>C | p.Tyr1522His | p.Y1522H | protein_coding | tolerated(0.25) | benign(0.073) | TCGA-A8-A09Z-01 | Breast | breast invasive carcinoma | Female | >=65 | I/II | Unknown | Unknown | SD | |
| KIAA0368 | SNV | Missense_Mutation | novel | c.3830N>G | p.Phe1277Cys | p.F1277C | protein_coding | deleterious(0) | probably_damaging(0.997) | TCGA-AN-A046-01 | Breast | breast invasive carcinoma | Female | >=65 | I/II | Unknown | Unknown | SD | |
| KIAA0368 | SNV | Missense_Mutation | rs146690306 | c.1949N>A | p.Arg650Gln | p.R650Q | protein_coding | tolerated(0.36) | benign(0.04) | TCGA-AN-A046-01 | Breast | breast invasive carcinoma | Female | >=65 | I/II | Unknown | Unknown | SD | |
| KIAA0368 | SNV | Missense_Mutation | c.2365N>T | p.Ala789Ser | p.A789S | protein_coding | tolerated(0.75) | benign(0.007) | TCGA-AR-A256-01 | Breast | breast invasive carcinoma | Female | <65 | I/II | Chemotherapy | doxorubicin | PD | ||
| KIAA0368 | SNV | Missense_Mutation | novel | c.4164N>G | p.Ile1388Met | p.I1388M | protein_coding | deleterious(0.01) | probably_damaging(0.999) | TCGA-BH-A0B6-01 | Breast | breast invasive carcinoma | Female | <65 | I/II | Unknown | Unknown | SD | |
| KIAA0368 | SNV | Missense_Mutation | c.4498G>T | p.Asp1500Tyr | p.D1500Y | protein_coding | deleterious(0) | probably_damaging(1) | TCGA-D8-A1XL-01 | Breast | breast invasive carcinoma | Female | <65 | I/II | Chemotherapy | doxorubicine+cyclophosphamide+tamoxifen | SD | ||
| KIAA0368 | SNV | Missense_Mutation | c.3113G>T | p.Gly1038Val | p.G1038V | protein_coding | deleterious(0) | probably_damaging(0.998) | TCGA-E2-A15H-01 | Breast | breast invasive carcinoma | Female | <65 | I/II | Chemotherapy | herceptin | SD | ||
| KIAA0368 | SNV | Missense_Mutation | c.1127C>A | p.Ser376Tyr | p.S376Y | protein_coding | deleterious(0) | possibly_damaging(0.77) | TCGA-PE-A5DE-01 | Breast | breast invasive carcinoma | Female | <65 | I/II | Chemotherapy | taxotere | CR |
| Page: 1 2 3 4 5 6 7 8 9 10 11 12 13 14 15 16 17 |
Top |
Related drugs of malignant transformation related genes |
| Identification of chemicals and drugs interact with genes involved in malignant transfromation |
| (DGIdb 4.0) |
| Entrez ID | Symbol | Category | Interaction Types | Drug Claim Name | Drug Name | PMIDs |
| Page: 1 |

Copyright 2023-Present -The University of Texas Health Science Center at Houston |