
|
|||||
|
 | |
| |
| |
| |
| |
| |
|
Gene: KIAA0355 |
Gene summary for KIAA0355 |
| Gene information | Species | Human | Gene symbol | KIAA0355 | Gene ID | 9710 |
| Gene name | granule associated Rac and RHOG effector 1 | |
| Gene Alias | KIAA0355 | |
| Cytomap | 19q13.11 | |
| Gene Type | protein-coding | GO ID | GO:0007154 | UniProtAcc | O15063 |
Top |
Malignant transformation analysis |
| Identification of the aberrant gene expression in precancerous and cancerous lesions by comparing the gene expression of stem-like cells in diseased tissues with normal stem cells |
| Entrez ID | Symbol | Replicates | Species | Organ | Tissue | Adj P-value | Log2FC | Malignancy |
| 9710 | KIAA0355 | S43 | Human | Liver | Cirrhotic | 1.51e-04 | -5.58e-02 | -0.0187 |
| 9710 | KIAA0355 | HCC1_Meng | Human | Liver | HCC | 5.26e-22 | -7.07e-02 | 0.0246 |
| 9710 | KIAA0355 | HCC2_Meng | Human | Liver | HCC | 2.97e-04 | -1.29e-02 | 0.0107 |
| 9710 | KIAA0355 | HCC1 | Human | Liver | HCC | 3.38e-11 | 3.79e+00 | 0.5336 |
| 9710 | KIAA0355 | HCC2 | Human | Liver | HCC | 3.96e-13 | 2.86e+00 | 0.5341 |
| 9710 | KIAA0355 | HTA12-25-1 | Human | Pancreas | PDAC | 3.57e-10 | 6.85e-01 | 0.313 |
| 9710 | KIAA0355 | HTA12-29-1 | Human | Pancreas | PDAC | 1.09e-16 | 4.34e-01 | 0.3722 |
| 9710 | KIAA0355 | HTA12-3-16 | Human | Pancreas | PDAC | 6.59e-03 | 7.95e-01 | 0.1553 |
| 9710 | KIAA0355 | male-WTA | Human | Thyroid | PTC | 9.75e-24 | 2.06e-01 | 0.1037 |
| 9710 | KIAA0355 | PTC01 | Human | Thyroid | PTC | 4.99e-13 | 1.51e-01 | 0.1899 |
| 9710 | KIAA0355 | PTC03 | Human | Thyroid | PTC | 2.02e-11 | 3.99e-01 | 0.1784 |
| 9710 | KIAA0355 | PTC04 | Human | Thyroid | PTC | 3.20e-14 | 3.02e-01 | 0.1927 |
| 9710 | KIAA0355 | PTC05 | Human | Thyroid | PTC | 1.21e-15 | 6.86e-01 | 0.2065 |
| 9710 | KIAA0355 | PTC06 | Human | Thyroid | PTC | 1.04e-36 | 7.40e-01 | 0.2057 |
| 9710 | KIAA0355 | PTC07 | Human | Thyroid | PTC | 2.14e-31 | 5.87e-01 | 0.2044 |
| 9710 | KIAA0355 | ATC11 | Human | Thyroid | ATC | 3.03e-07 | 6.85e-01 | 0.3386 |
| 9710 | KIAA0355 | ATC12 | Human | Thyroid | ATC | 3.46e-29 | 5.66e-01 | 0.34 |
| 9710 | KIAA0355 | ATC13 | Human | Thyroid | ATC | 5.12e-69 | 1.28e+00 | 0.34 |
| 9710 | KIAA0355 | ATC2 | Human | Thyroid | ATC | 1.31e-11 | 1.17e+00 | 0.34 |
| 9710 | KIAA0355 | ATC3 | Human | Thyroid | ATC | 8.35e-12 | 7.18e-01 | 0.338 |
| Page: 1 2 |
| Tissue | Expression Dynamics | Abbreviation |
| Liver |  | HCC: Hepatocellular carcinoma |
| NAFLD: Non-alcoholic fatty liver disease | ||
| Thyroid | 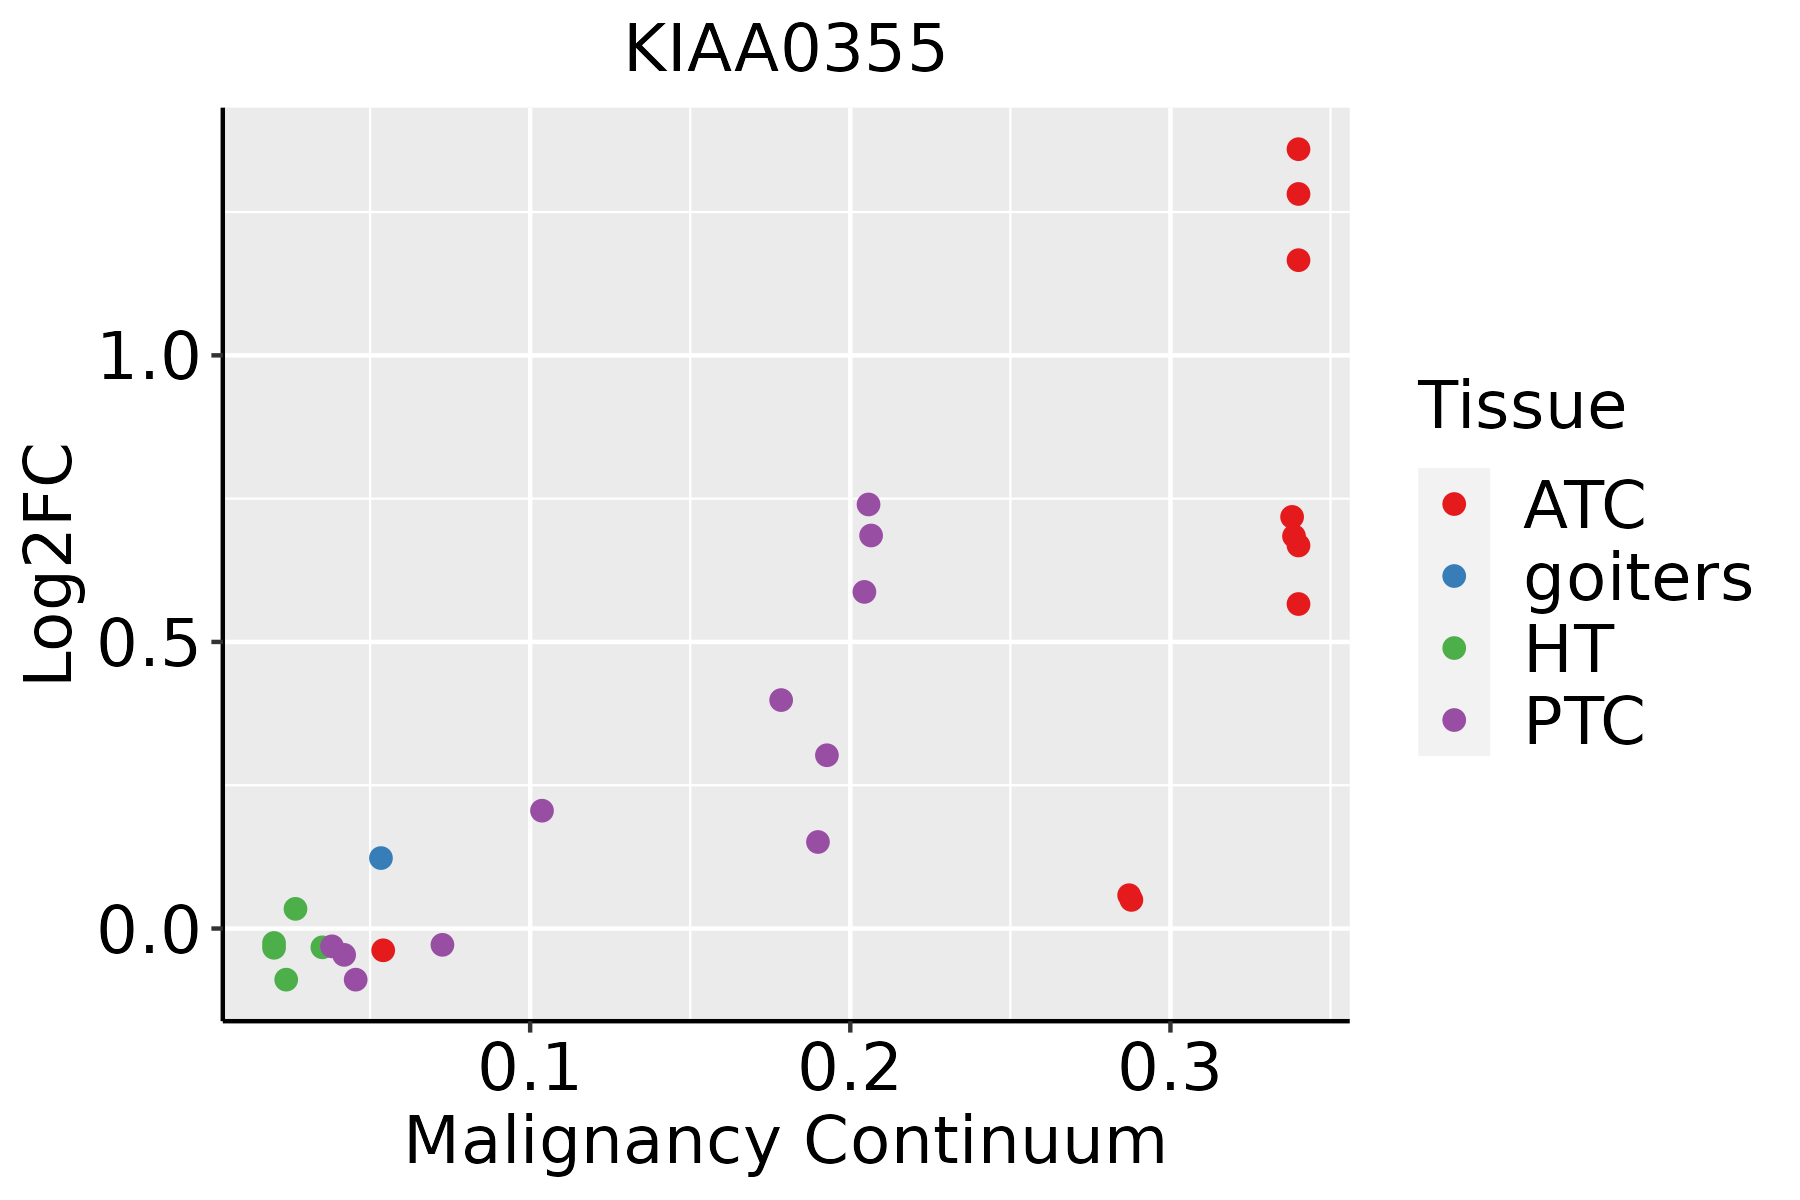 | ATC: Anaplastic thyroid cancer |
| HT: Hashimoto's thyroiditis | ||
| PTC: Papillary thyroid cancer |
| ∗log2FC in expression of this searched gene in stem-like cells from each diseased tissue sample relative to stem-like cells in normal samples in each tissue plotted against the malignancy continuum. Samples are colored based on if they are from different disease stage. |
Top |
Malignant transformation related pathway analysis |
| Find out the enriched GO biological processes and KEGG pathways involved in transition from healthy to precancer to cancer |
| Tissue | Disease Stage | Enriched GO biological Processes |
| Colorectum | AD |  |
| Colorectum | SER |  |
| Colorectum | MSS |  |
| Colorectum | MSI-H |  |
| Colorectum | FAP |  |
| ∗Top 15 enriched GO BP terms are showed in the bar plot of each disease state in each tissue. Each row represents a significant GO biological process which is colored according to the -log10(p.adjust). |
| Page: 1 2 3 4 5 6 7 8 9 |
| GO ID | Tissue | Disease Stage | Description | Gene Ratio | Bg Ratio | pvalue | p.adjust | Count |
| Page: 1 |
| Pathway ID | Tissue | Disease Stage | Description | Gene Ratio | Bg Ratio | pvalue | p.adjust | qvalue | Count |
| Page: 1 |
Top |
Cell-cell communication analysis |
| Identification of potential cell-cell interactions between two cell types and their ligand-receptor pairs for different disease states |
| Ligand | Receptor | LRpair | Pathway | Tissue | Disease Stage |
| Page: 1 |
Top |
Single-cell gene regulatory network inference analysis |
| Find out the significant the regulons (TFs) and the target genes of each regulon across cell types for different disease states |
| TF | Cell Type | Tissue | Disease Stage | Target Gene | RSS | Regulon Activity |
| ∗The dot plots of a searched regulon are shown for all cell subpopulations in each disease state of each tissue based on the regulon specific score inferred using pySCENIC and by calculating the average expression. |
| Page: 1 |
Top |
Somatic mutation of malignant transformation related genes |
| Annotation of somatic variants for genes involved in malignant transformation |
| Hugo Symbol | Variant Class | Variant Classification | dbSNP RS | HGVSc | HGVSp | HGVSp Short | SWISSPROT | BIOTYPE | SIFT | PolyPhen | Tumor Sample Barcode | Tissue | Histology | Sex | Age | Stage | Therapy Types | Drugs | Outcome |
| KIAA0355 | SNV | Missense_Mutation | novel | c.1942G>A | p.Glu648Lys | p.E648K | O15063 | protein_coding | deleterious_low_confidence(0.02) | benign(0.158) | TCGA-AC-A3W7-01 | Breast | breast invasive carcinoma | Female | >=65 | I/II | Hormone Therapy | femara | SD |
| KIAA0355 | SNV | Missense_Mutation | c.1555N>T | p.Asp519Tyr | p.D519Y | O15063 | protein_coding | deleterious(0) | probably_damaging(0.998) | TCGA-D8-A27G-01 | Breast | breast invasive carcinoma | Female | >=65 | I/II | Unknown | Unknown | SD | |
| KIAA0355 | SNV | Missense_Mutation | c.2144N>T | p.Pro715Leu | p.P715L | O15063 | protein_coding | tolerated_low_confidence(0.26) | benign(0) | TCGA-E2-A1B0-01 | Breast | breast invasive carcinoma | Female | <65 | III/IV | Chemotherapy | cytoxan | SD | |
| KIAA0355 | SNV | Missense_Mutation | novel | c.2683N>A | p.Glu895Lys | p.E895K | O15063 | protein_coding | deleterious_low_confidence(0.01) | probably_damaging(0.991) | TCGA-E2-A1LG-01 | Breast | breast invasive carcinoma | Female | <65 | I/II | Chemotherapy | doxorubicin | SD |
| KIAA0355 | insertion | In_Frame_Ins | novel | c.3005_3006insGTTGGGAAAAGTAGTAATTAG | p.Thr1002_Ser1003insLeuGlyLysValValIleSer | p.T1002_S1003insLGKVVIS | O15063 | protein_coding | TCGA-A2-A0EQ-01 | Breast | breast invasive carcinoma | Female | <65 | I/II | Chemotherapy | adriamycin | SD | ||
| KIAA0355 | insertion | Frame_Shift_Ins | novel | c.3006_3007insTTTCAAAAGT | p.Ser1003PhefsTer4 | p.S1003Ffs*4 | O15063 | protein_coding | TCGA-A2-A0EQ-01 | Breast | breast invasive carcinoma | Female | <65 | I/II | Chemotherapy | adriamycin | SD | ||
| KIAA0355 | insertion | Frame_Shift_Ins | novel | c.3122_3123insCTTGGTTCTTGCAGGAA | p.Pro1042LeufsTer55 | p.P1042Lfs*55 | O15063 | protein_coding | TCGA-BH-A0H7-01 | Breast | breast invasive carcinoma | Female | >=65 | III/IV | Chemotherapy | doxorubicin | SD | ||
| KIAA0355 | insertion | Frame_Shift_Ins | novel | c.3124_3125insACAG | p.Pro1042HisfsTer21 | p.P1042Hfs*21 | O15063 | protein_coding | TCGA-BH-A0H7-01 | Breast | breast invasive carcinoma | Female | >=65 | III/IV | Chemotherapy | doxorubicin | SD | ||
| KIAA0355 | deletion | Frame_Shift_Del | novel | c.1320delN | p.Leu441Ter | p.L441* | O15063 | protein_coding | TCGA-D8-A27V-01 | Breast | breast invasive carcinoma | Female | <65 | I/II | Hormone Therapy | tamoxiphen | SD | ||
| KIAA0355 | SNV | Missense_Mutation | rs199555885 | c.682N>T | p.Arg228Trp | p.R228W | O15063 | protein_coding | deleterious(0.01) | possibly_damaging(0.903) | TCGA-2W-A8YY-01 | Cervix | cervical & endocervical cancer | Female | <65 | I/II | Chemotherapy | cisplatin | CR |
| Page: 1 2 3 4 5 6 7 8 9 |
Top |
Related drugs of malignant transformation related genes |
| Identification of chemicals and drugs interact with genes involved in malignant transfromation |
| (DGIdb 4.0) |
| Entrez ID | Symbol | Category | Interaction Types | Drug Claim Name | Drug Name | PMIDs |
| Page: 1 |

Copyright 2023-Present -The University of Texas Health Science Center at Houston |