
|
|||||
|
 | |
| |
| |
| |
| |
| |
|
Gene: KIAA0040 |
Gene summary for KIAA0040 |
| Gene information | Species | Human | Gene symbol | KIAA0040 | Gene ID | 9674 |
| Gene name | KIAA0040 | |
| Gene Alias | KIAA0040 | |
| Cytomap | 1q25.1 | |
| Gene Type | protein-coding | GO ID | GO:0005575 | UniProtAcc | J3QR46 |
Top |
Malignant transformation analysis |
| Identification of the aberrant gene expression in precancerous and cancerous lesions by comparing the gene expression of stem-like cells in diseased tissues with normal stem cells |
| Entrez ID | Symbol | Replicates | Species | Organ | Tissue | Adj P-value | Log2FC | Malignancy |
| 9674 | KIAA0040 | LZE4T | Human | Esophagus | ESCC | 1.43e-02 | 7.52e-02 | 0.0811 |
| 9674 | KIAA0040 | LZE8T | Human | Esophagus | ESCC | 3.54e-02 | 6.02e-02 | 0.067 |
| 9674 | KIAA0040 | P1T-E | Human | Esophagus | ESCC | 3.92e-02 | 2.26e-01 | 0.0875 |
| 9674 | KIAA0040 | P2T-E | Human | Esophagus | ESCC | 1.02e-21 | 4.87e-01 | 0.1177 |
| 9674 | KIAA0040 | P4T-E | Human | Esophagus | ESCC | 1.07e-02 | 9.88e-02 | 0.1323 |
| 9674 | KIAA0040 | P5T-E | Human | Esophagus | ESCC | 3.36e-06 | 9.75e-02 | 0.1327 |
| 9674 | KIAA0040 | P8T-E | Human | Esophagus | ESCC | 8.26e-03 | 1.04e-02 | 0.0889 |
| 9674 | KIAA0040 | P9T-E | Human | Esophagus | ESCC | 1.02e-05 | 3.73e-01 | 0.1131 |
| 9674 | KIAA0040 | P10T-E | Human | Esophagus | ESCC | 6.49e-42 | 9.47e-01 | 0.116 |
| 9674 | KIAA0040 | P12T-E | Human | Esophagus | ESCC | 3.31e-07 | 1.28e-01 | 0.1122 |
| 9674 | KIAA0040 | P15T-E | Human | Esophagus | ESCC | 1.18e-10 | 5.13e-01 | 0.1149 |
| 9674 | KIAA0040 | P16T-E | Human | Esophagus | ESCC | 3.92e-17 | 3.83e-01 | 0.1153 |
| 9674 | KIAA0040 | P17T-E | Human | Esophagus | ESCC | 1.54e-05 | 3.04e-01 | 0.1278 |
| 9674 | KIAA0040 | P20T-E | Human | Esophagus | ESCC | 1.48e-12 | 4.26e-01 | 0.1124 |
| 9674 | KIAA0040 | P21T-E | Human | Esophagus | ESCC | 2.37e-24 | 5.73e-01 | 0.1617 |
| 9674 | KIAA0040 | P22T-E | Human | Esophagus | ESCC | 1.60e-11 | 1.63e-01 | 0.1236 |
| 9674 | KIAA0040 | P23T-E | Human | Esophagus | ESCC | 7.65e-04 | 3.33e-01 | 0.108 |
| 9674 | KIAA0040 | P24T-E | Human | Esophagus | ESCC | 1.78e-09 | 1.07e-01 | 0.1287 |
| 9674 | KIAA0040 | P26T-E | Human | Esophagus | ESCC | 2.99e-28 | 7.39e-01 | 0.1276 |
| 9674 | KIAA0040 | P27T-E | Human | Esophagus | ESCC | 9.33e-15 | 1.19e-01 | 0.1055 |
| Page: 1 2 3 4 |
| Tissue | Expression Dynamics | Abbreviation |
| Esophagus | 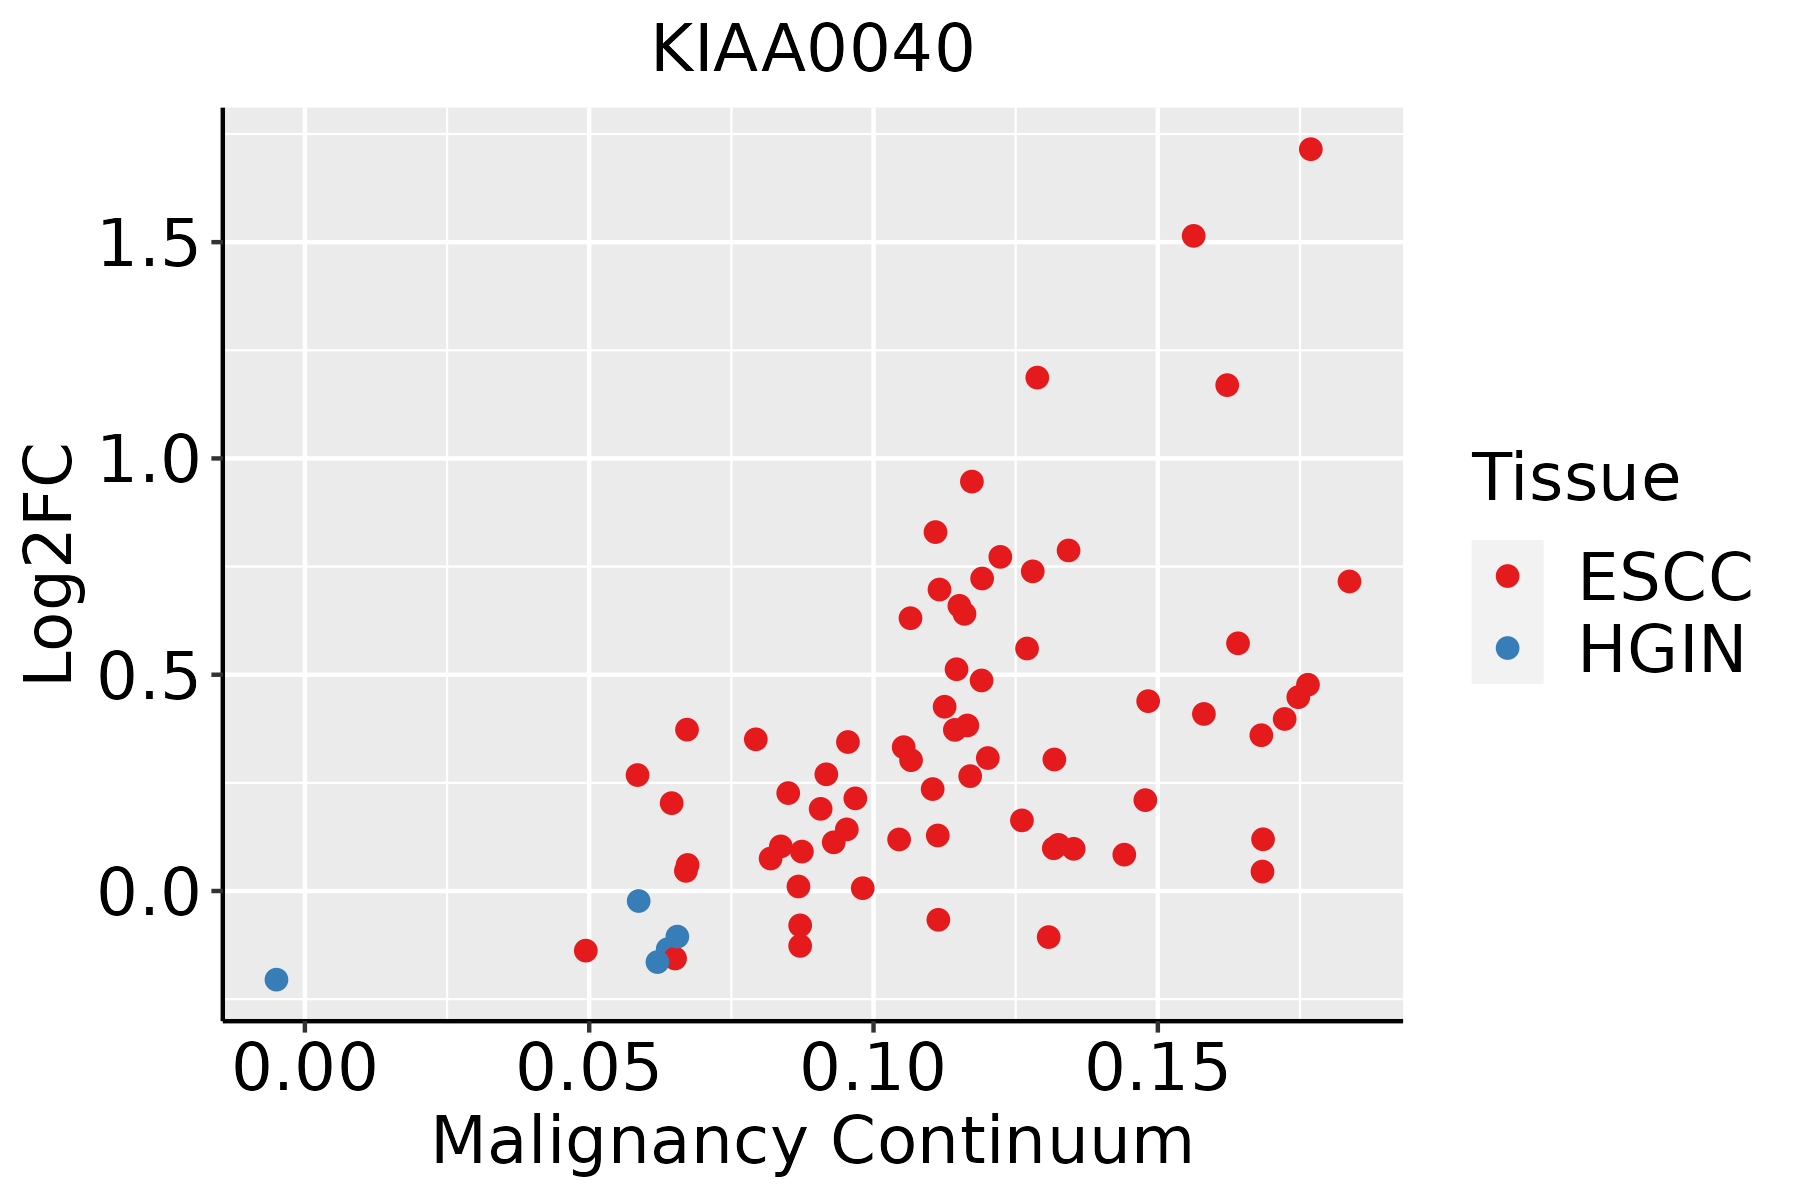 | ESCC: Esophageal squamous cell carcinoma |
| HGIN: High-grade intraepithelial neoplasias | ||
| LGIN: Low-grade intraepithelial neoplasias | ||
| Liver | 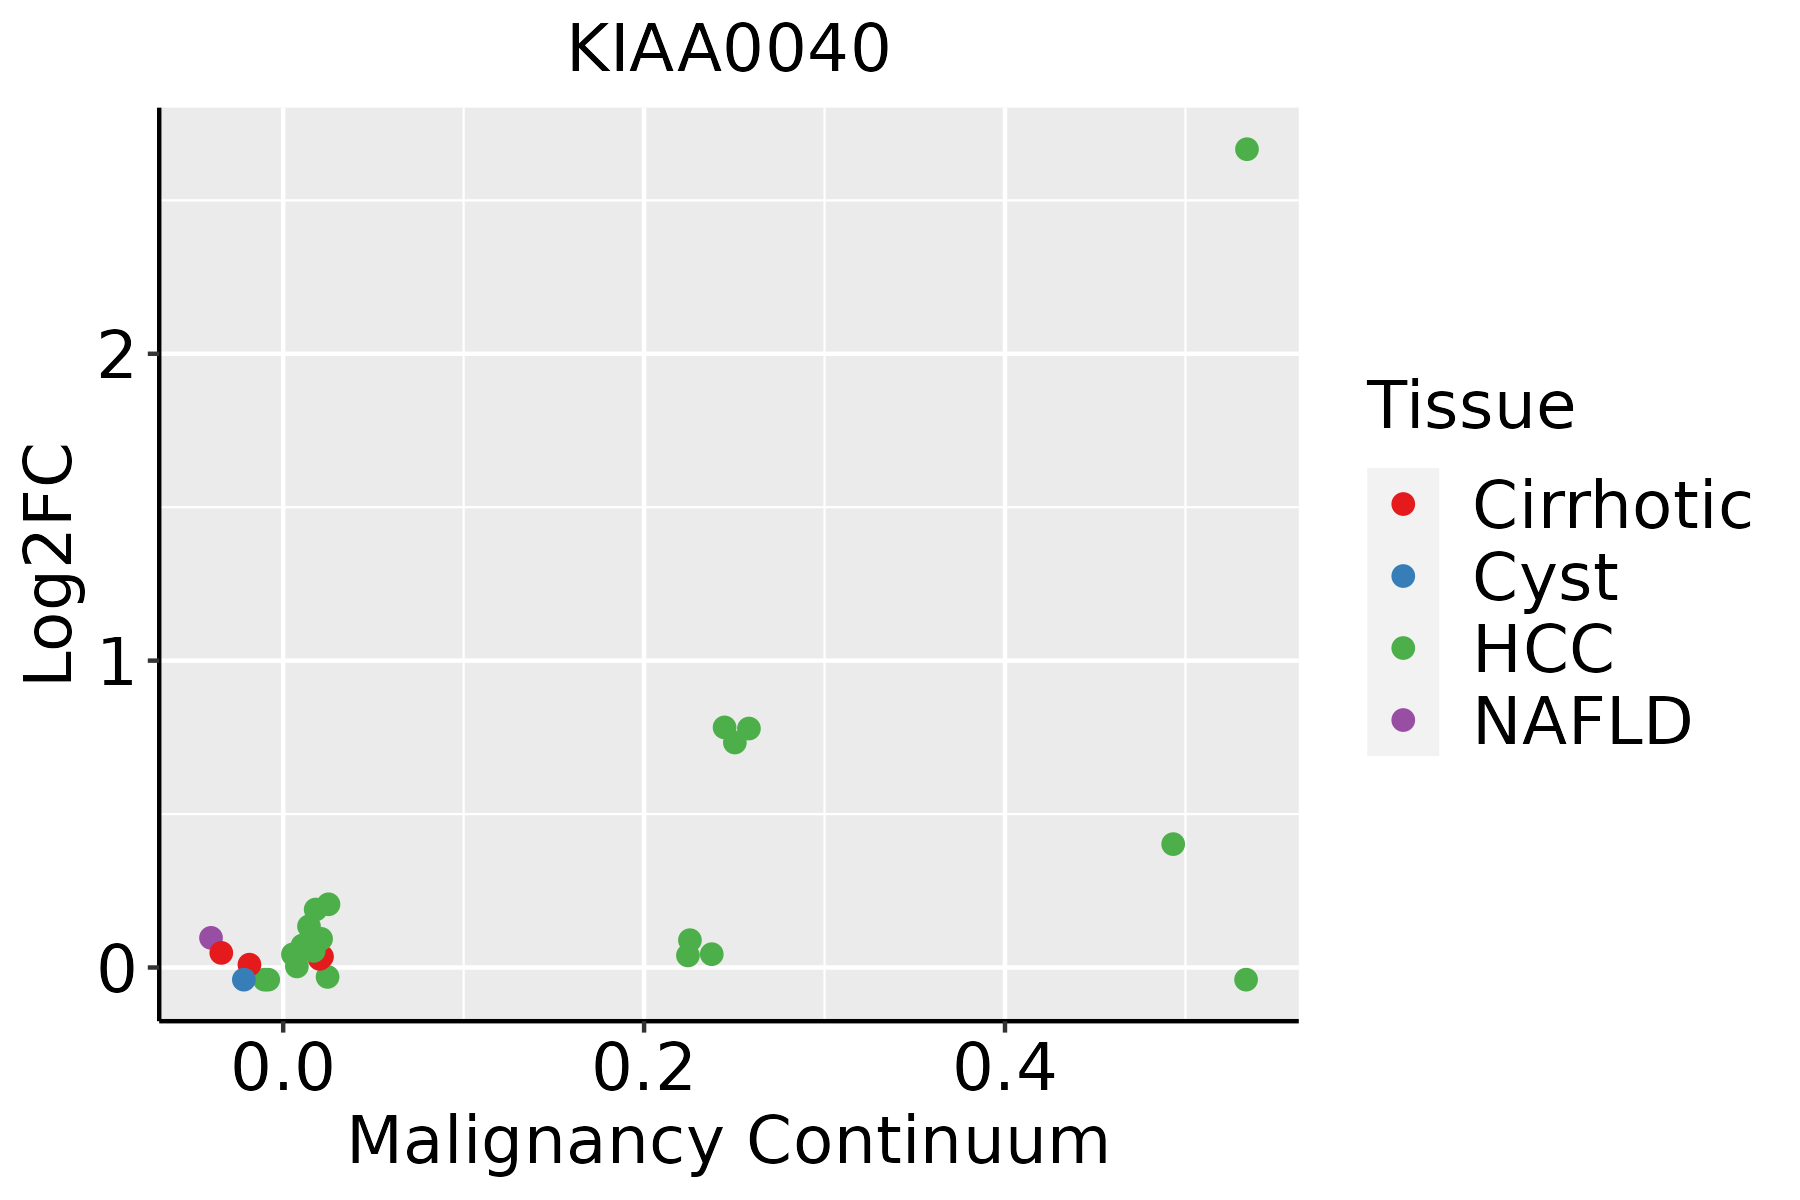 | HCC: Hepatocellular carcinoma |
| NAFLD: Non-alcoholic fatty liver disease | ||
| Oral Cavity | 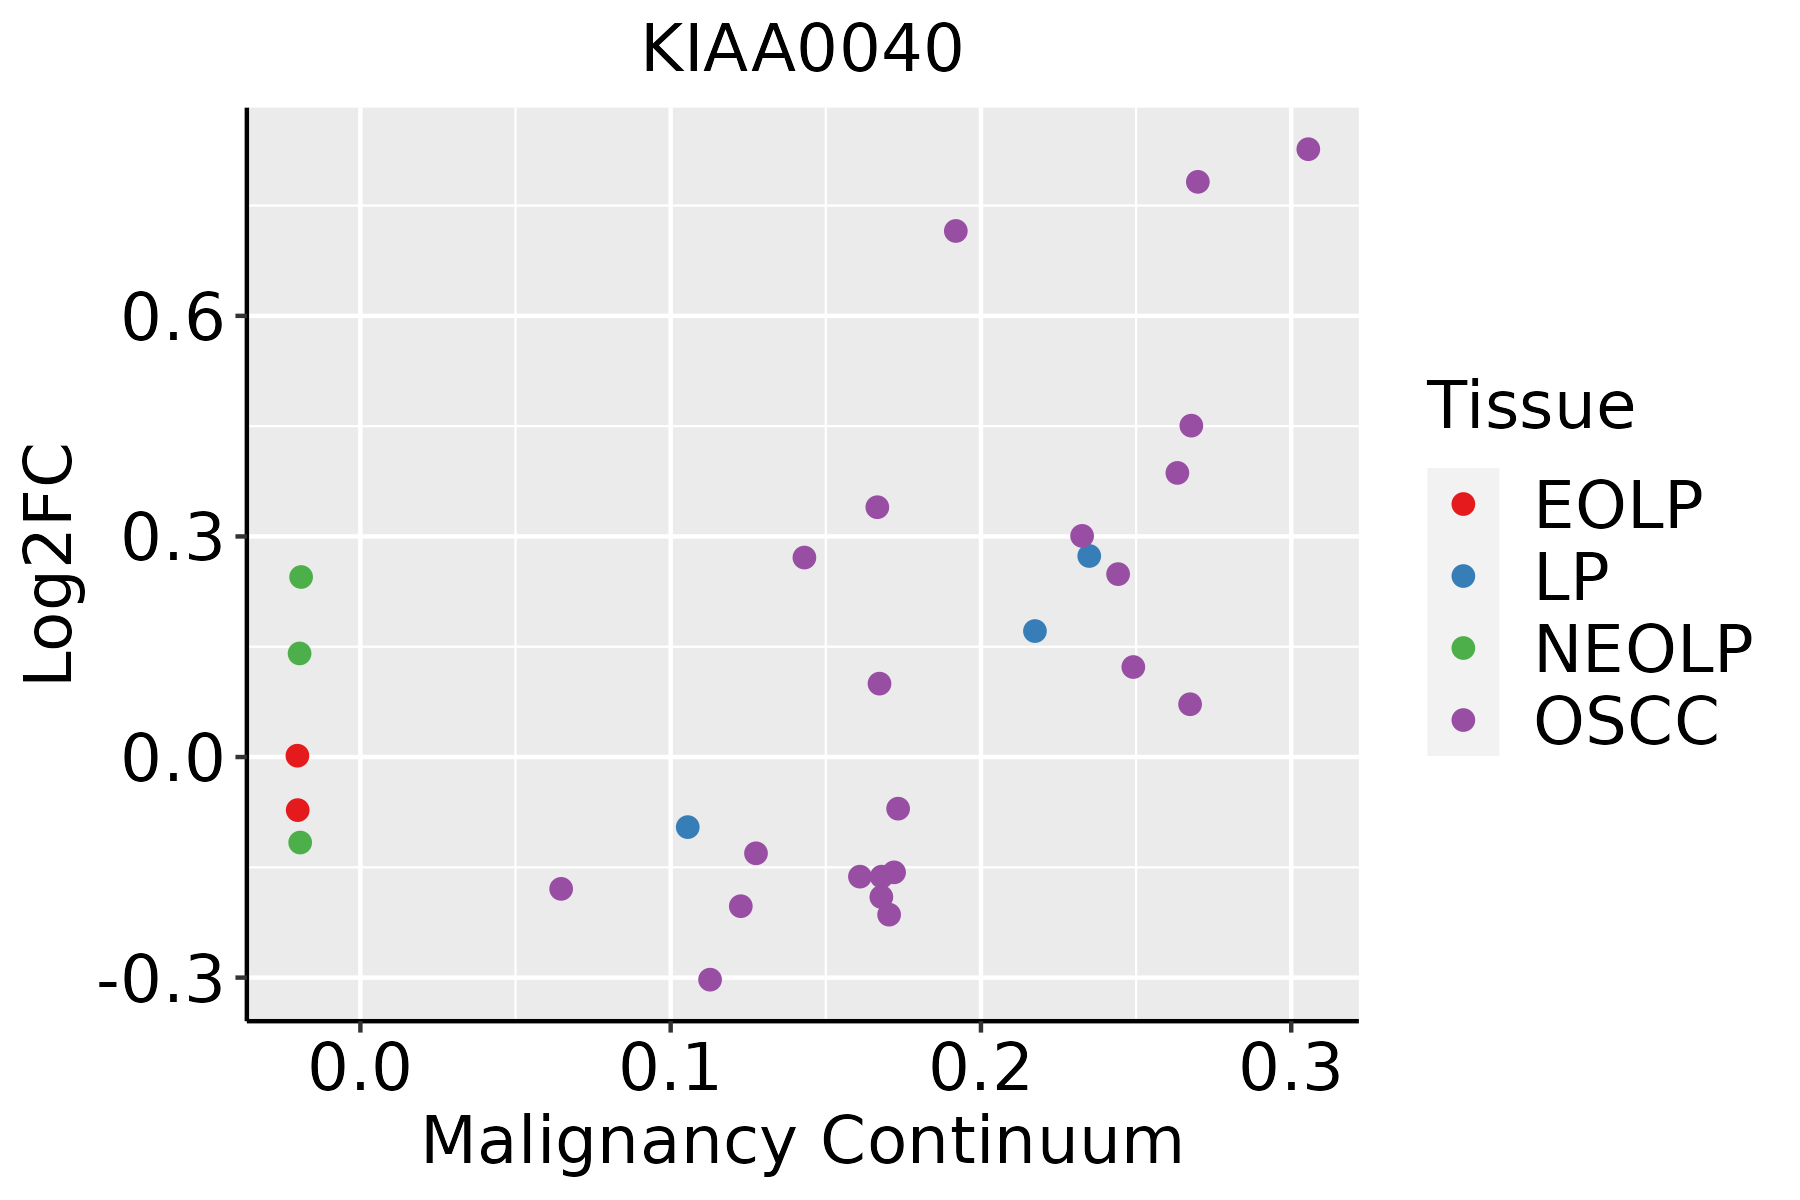 | EOLP: Erosive Oral lichen planus |
| LP: leukoplakia | ||
| NEOLP: Non-erosive oral lichen planus | ||
| OSCC: Oral squamous cell carcinoma | ||
| Prostate | 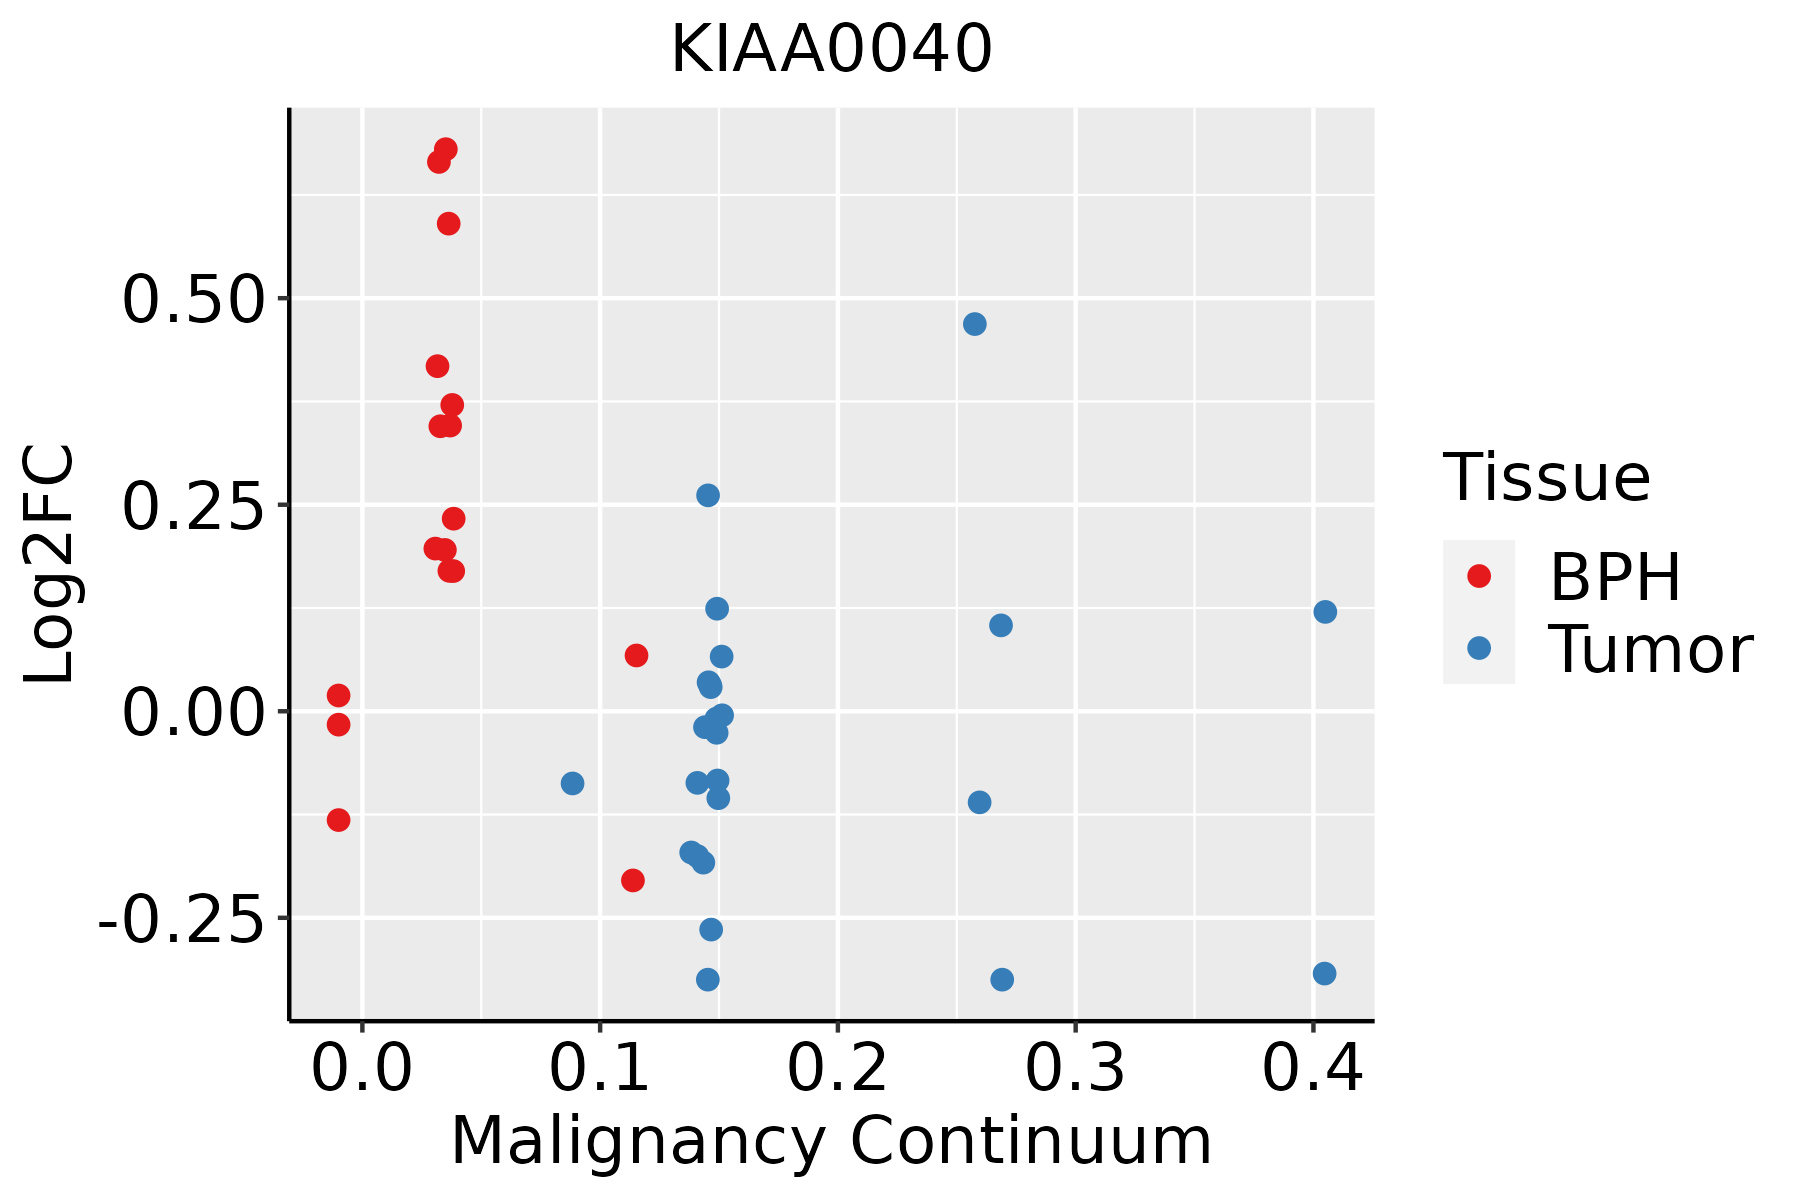 | BPH: Benign Prostatic Hyperplasia |
| ∗log2FC in expression of this searched gene in stem-like cells from each diseased tissue sample relative to stem-like cells in normal samples in each tissue plotted against the malignancy continuum. Samples are colored based on if they are from different disease stage. |
Top |
Malignant transformation related pathway analysis |
| Find out the enriched GO biological processes and KEGG pathways involved in transition from healthy to precancer to cancer |
| Tissue | Disease Stage | Enriched GO biological Processes |
| Colorectum | AD |  |
| Colorectum | SER |  |
| Colorectum | MSS |  |
| Colorectum | MSI-H |  |
| Colorectum | FAP |  |
| ∗Top 15 enriched GO BP terms are showed in the bar plot of each disease state in each tissue. Each row represents a significant GO biological process which is colored according to the -log10(p.adjust). |
| Page: 1 2 3 4 5 6 7 8 9 |
| GO ID | Tissue | Disease Stage | Description | Gene Ratio | Bg Ratio | pvalue | p.adjust | Count |
| Page: 1 |
| Pathway ID | Tissue | Disease Stage | Description | Gene Ratio | Bg Ratio | pvalue | p.adjust | qvalue | Count |
| Page: 1 |
Top |
Cell-cell communication analysis |
| Identification of potential cell-cell interactions between two cell types and their ligand-receptor pairs for different disease states |
| Ligand | Receptor | LRpair | Pathway | Tissue | Disease Stage |
| Page: 1 |
Top |
Single-cell gene regulatory network inference analysis |
| Find out the significant the regulons (TFs) and the target genes of each regulon across cell types for different disease states |
| TF | Cell Type | Tissue | Disease Stage | Target Gene | RSS | Regulon Activity |
| ∗The dot plots of a searched regulon are shown for all cell subpopulations in each disease state of each tissue based on the regulon specific score inferred using pySCENIC and by calculating the average expression. |
| Page: 1 |
Top |
Somatic mutation of malignant transformation related genes |
| Annotation of somatic variants for genes involved in malignant transformation |
| Hugo Symbol | Variant Class | Variant Classification | dbSNP RS | HGVSc | HGVSp | HGVSp Short | SWISSPROT | BIOTYPE | SIFT | PolyPhen | Tumor Sample Barcode | Tissue | Histology | Sex | Age | Stage | Therapy Types | Drugs | Outcome |
| KIAA0040 | SNV | Missense_Mutation | novel | c.21C>A | p.Phe7Leu | p.F7L | protein_coding | deleterious(0) | probably_damaging(0.997) | TCGA-AN-A046-01 | Breast | breast invasive carcinoma | Female | >=65 | I/II | Unknown | Unknown | SD | |
| KIAA0040 | SNV | Missense_Mutation | novel | c.154N>G | p.Trp52Gly | p.W52G | protein_coding | tolerated(0.12) | possibly_damaging(0.661) | TCGA-C8-A3M8-01 | Breast | breast invasive carcinoma | Female | >=65 | I/II | Hormone Therapy | tamoxiphen | CR | |
| KIAA0040 | deletion | Frame_Shift_Del | rs764422998 | c.204_205delNN | p.Lys69GlufsTer8 | p.K69Efs*8 | protein_coding | TCGA-C8-A8HQ-01 | Breast | breast invasive carcinoma | Female | <65 | I/II | Unknown | Unknown | SD | |||
| KIAA0040 | deletion | Frame_Shift_Del | rs767648441 | c.207delN | p.Lys70ArgfsTer32 | p.K70Rfs*32 | protein_coding | TCGA-DS-A7WF-01 | Cervix | cervical & endocervical cancer | Female | <65 | I/II | Chemotherapy | cisplatin | PD | |||
| KIAA0040 | deletion | Frame_Shift_Del | rs756639306 | c.195_205delNNNNNNNNNNN | p.Asn65LysfsTer9 | p.N65Kfs*9 | protein_coding | TCGA-DS-A7WF-01 | Cervix | cervical & endocervical cancer | Female | <65 | I/II | Chemotherapy | cisplatin | PD | |||
| KIAA0040 | insertion | In_Frame_Ins | novel | c.224_225insTAA | p.Lys74_Lys75insAsn | p.K74_K75insN | protein_coding | TCGA-MA-AA41-01 | Cervix | cervical & endocervical cancer | Female | <65 | I/II | Unknown | Unknown | SD | |||
| KIAA0040 | deletion | Frame_Shift_Del | rs767648441 | c.207delN | p.Lys70ArgfsTer32 | p.K70Rfs*32 | protein_coding | TCGA-ZJ-AAXI-01 | Cervix | cervical & endocervical cancer | Female | >=65 | I/II | Unknown | Unknown | SD | |||
| KIAA0040 | deletion | Frame_Shift_Del | rs767648441 | c.207delN | p.Lys70ArgfsTer32 | p.K70Rfs*32 | protein_coding | TCGA-A6-3810-01 | Colorectum | colon adenocarcinoma | Male | <65 | I/II | Unknown | Unknown | SD | |||
| KIAA0040 | deletion | Frame_Shift_Del | rs756639306 | c.195_205delNNNNNNNNNNN | p.Asn65LysfsTer9 | p.N65Kfs*9 | protein_coding | TCGA-A6-3810-01 | Colorectum | colon adenocarcinoma | Male | <65 | I/II | Unknown | Unknown | SD | |||
| KIAA0040 | insertion | In_Frame_Ins | novel | c.225_226insAAGAAG | p.Lys74_Lys75dup | p.K74_K75dup | protein_coding | TCGA-AA-3989-01 | Colorectum | colon adenocarcinoma | Male | >=65 | III/IV | Unknown | Unknown | PD |
| Page: 1 2 3 4 |
Top |
Related drugs of malignant transformation related genes |
| Identification of chemicals and drugs interact with genes involved in malignant transfromation |
| (DGIdb 4.0) |
| Entrez ID | Symbol | Category | Interaction Types | Drug Claim Name | Drug Name | PMIDs |
| Page: 1 |

Copyright 2023-Present -The University of Texas Health Science Center at Houston |