| Tissue | Expression Dynamics | Abbreviation |
| Colorectum (GSE201348) |  | FAP: Familial adenomatous polyposis |
| CRC: Colorectal cancer |
| Colorectum (HTA11) | 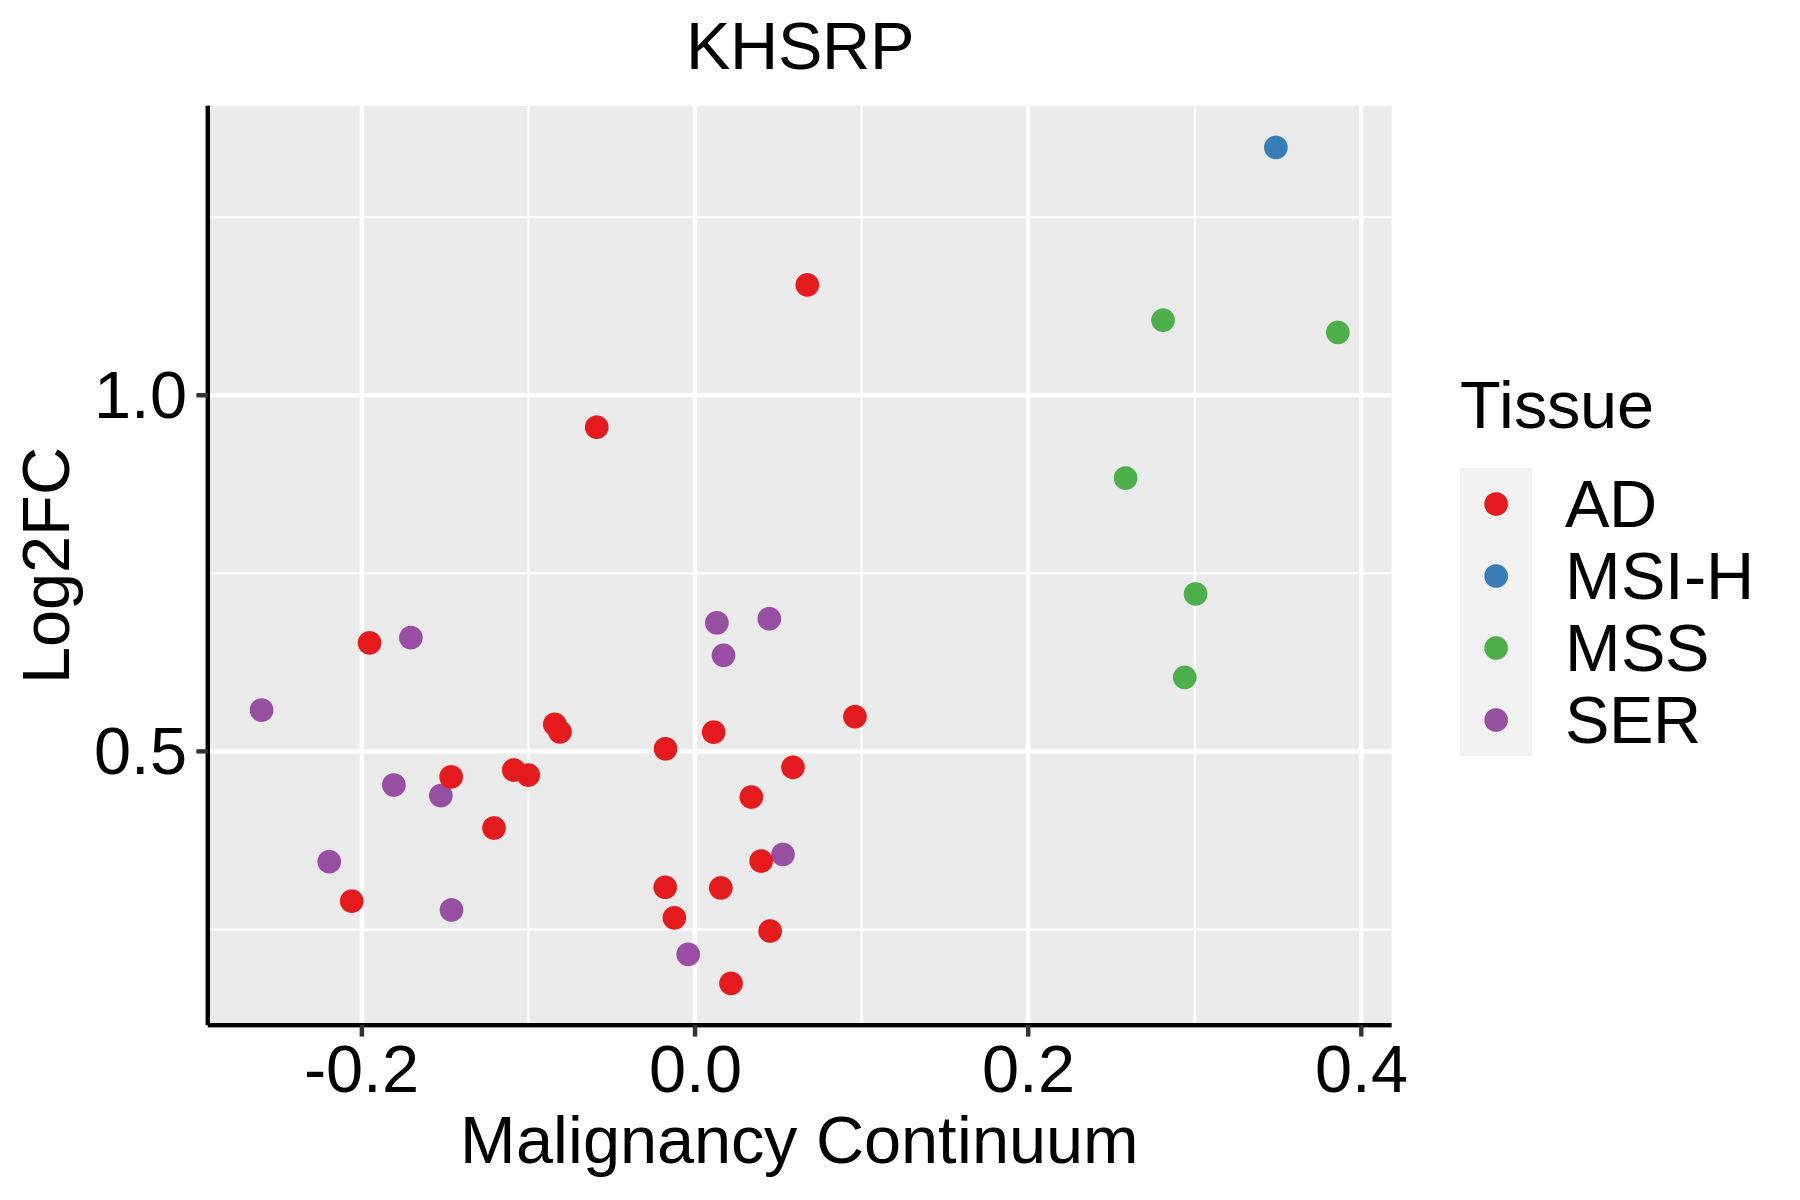 | AD: Adenomas |
| SER: Sessile serrated lesions |
| MSI-H: Microsatellite-high colorectal cancer |
| MSS: Microsatellite stable colorectal cancer |
| Endometrium | 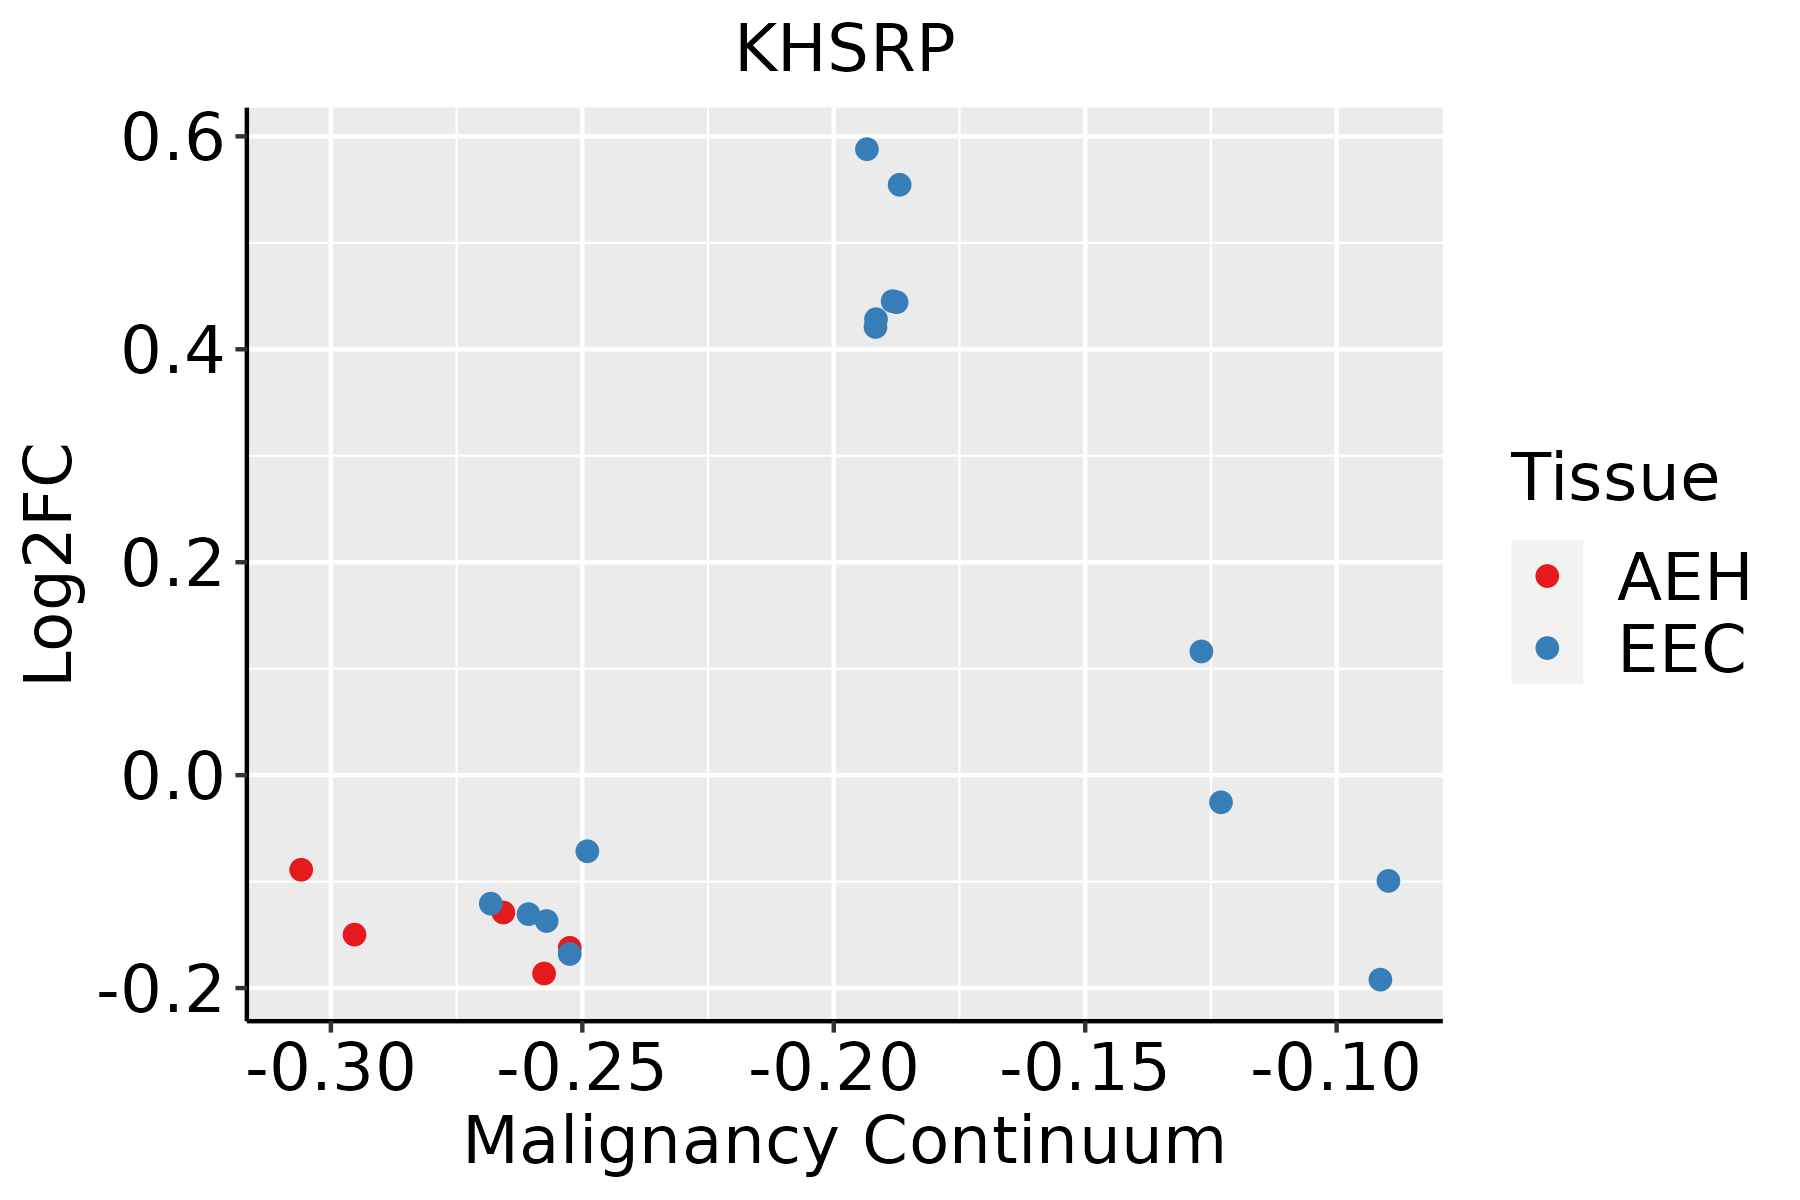 | AEH: Atypical endometrial hyperplasia |
| EEC: Endometrioid Cancer |
| Esophagus | 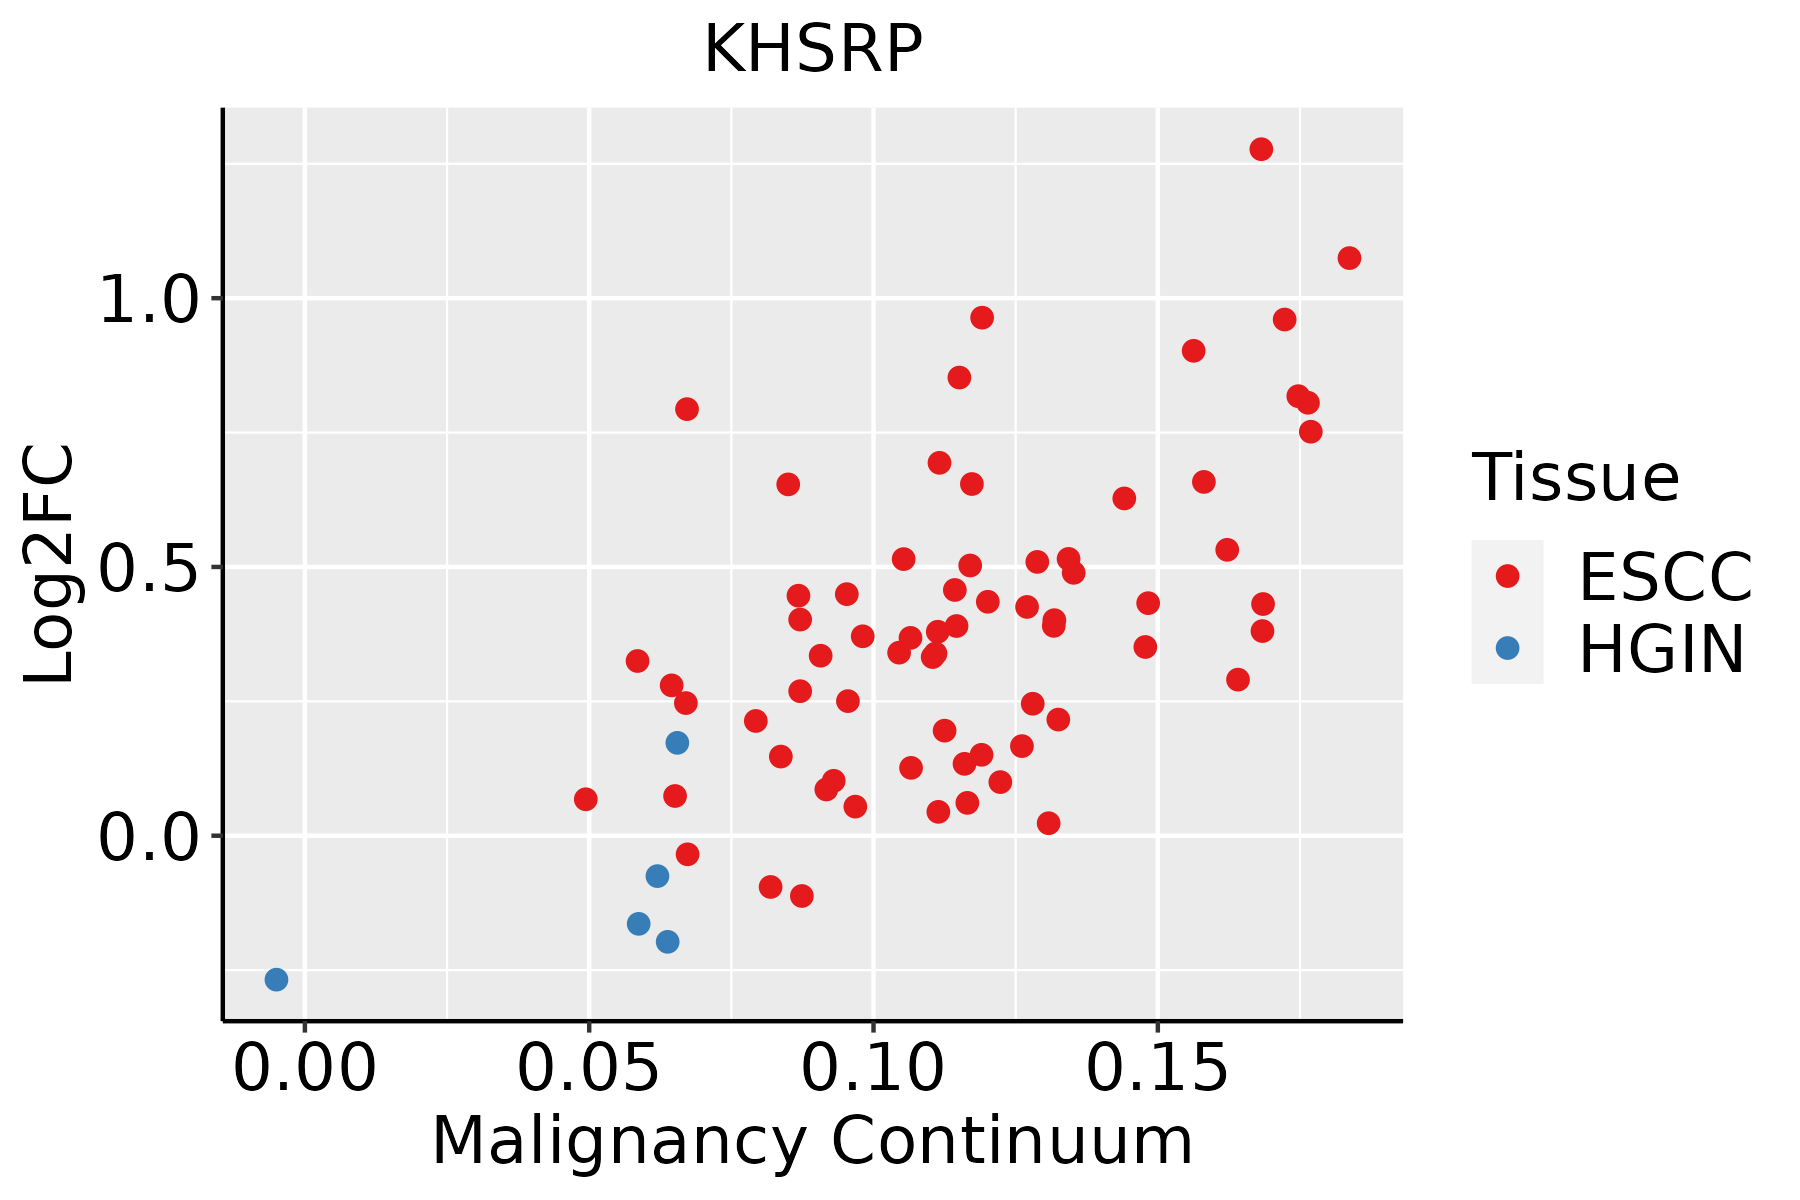 | ESCC: Esophageal squamous cell carcinoma |
| HGIN: High-grade intraepithelial neoplasias |
| LGIN: Low-grade intraepithelial neoplasias |
| Liver | 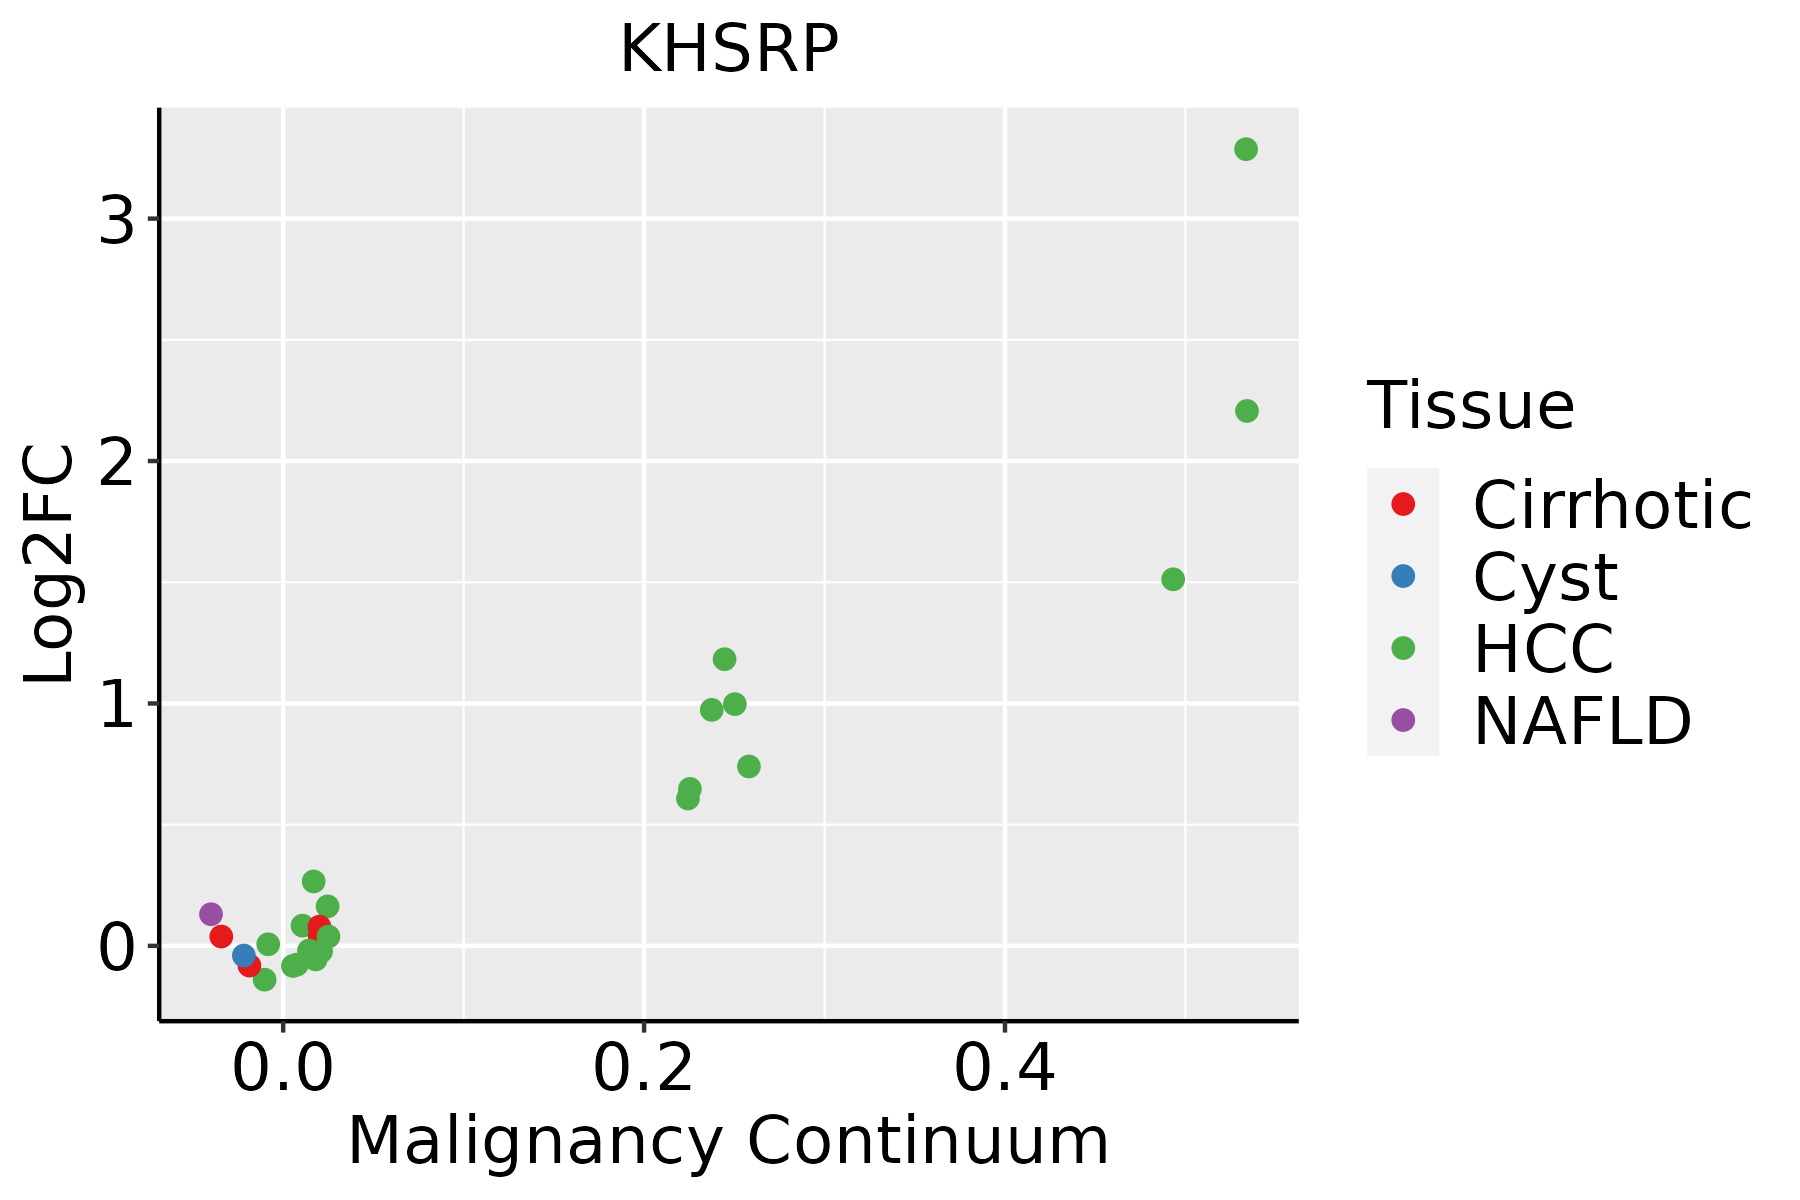 | HCC: Hepatocellular carcinoma |
| NAFLD: Non-alcoholic fatty liver disease |
| Oral Cavity | 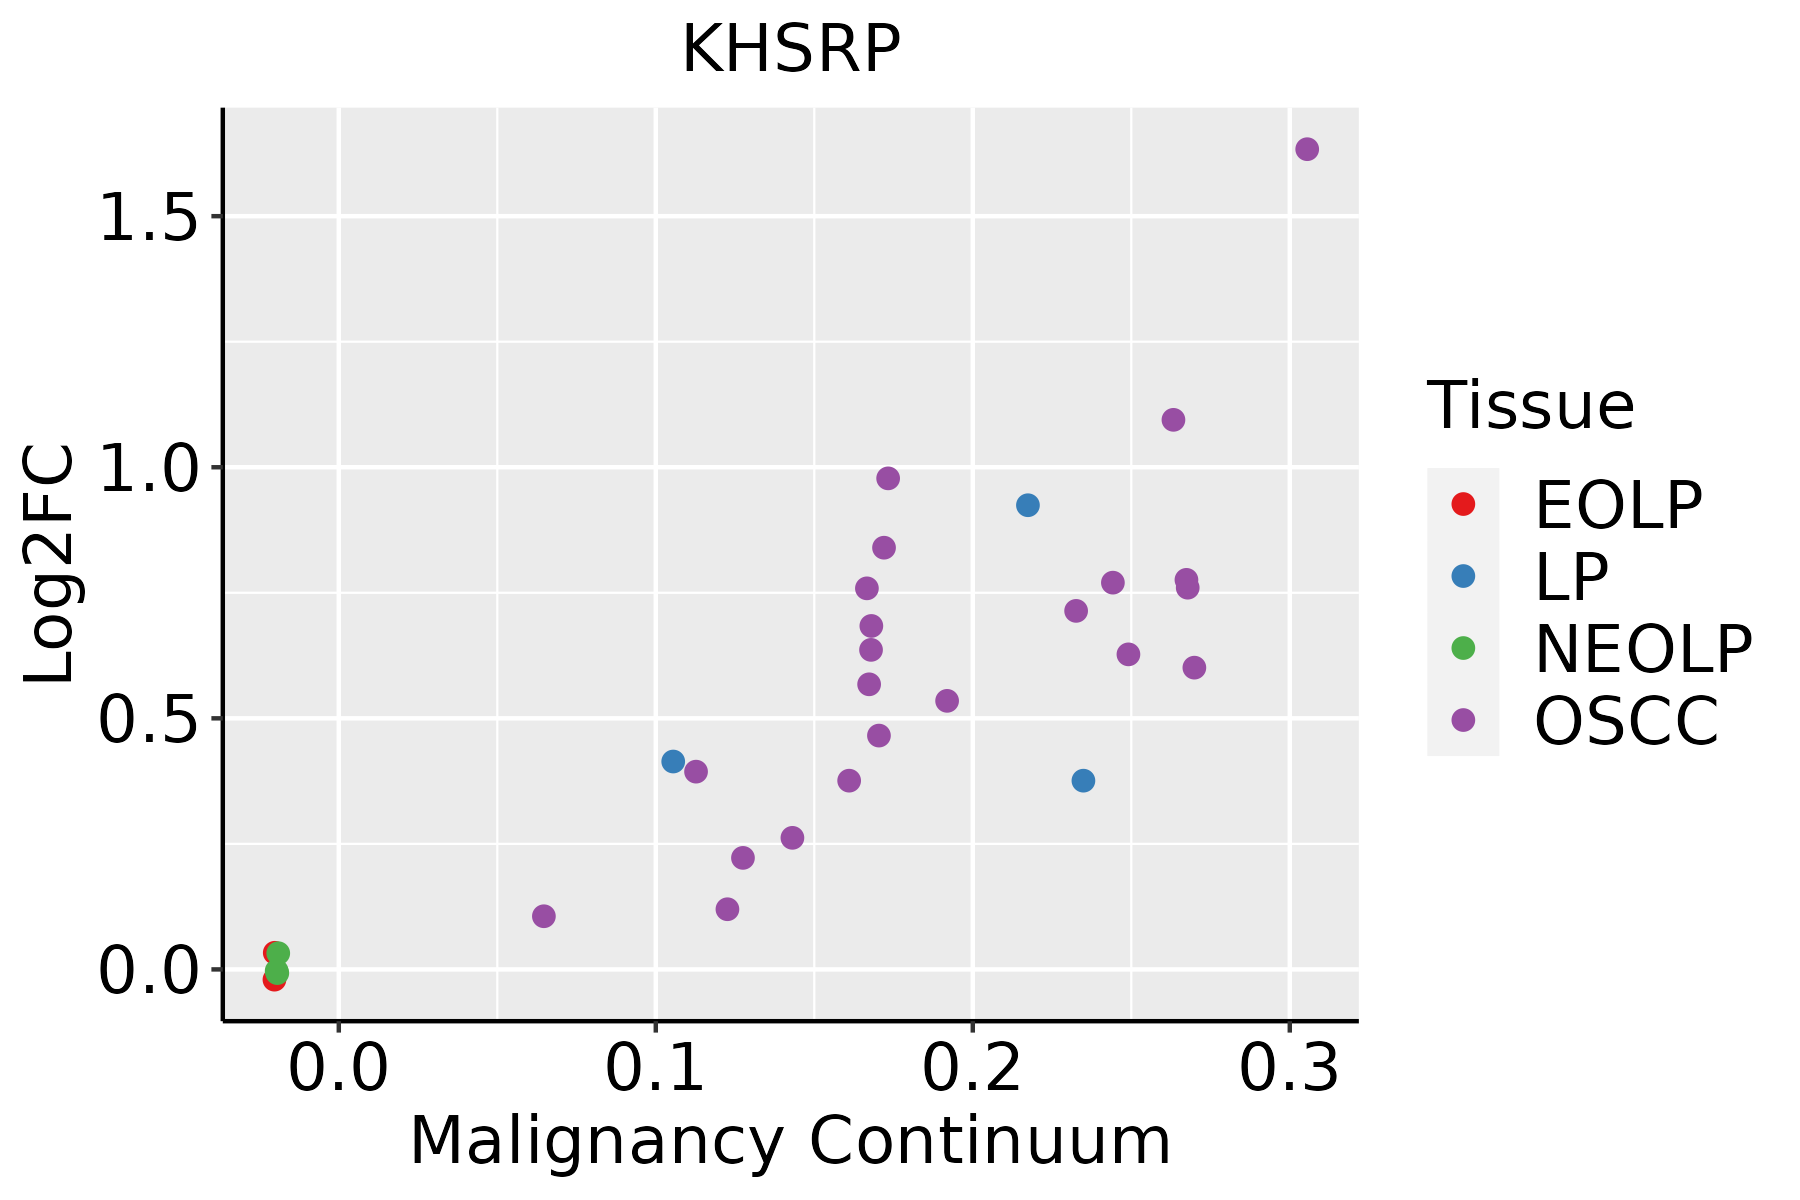 | EOLP: Erosive Oral lichen planus |
| LP: leukoplakia |
| NEOLP: Non-erosive oral lichen planus |
| OSCC: Oral squamous cell carcinoma |
| Skin | 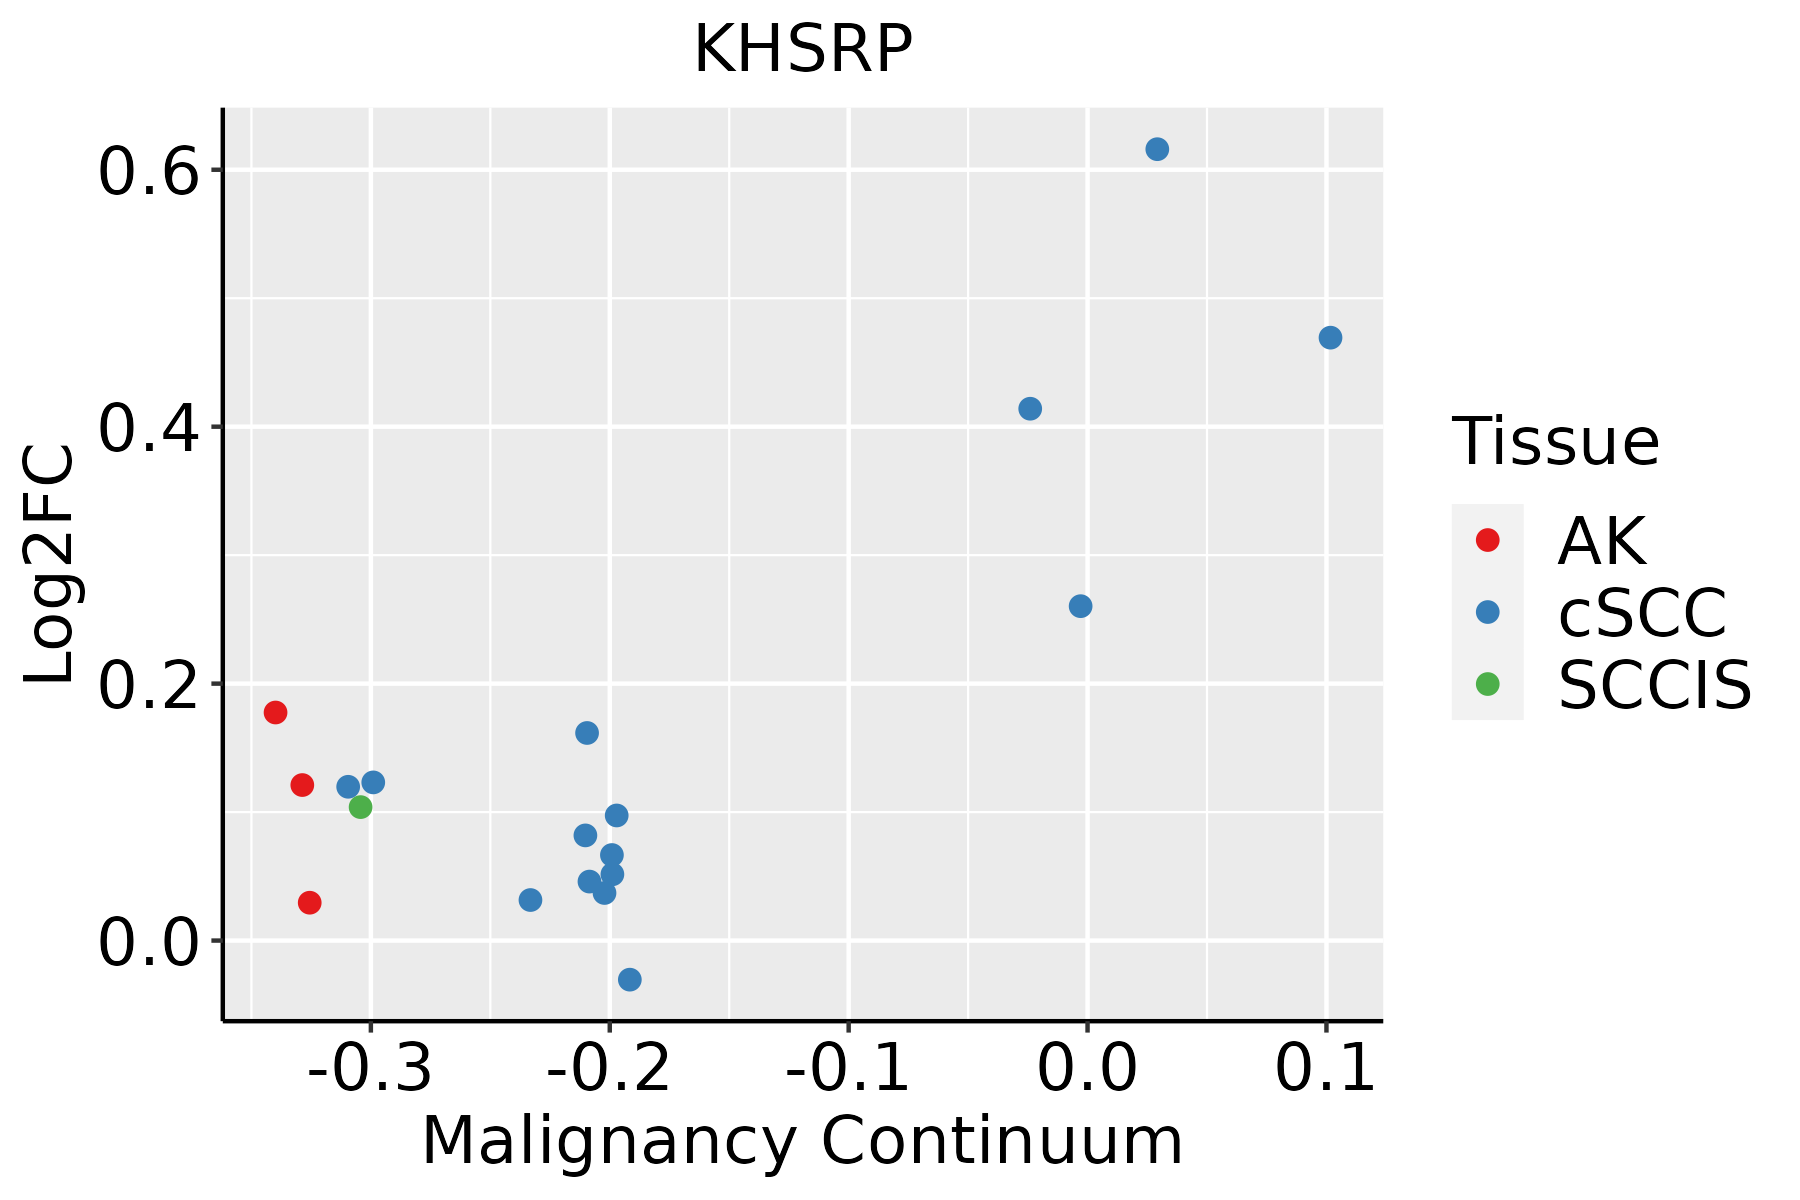 | AK: Actinic keratosis |
| cSCC: Cutaneous squamous cell carcinoma |
| SCCIS:squamous cell carcinoma in situ |
| Thyroid | 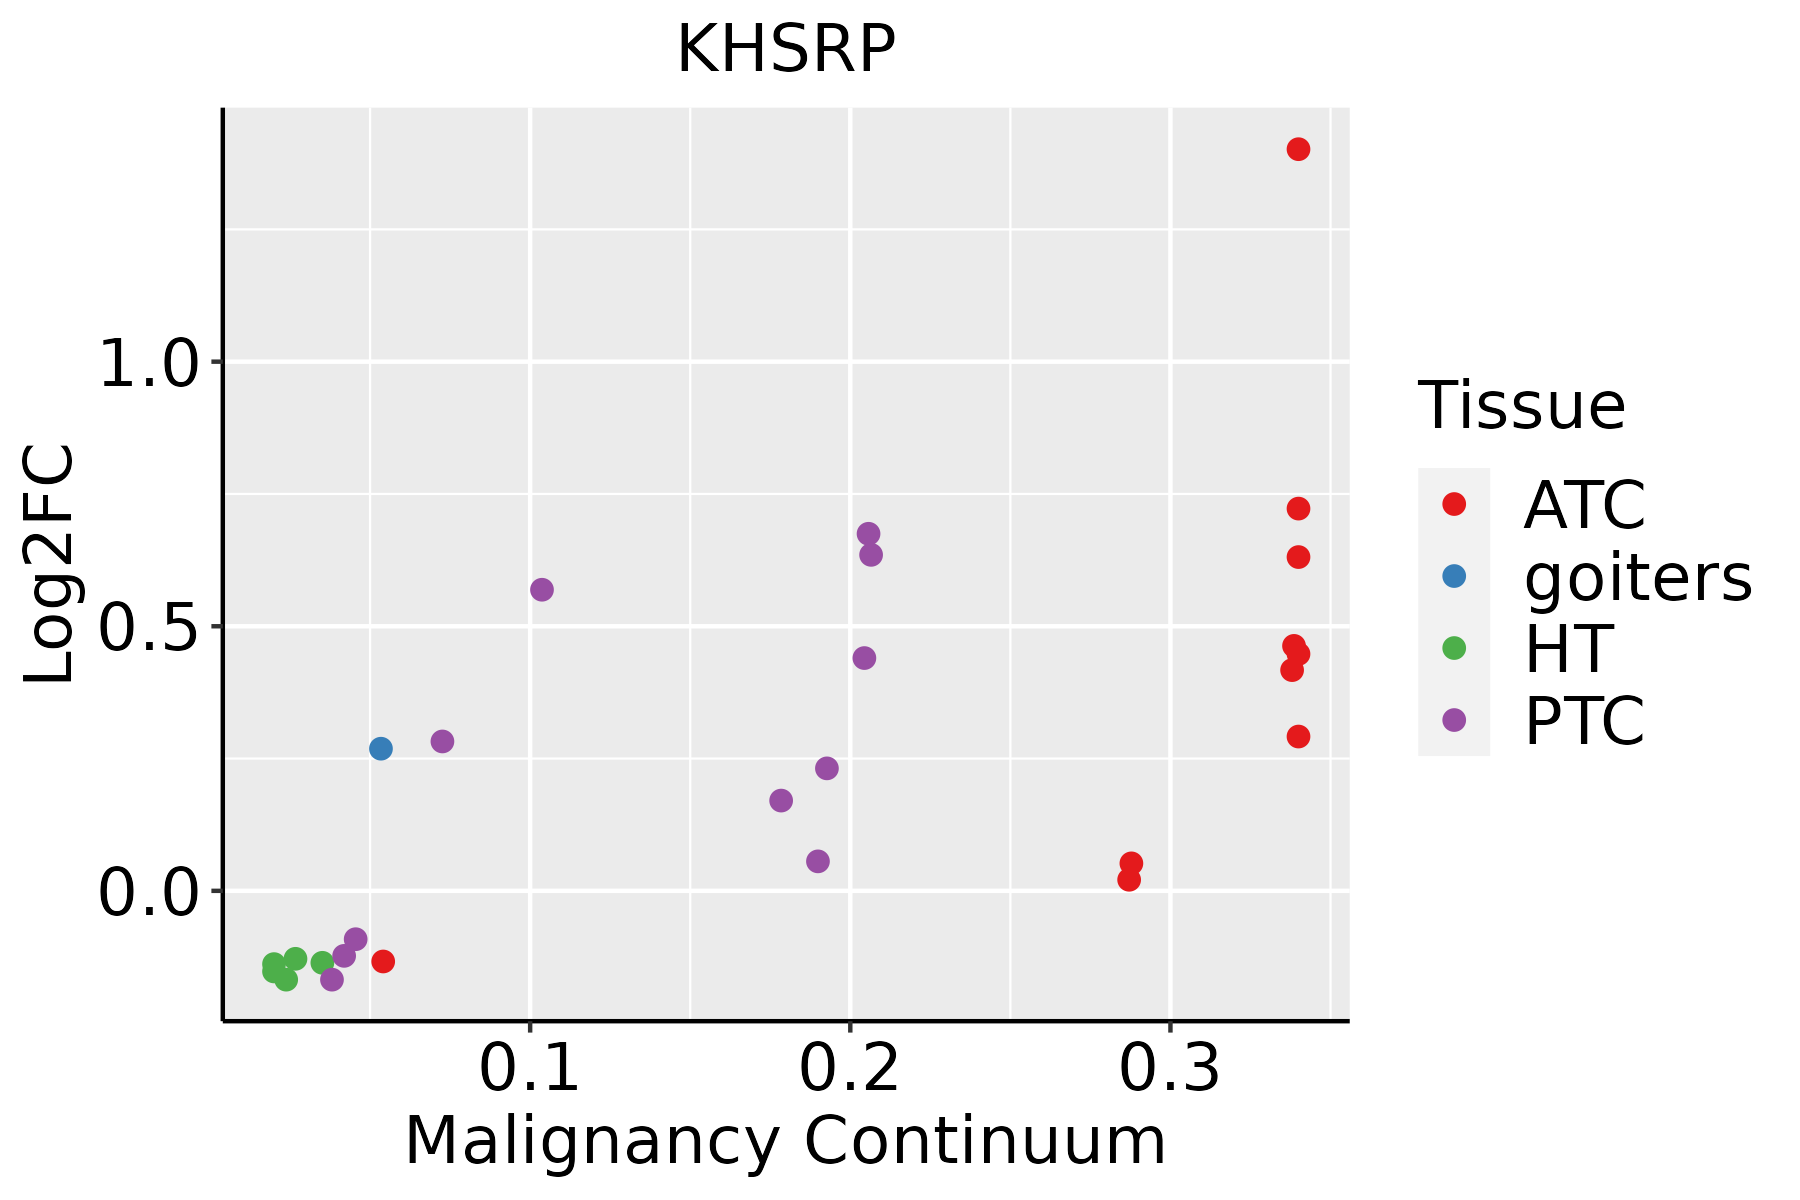 | ATC: Anaplastic thyroid cancer |
| HT: Hashimoto's thyroiditis |
| PTC: Papillary thyroid cancer |
| GO ID | Tissue | Disease Stage | Description | Gene Ratio | Bg Ratio | pvalue | p.adjust | Count |
| GO:0008380 | Colorectum | AD | RNA splicing | 169/3918 | 434/18723 | 3.59e-18 | 2.04e-15 | 169 |
| GO:0009896 | Colorectum | AD | positive regulation of catabolic process | 180/3918 | 492/18723 | 4.33e-16 | 1.94e-13 | 180 |
| GO:0000375 | Colorectum | AD | RNA splicing, via transesterification reactions | 131/3918 | 324/18723 | 7.11e-16 | 2.22e-13 | 131 |
| GO:1903311 | Colorectum | AD | regulation of mRNA metabolic process | 117/3918 | 288/18723 | 1.69e-14 | 4.23e-12 | 117 |
| GO:0031331 | Colorectum | AD | positive regulation of cellular catabolic process | 156/3918 | 427/18723 | 4.68e-14 | 1.05e-11 | 156 |
| GO:0006401 | Colorectum | AD | RNA catabolic process | 102/3918 | 278/18723 | 8.64e-10 | 6.76e-08 | 102 |
| GO:0044270 | Colorectum | AD | cellular nitrogen compound catabolic process | 147/3918 | 451/18723 | 3.35e-09 | 2.23e-07 | 147 |
| GO:0046700 | Colorectum | AD | heterocycle catabolic process | 145/3918 | 445/18723 | 4.37e-09 | 2.84e-07 | 145 |
| GO:0006402 | Colorectum | AD | mRNA catabolic process | 87/3918 | 232/18723 | 4.40e-09 | 2.84e-07 | 87 |
| GO:0034655 | Colorectum | AD | nucleobase-containing compound catabolic process | 133/3918 | 407/18723 | 1.56e-08 | 9.12e-07 | 133 |
| GO:0019439 | Colorectum | AD | aromatic compound catabolic process | 146/3918 | 467/18723 | 7.48e-08 | 3.84e-06 | 146 |
| GO:1901361 | Colorectum | AD | organic cyclic compound catabolic process | 153/3918 | 495/18723 | 8.23e-08 | 4.18e-06 | 153 |
| GO:0061013 | Colorectum | AD | regulation of mRNA catabolic process | 64/3918 | 166/18723 | 1.44e-07 | 6.59e-06 | 64 |
| GO:0043487 | Colorectum | AD | regulation of RNA stability | 63/3918 | 170/18723 | 9.17e-07 | 3.12e-05 | 63 |
| GO:0006417 | Colorectum | AD | regulation of translation | 141/3918 | 468/18723 | 1.32e-06 | 4.22e-05 | 141 |
| GO:0043488 | Colorectum | AD | regulation of mRNA stability | 59/3918 | 158/18723 | 1.50e-06 | 4.66e-05 | 59 |
| GO:0006403 | Colorectum | AD | RNA localization | 71/3918 | 201/18723 | 1.54e-06 | 4.76e-05 | 71 |
| GO:0051236 | Colorectum | AD | establishment of RNA localization | 58/3918 | 166/18723 | 1.95e-05 | 4.01e-04 | 58 |
| GO:0015931 | Colorectum | AD | nucleobase-containing compound transport | 73/3918 | 222/18723 | 2.02e-05 | 4.10e-04 | 73 |
| GO:0050657 | Colorectum | AD | nucleic acid transport | 57/3918 | 163/18723 | 2.22e-05 | 4.39e-04 | 57 |
| Hugo Symbol | Variant Class | Variant Classification | dbSNP RS | HGVSc | HGVSp | HGVSp Short | SWISSPROT | BIOTYPE | SIFT | PolyPhen | Tumor Sample Barcode | Tissue | Histology | Sex | Age | Stage | Therapy Types | Drugs | Outcome |
| KHSRP | SNV | Missense_Mutation | | c.315T>G | p.Phe105Leu | p.F105L | Q92945 | protein_coding | tolerated(0.07) | benign(0.015) | TCGA-AO-A128-01 | Breast | breast invasive carcinoma | Female | <65 | I/II | Chemotherapy | doxorubicin | SD |
| KHSRP | SNV | Missense_Mutation | | c.1496N>C | p.Leu499Pro | p.L499P | Q92945 | protein_coding | deleterious(0.04) | possibly_damaging(0.897) | TCGA-B6-A0X5-01 | Breast | breast invasive carcinoma | Female | <65 | I/II | Unknown | Unknown | PD |
| KHSRP | SNV | Missense_Mutation | novel | c.646N>T | p.Arg216Cys | p.R216C | Q92945 | protein_coding | deleterious(0) | possibly_damaging(0.836) | TCGA-D8-A1JM-01 | Breast | breast invasive carcinoma | Female | <65 | I/II | ChemotherapyHormone Therapy | doxorubicine | SD |
| KHSRP | SNV | Missense_Mutation | novel | c.1447N>A | p.Gln483Lys | p.Q483K | Q92945 | protein_coding | deleterious(0.04) | probably_damaging(0.999) | TCGA-D8-A27G-01 | Breast | breast invasive carcinoma | Female | >=65 | I/II | Unknown | Unknown | SD |
| KHSRP | insertion | Frame_Shift_Ins | novel | c.1608_1609insG | p.Pro537AlafsTer25 | p.P537Afs*25 | Q92945 | protein_coding | | | TCGA-BH-A18G-01 | Breast | breast invasive carcinoma | Female | >=65 | I/II | Unknown | Unknown | SD |
| KHSRP | SNV | Missense_Mutation | | c.1047N>C | p.Gln349His | p.Q349H | Q92945 | protein_coding | deleterious(0) | probably_damaging(0.999) | TCGA-C5-A1BQ-01 | Cervix | cervical & endocervical cancer | Female | >=65 | III/IV | Chemotherapy | cisplatin | CR |
| KHSRP | SNV | Missense_Mutation | novel | c.956C>G | p.Ser319Cys | p.S319C | Q92945 | protein_coding | deleterious(0) | probably_damaging(0.991) | TCGA-EK-A3GK-01 | Cervix | cervical & endocervical cancer | Female | <65 | I/II | Unknown | Unknown | SD |
| KHSRP | SNV | Missense_Mutation | | c.1051N>C | p.Asp351His | p.D351H | Q92945 | protein_coding | deleterious(0) | probably_damaging(0.955) | TCGA-JX-A3Q0-01 | Cervix | cervical & endocervical cancer | Female | <65 | III/IV | Unknown | Unknown | SD |
| KHSRP | SNV | Missense_Mutation | novel | c.527N>T | p.Cys176Phe | p.C176F | Q92945 | protein_coding | deleterious(0) | probably_damaging(0.997) | TCGA-VS-A8EI-01 | Cervix | cervical & endocervical cancer | Female | <65 | I/II | Chemotherapy | cisplatin | CR |
| KHSRP | SNV | Missense_Mutation | | c.2027N>T | p.Ala676Val | p.A676V | Q92945 | protein_coding | tolerated(0.09) | probably_damaging(0.994) | TCGA-AA-3510-01 | Colorectum | colon adenocarcinoma | Male | >=65 | I/II | Unknown | Unknown | SD |


