
|
|||||
|
 | |
| |
| |
| |
| |
| |
|
Gene: KHNYN |
Gene summary for KHNYN |
| Gene information | Species | Human | Gene symbol | KHNYN | Gene ID | 23351 |
| Gene name | KH and NYN domain containing | |
| Gene Alias | KIAA0323 | |
| Cytomap | 14q12 | |
| Gene Type | protein-coding | GO ID | GO:0006139 | UniProtAcc | O15037 |
Top |
Malignant transformation analysis |
| Identification of the aberrant gene expression in precancerous and cancerous lesions by comparing the gene expression of stem-like cells in diseased tissues with normal stem cells |
| Entrez ID | Symbol | Replicates | Species | Organ | Tissue | Adj P-value | Log2FC | Malignancy |
| 23351 | KHNYN | LZE8T | Human | Esophagus | ESCC | 4.68e-04 | 1.08e-01 | 0.067 |
| 23351 | KHNYN | LZE24T | Human | Esophagus | ESCC | 5.40e-11 | 2.33e-01 | 0.0596 |
| 23351 | KHNYN | P2T-E | Human | Esophagus | ESCC | 1.03e-11 | 1.88e-01 | 0.1177 |
| 23351 | KHNYN | P5T-E | Human | Esophagus | ESCC | 6.82e-07 | 3.48e-02 | 0.1327 |
| 23351 | KHNYN | P8T-E | Human | Esophagus | ESCC | 1.34e-15 | 2.43e-01 | 0.0889 |
| 23351 | KHNYN | P9T-E | Human | Esophagus | ESCC | 4.77e-04 | 7.67e-02 | 0.1131 |
| 23351 | KHNYN | P10T-E | Human | Esophagus | ESCC | 9.17e-12 | 2.06e-01 | 0.116 |
| 23351 | KHNYN | P11T-E | Human | Esophagus | ESCC | 6.06e-05 | 1.49e-01 | 0.1426 |
| 23351 | KHNYN | P12T-E | Human | Esophagus | ESCC | 5.04e-17 | 2.63e-01 | 0.1122 |
| 23351 | KHNYN | P15T-E | Human | Esophagus | ESCC | 1.86e-20 | 3.37e-01 | 0.1149 |
| 23351 | KHNYN | P16T-E | Human | Esophagus | ESCC | 1.07e-02 | 2.68e-02 | 0.1153 |
| 23351 | KHNYN | P17T-E | Human | Esophagus | ESCC | 7.45e-05 | 2.10e-01 | 0.1278 |
| 23351 | KHNYN | P20T-E | Human | Esophagus | ESCC | 1.22e-03 | 4.92e-02 | 0.1124 |
| 23351 | KHNYN | P21T-E | Human | Esophagus | ESCC | 1.03e-05 | 1.32e-01 | 0.1617 |
| 23351 | KHNYN | P22T-E | Human | Esophagus | ESCC | 2.03e-11 | 1.15e-01 | 0.1236 |
| 23351 | KHNYN | P23T-E | Human | Esophagus | ESCC | 6.11e-07 | 1.19e-01 | 0.108 |
| 23351 | KHNYN | P26T-E | Human | Esophagus | ESCC | 4.85e-07 | 8.73e-02 | 0.1276 |
| 23351 | KHNYN | P27T-E | Human | Esophagus | ESCC | 4.60e-10 | 1.30e-01 | 0.1055 |
| 23351 | KHNYN | P28T-E | Human | Esophagus | ESCC | 2.20e-14 | 3.32e-01 | 0.1149 |
| 23351 | KHNYN | P30T-E | Human | Esophagus | ESCC | 1.47e-07 | 2.85e-01 | 0.137 |
| Page: 1 2 3 |
| Tissue | Expression Dynamics | Abbreviation |
| Esophagus | 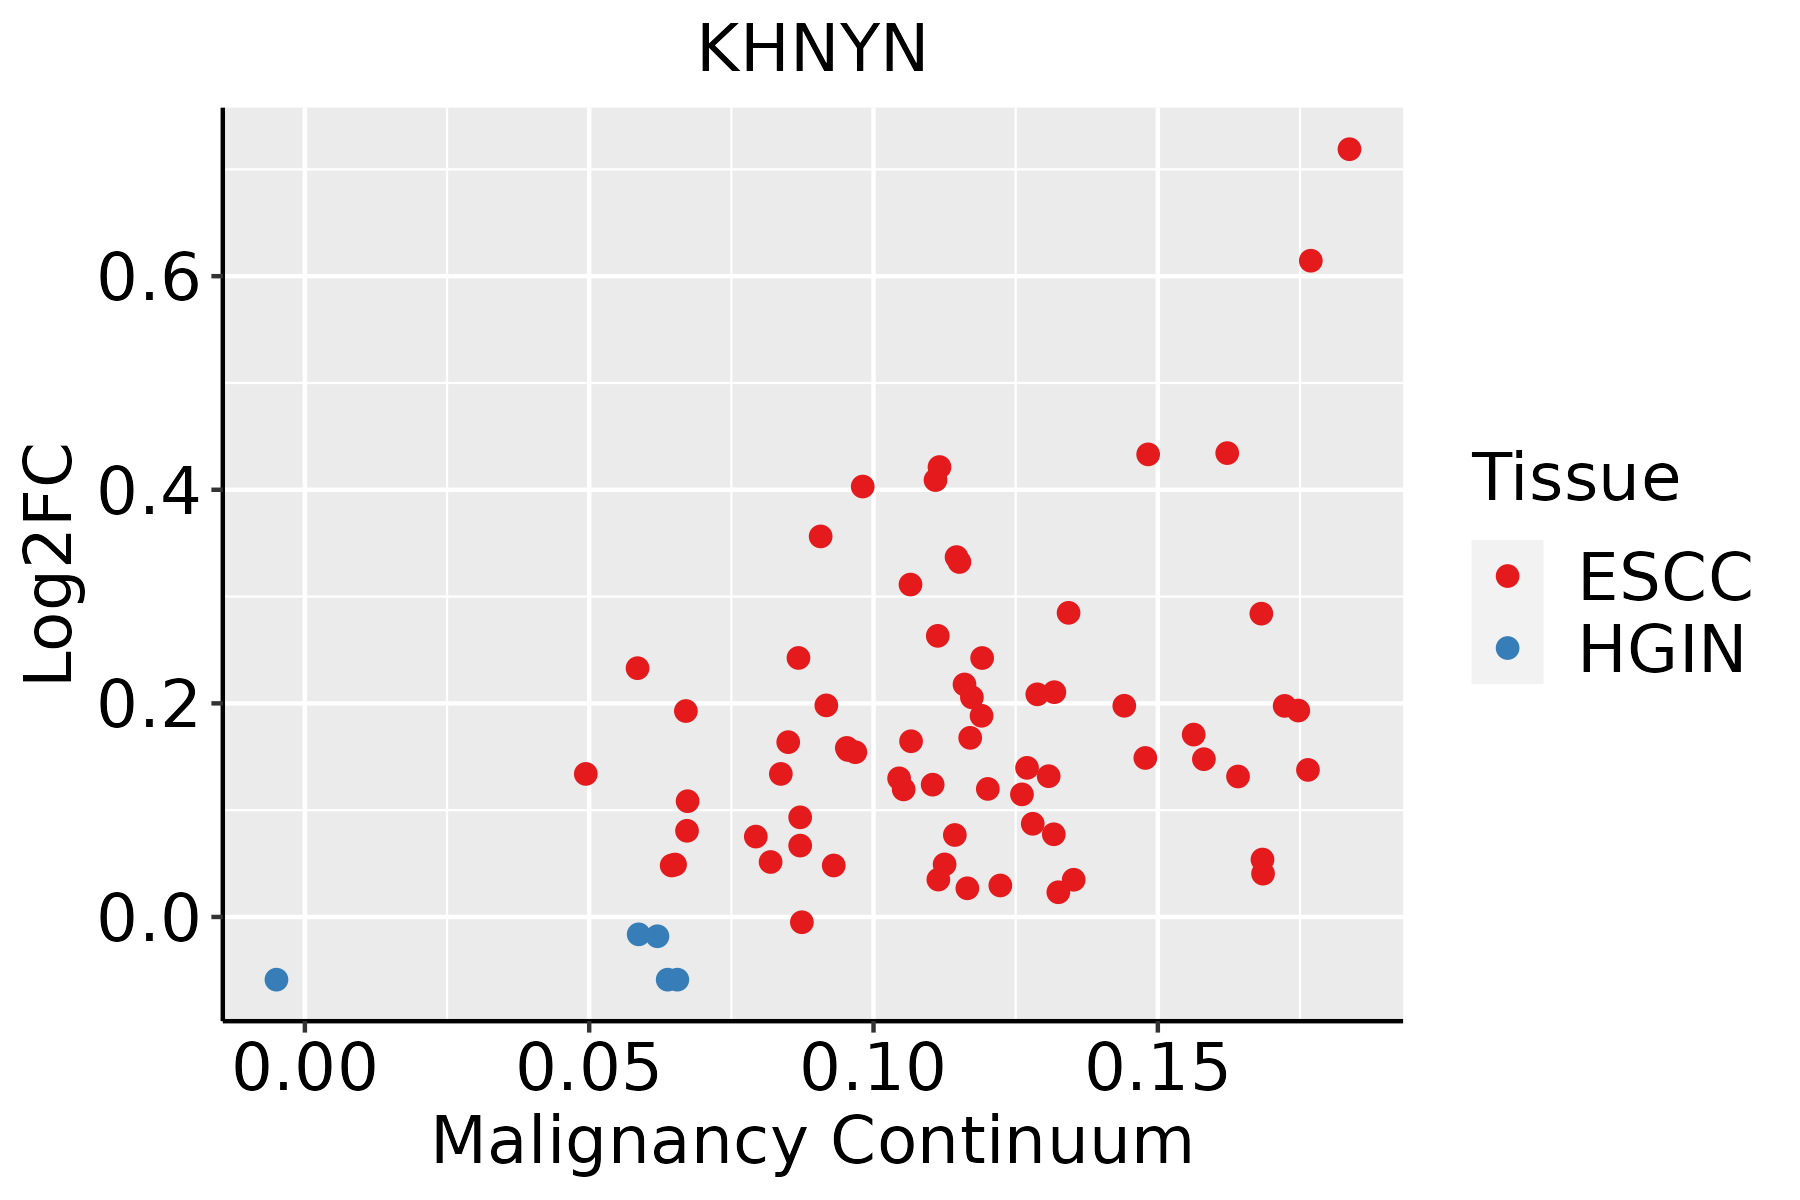 | ESCC: Esophageal squamous cell carcinoma |
| HGIN: High-grade intraepithelial neoplasias | ||
| LGIN: Low-grade intraepithelial neoplasias |
| ∗log2FC in expression of this searched gene in stem-like cells from each diseased tissue sample relative to stem-like cells in normal samples in each tissue plotted against the malignancy continuum. Samples are colored based on if they are from different disease stage. |
Top |
Malignant transformation related pathway analysis |
| Find out the enriched GO biological processes and KEGG pathways involved in transition from healthy to precancer to cancer |
| Tissue | Disease Stage | Enriched GO biological Processes |
| Colorectum | AD |  |
| Colorectum | SER |  |
| Colorectum | MSS |  |
| Colorectum | MSI-H |  |
| Colorectum | FAP |  |
| ∗Top 15 enriched GO BP terms are showed in the bar plot of each disease state in each tissue. Each row represents a significant GO biological process which is colored according to the -log10(p.adjust). |
| Page: 1 2 3 4 5 6 7 8 9 |
| GO ID | Tissue | Disease Stage | Description | Gene Ratio | Bg Ratio | pvalue | p.adjust | Count |
| GO:00905013 | Esophagus | ESCC | RNA phosphodiester bond hydrolysis | 110/8552 | 152/18723 | 1.95e-11 | 6.81e-10 | 110 |
| GO:00903053 | Esophagus | ESCC | nucleic acid phosphodiester bond hydrolysis | 163/8552 | 261/18723 | 3.07e-08 | 5.73e-07 | 163 |
| GO:00905023 | Esophagus | ESCC | RNA phosphodiester bond hydrolysis, endonucleolytic | 55/8552 | 82/18723 | 7.34e-05 | 5.51e-04 | 55 |
| Page: 1 |
| Pathway ID | Tissue | Disease Stage | Description | Gene Ratio | Bg Ratio | pvalue | p.adjust | qvalue | Count |
| Page: 1 |
Top |
Cell-cell communication analysis |
| Identification of potential cell-cell interactions between two cell types and their ligand-receptor pairs for different disease states |
| Ligand | Receptor | LRpair | Pathway | Tissue | Disease Stage |
| Page: 1 |
Top |
Single-cell gene regulatory network inference analysis |
| Find out the significant the regulons (TFs) and the target genes of each regulon across cell types for different disease states |
| TF | Cell Type | Tissue | Disease Stage | Target Gene | RSS | Regulon Activity |
| ∗The dot plots of a searched regulon are shown for all cell subpopulations in each disease state of each tissue based on the regulon specific score inferred using pySCENIC and by calculating the average expression. |
| Page: 1 |
Top |
Somatic mutation of malignant transformation related genes |
| Annotation of somatic variants for genes involved in malignant transformation |
| Hugo Symbol | Variant Class | Variant Classification | dbSNP RS | HGVSc | HGVSp | HGVSp Short | SWISSPROT | BIOTYPE | SIFT | PolyPhen | Tumor Sample Barcode | Tissue | Histology | Sex | Age | Stage | Therapy Types | Drugs | Outcome |
| KHNYN | SNV | Missense_Mutation | c.368N>T | p.Gly123Val | p.G123V | O15037 | protein_coding | deleterious(0) | probably_damaging(0.997) | TCGA-AR-A1AN-01 | Breast | breast invasive carcinoma | Female | <65 | I/II | Chemotherapy | cytoxan | SD | |
| KHNYN | insertion | Nonsense_Mutation | novel | c.482_483insCCCCATGTGGAGCGCATCTTCAGCGTGGGGGTGAGCGTCCTTCCGAAG | p.Leu161_Arg162insProMetTrpSerAlaSerSerAlaTrpGlyTerAlaSerPheArgArg | p.L161_R162insPMWSASSAWG*ASFRR | O15037 | protein_coding | TCGA-A8-A0A4-01 | Breast | breast invasive carcinoma | Female | >=65 | I/II | Hormone Therapy | tamoxiphen | CR | ||
| KHNYN | insertion | Nonsense_Mutation | novel | c.1620_1621insTCAGTGGTGAAGTCTAGGCTTTTAATGTAACCATGA | p.Ser541_Asn542insValValLysSerArgLeuLeuMetTerProTerSer | p.S541_N542insVVKSRLLM*P*S | O15037 | protein_coding | TCGA-AN-A041-01 | Breast | breast invasive carcinoma | Female | <65 | I/II | Unknown | Unknown | SD | ||
| KHNYN | deletion | Frame_Shift_Del | novel | c.1717delN | p.Phe573SerfsTer19 | p.F573Sfs*19 | O15037 | protein_coding | TCGA-D8-A27V-01 | Breast | breast invasive carcinoma | Female | <65 | I/II | Hormone Therapy | tamoxiphen | SD | ||
| KHNYN | SNV | Missense_Mutation | novel | c.1157G>T | p.Gly386Val | p.G386V | O15037 | protein_coding | deleterious(0.01) | benign(0.276) | TCGA-VS-A8QC-01 | Cervix | cervical & endocervical cancer | Female | <65 | I/II | Chemotherapy | paclitaxel | PD |
| KHNYN | SNV | Missense_Mutation | c.338C>A | p.Pro113His | p.P113H | O15037 | protein_coding | deleterious(0.02) | probably_damaging(0.946) | TCGA-A6-5665-01 | Colorectum | colon adenocarcinoma | Female | >=65 | I/II | Unknown | Unknown | PD | |
| KHNYN | SNV | Missense_Mutation | novel | c.1922A>G | p.Gln641Arg | p.Q641R | O15037 | protein_coding | deleterious(0.04) | possibly_damaging(0.622) | TCGA-AA-3663-01 | Colorectum | colon adenocarcinoma | Male | <65 | I/II | Unknown | Unknown | SD |
| KHNYN | SNV | Missense_Mutation | c.1159N>A | p.Asp387Asn | p.D387N | O15037 | protein_coding | deleterious(0.04) | possibly_damaging(0.655) | TCGA-AD-6890-01 | Colorectum | colon adenocarcinoma | Male | >=65 | I/II | Unknown | Unknown | SD | |
| KHNYN | SNV | Missense_Mutation | c.1244G>A | p.Arg415His | p.R415H | O15037 | protein_coding | deleterious(0) | probably_damaging(0.997) | TCGA-QG-A5Z2-01 | Colorectum | colon adenocarcinoma | Male | <65 | I/II | Unknown | Unknown | SD | |
| KHNYN | SNV | Missense_Mutation | novel | c.656C>A | p.Ala219Asp | p.A219D | O15037 | protein_coding | tolerated(0.18) | benign(0.003) | TCGA-A5-A0G2-01 | Endometrium | uterine corpus endometrioid carcinoma | Female | <65 | III/IV | Unknown | Unknown | SD |
| Page: 1 2 3 4 5 6 |
Top |
Related drugs of malignant transformation related genes |
| Identification of chemicals and drugs interact with genes involved in malignant transfromation |
| (DGIdb 4.0) |
| Entrez ID | Symbol | Category | Interaction Types | Drug Claim Name | Drug Name | PMIDs |
| Page: 1 |

Copyright 2023-Present -The University of Texas Health Science Center at Houston |