
|
|||||
|
 | |
| |
| |
| |
| |
| |
|
Gene: KHK |
Gene summary for KHK |
| Gene information | Species | Human | Gene symbol | KHK | Gene ID | 3795 |
| Gene name | ketohexokinase | |
| Gene Alias | KHK | |
| Cytomap | 2p23.3 | |
| Gene Type | protein-coding | GO ID | GO:0005975 | UniProtAcc | A0A140VJM6 |
Top |
Malignant transformation analysis |
| Identification of the aberrant gene expression in precancerous and cancerous lesions by comparing the gene expression of stem-like cells in diseased tissues with normal stem cells |
| Entrez ID | Symbol | Replicates | Species | Organ | Tissue | Adj P-value | Log2FC | Malignancy |
| 3795 | KHK | LZE4T | Human | Esophagus | ESCC | 2.18e-06 | 2.02e-01 | 0.0811 |
| 3795 | KHK | P2T-E | Human | Esophagus | ESCC | 1.18e-12 | 2.30e-01 | 0.1177 |
| 3795 | KHK | P4T-E | Human | Esophagus | ESCC | 8.33e-13 | 3.29e-01 | 0.1323 |
| 3795 | KHK | P8T-E | Human | Esophagus | ESCC | 6.84e-05 | 3.95e-02 | 0.0889 |
| 3795 | KHK | P10T-E | Human | Esophagus | ESCC | 2.67e-12 | 3.03e-01 | 0.116 |
| 3795 | KHK | P11T-E | Human | Esophagus | ESCC | 2.46e-02 | 1.51e-01 | 0.1426 |
| 3795 | KHK | P12T-E | Human | Esophagus | ESCC | 1.18e-13 | 2.54e-01 | 0.1122 |
| 3795 | KHK | P15T-E | Human | Esophagus | ESCC | 3.34e-06 | 1.47e-01 | 0.1149 |
| 3795 | KHK | P16T-E | Human | Esophagus | ESCC | 1.71e-10 | 1.78e-01 | 0.1153 |
| 3795 | KHK | P20T-E | Human | Esophagus | ESCC | 3.97e-02 | 7.73e-02 | 0.1124 |
| 3795 | KHK | P21T-E | Human | Esophagus | ESCC | 1.11e-03 | 3.77e-02 | 0.1617 |
| 3795 | KHK | P22T-E | Human | Esophagus | ESCC | 3.48e-12 | 2.69e-01 | 0.1236 |
| 3795 | KHK | P23T-E | Human | Esophagus | ESCC | 1.48e-05 | 1.53e-01 | 0.108 |
| 3795 | KHK | P24T-E | Human | Esophagus | ESCC | 2.04e-03 | 8.12e-02 | 0.1287 |
| 3795 | KHK | P26T-E | Human | Esophagus | ESCC | 2.98e-09 | 2.08e-01 | 0.1276 |
| 3795 | KHK | P27T-E | Human | Esophagus | ESCC | 1.57e-02 | 8.34e-02 | 0.1055 |
| 3795 | KHK | P28T-E | Human | Esophagus | ESCC | 6.34e-21 | 3.70e-01 | 0.1149 |
| 3795 | KHK | P48T-E | Human | Esophagus | ESCC | 9.14e-11 | 1.62e-01 | 0.0959 |
| 3795 | KHK | P49T-E | Human | Esophagus | ESCC | 4.64e-06 | 5.34e-01 | 0.1768 |
| 3795 | KHK | P52T-E | Human | Esophagus | ESCC | 2.17e-04 | 8.56e-02 | 0.1555 |
| Page: 1 2 3 |
| Tissue | Expression Dynamics | Abbreviation |
| Esophagus |  | ESCC: Esophageal squamous cell carcinoma |
| HGIN: High-grade intraepithelial neoplasias | ||
| LGIN: Low-grade intraepithelial neoplasias | ||
| GC |  | CAG: Chronic atrophic gastritis |
| CAG with IM: Chronic atrophic gastritis with intestinal metaplasia | ||
| CSG: Chronic superficial gastritis | ||
| GC: Gastric cancer | ||
| SIM: Severe intestinal metaplasia | ||
| WIM: Wild intestinal metaplasia | ||
| Liver | 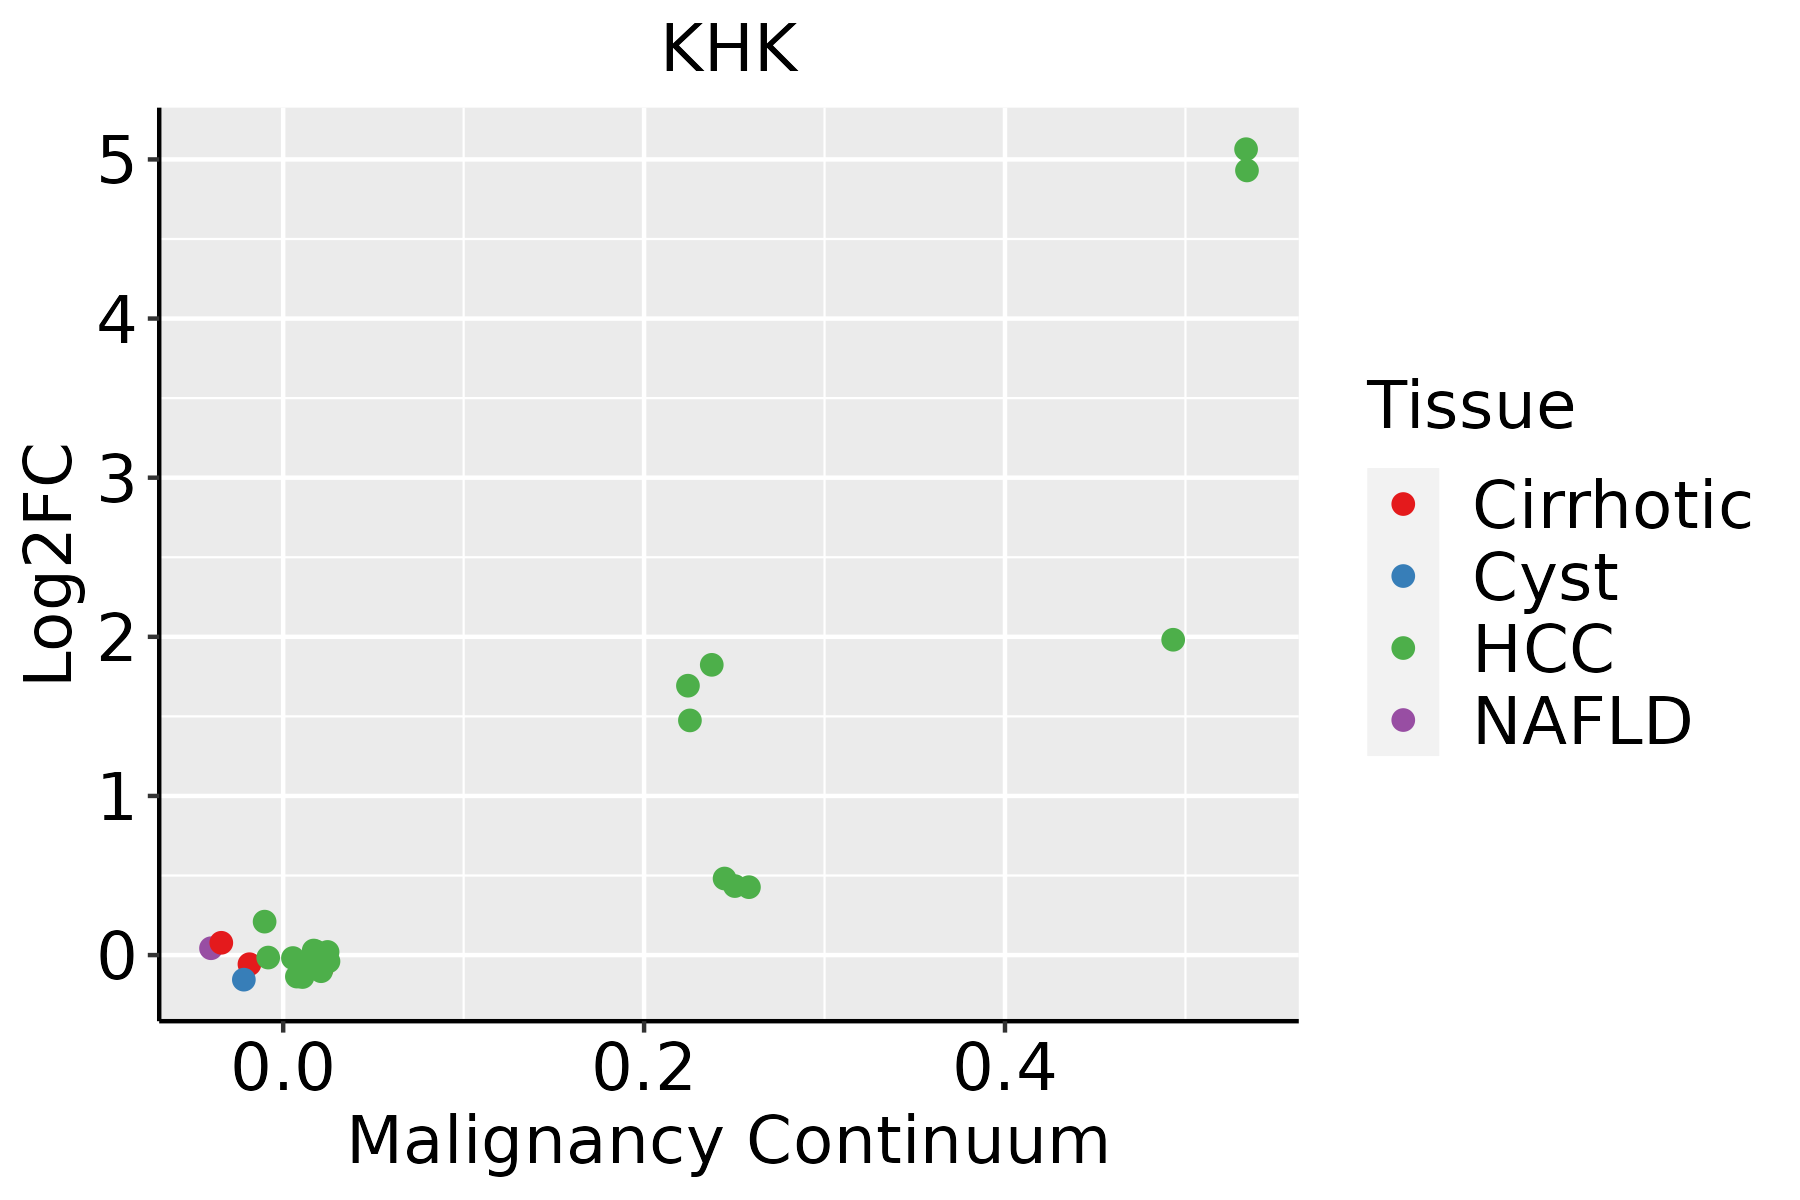 | HCC: Hepatocellular carcinoma |
| NAFLD: Non-alcoholic fatty liver disease |
| ∗log2FC in expression of this searched gene in stem-like cells from each diseased tissue sample relative to stem-like cells in normal samples in each tissue plotted against the malignancy continuum. Samples are colored based on if they are from different disease stage. |
Top |
Malignant transformation related pathway analysis |
| Find out the enriched GO biological processes and KEGG pathways involved in transition from healthy to precancer to cancer |
| Tissue | Disease Stage | Enriched GO biological Processes |
| Colorectum | AD |  |
| Colorectum | SER |  |
| Colorectum | MSS |  |
| Colorectum | MSI-H |  |
| Colorectum | FAP |  |
| ∗Top 15 enriched GO BP terms are showed in the bar plot of each disease state in each tissue. Each row represents a significant GO biological process which is colored according to the -log10(p.adjust). |
| Page: 1 2 3 4 5 6 7 8 9 |
| GO ID | Tissue | Disease Stage | Description | Gene Ratio | Bg Ratio | pvalue | p.adjust | Count |
| GO:0006091110 | Esophagus | ESCC | generation of precursor metabolites and energy | 331/8552 | 490/18723 | 3.86e-23 | 8.45e-21 | 331 |
| GO:0015980110 | Esophagus | ESCC | energy derivation by oxidation of organic compounds | 220/8552 | 318/18723 | 1.20e-17 | 1.09e-15 | 220 |
| GO:00059969 | Esophagus | ESCC | monosaccharide metabolic process | 159/8552 | 257/18723 | 1.11e-07 | 1.81e-06 | 159 |
| GO:00193189 | Esophagus | ESCC | hexose metabolic process | 147/8552 | 237/18723 | 2.63e-07 | 3.94e-06 | 147 |
| GO:0043434111 | Esophagus | ESCC | response to peptide hormone | 234/8552 | 414/18723 | 4.93e-06 | 5.21e-05 | 234 |
| GO:003286818 | Esophagus | ESCC | response to insulin | 156/8552 | 264/18723 | 7.21e-06 | 7.20e-05 | 156 |
| GO:00060069 | Esophagus | ESCC | glucose metabolic process | 119/8552 | 196/18723 | 1.51e-05 | 1.36e-04 | 119 |
| GO:001003827 | Esophagus | ESCC | response to metal ion | 208/8552 | 373/18723 | 5.02e-05 | 3.90e-04 | 208 |
| GO:004346719 | Esophagus | ESCC | regulation of generation of precursor metabolites and energy | 81/8552 | 130/18723 | 9.58e-05 | 6.81e-04 | 81 |
| GO:00442626 | Esophagus | ESCC | cellular carbohydrate metabolic process | 160/8552 | 283/18723 | 1.43e-04 | 9.66e-04 | 160 |
| GO:00620129 | Esophagus | ESCC | regulation of small molecule metabolic process | 184/8552 | 334/18723 | 3.11e-04 | 1.85e-03 | 184 |
| GO:00109065 | Esophagus | ESCC | regulation of glucose metabolic process | 71/8552 | 119/18723 | 1.46e-03 | 6.92e-03 | 71 |
| GO:00061096 | Esophagus | ESCC | regulation of carbohydrate metabolic process | 101/8552 | 178/18723 | 1.89e-03 | 8.52e-03 | 101 |
| GO:00106755 | Esophagus | ESCC | regulation of cellular carbohydrate metabolic process | 83/8552 | 146/18723 | 4.24e-03 | 1.69e-02 | 83 |
| GO:0009743111 | Esophagus | ESCC | response to carbohydrate | 135/8552 | 253/18723 | 8.16e-03 | 2.89e-02 | 135 |
| GO:000609112 | Liver | Cirrhotic | generation of precursor metabolites and energy | 238/4634 | 490/18723 | 6.85e-31 | 1.07e-27 | 238 |
| GO:001598012 | Liver | Cirrhotic | energy derivation by oxidation of organic compounds | 154/4634 | 318/18723 | 3.11e-20 | 8.87e-18 | 154 |
| GO:001003812 | Liver | Cirrhotic | response to metal ion | 150/4634 | 373/18723 | 2.27e-11 | 1.37e-09 | 150 |
| GO:000599612 | Liver | Cirrhotic | monosaccharide metabolic process | 104/4634 | 257/18723 | 1.74e-08 | 6.32e-07 | 104 |
| GO:001931812 | Liver | Cirrhotic | hexose metabolic process | 97/4634 | 237/18723 | 2.67e-08 | 9.16e-07 | 97 |
| Page: 1 2 3 4 5 6 |
| Pathway ID | Tissue | Disease Stage | Description | Gene Ratio | Bg Ratio | pvalue | p.adjust | qvalue | Count |
| hsa000512 | Esophagus | ESCC | Fructose and mannose metabolism | 24/4205 | 34/8465 | 1.09e-02 | 2.51e-02 | 1.29e-02 | 24 |
| hsa0005111 | Esophagus | ESCC | Fructose and mannose metabolism | 24/4205 | 34/8465 | 1.09e-02 | 2.51e-02 | 1.29e-02 | 24 |
| Page: 1 |
Top |
Cell-cell communication analysis |
| Identification of potential cell-cell interactions between two cell types and their ligand-receptor pairs for different disease states |
| Ligand | Receptor | LRpair | Pathway | Tissue | Disease Stage |
| Page: 1 |
Top |
Single-cell gene regulatory network inference analysis |
| Find out the significant the regulons (TFs) and the target genes of each regulon across cell types for different disease states |
| TF | Cell Type | Tissue | Disease Stage | Target Gene | RSS | Regulon Activity |
| ∗The dot plots of a searched regulon are shown for all cell subpopulations in each disease state of each tissue based on the regulon specific score inferred using pySCENIC and by calculating the average expression. |
| Page: 1 |
Top |
Somatic mutation of malignant transformation related genes |
| Annotation of somatic variants for genes involved in malignant transformation |
| Hugo Symbol | Variant Class | Variant Classification | dbSNP RS | HGVSc | HGVSp | HGVSp Short | SWISSPROT | BIOTYPE | SIFT | PolyPhen | Tumor Sample Barcode | Tissue | Histology | Sex | Age | Stage | Therapy Types | Drugs | Outcome |
| KHK | SNV | Missense_Mutation | rs199989985 | c.745N>T | p.Arg249Cys | p.R249C | P50053 | protein_coding | tolerated(0.07) | benign(0.015) | TCGA-D8-A1XQ-01 | Breast | breast invasive carcinoma | Female | >=65 | I/II | Unknown | Unknown | SD |
| KHK | insertion | Nonsense_Mutation | novel | c.415_416insGCACTCCAGCCTGGGTGACAGAGTGACTCTGTCTCAAAAAAACAAAA | p.Glu139GlyfsTer9 | p.E139Gfs*9 | P50053 | protein_coding | TCGA-AN-A0FS-01 | Breast | breast invasive carcinoma | Female | <65 | I/II | Unknown | Unknown | SD | ||
| KHK | SNV | Missense_Mutation | rs765447076 | c.235N>C | p.Tyr79His | p.Y79H | P50053 | protein_coding | tolerated(0.21) | benign(0.036) | TCGA-DS-A7WH-01 | Cervix | cervical & endocervical cancer | Female | <65 | I/II | Chemotherapy | cisplatin | CR |
| KHK | SNV | Missense_Mutation | c.836N>C | p.Arg279Thr | p.R279T | P50053 | protein_coding | tolerated(1) | benign(0.006) | TCGA-JX-A3Q8-01 | Cervix | cervical & endocervical cancer | Female | <65 | I/II | Unknown | Unknown | SD | |
| KHK | SNV | Missense_Mutation | novel | c.87N>T | p.Glu29Asp | p.E29D | P50053 | protein_coding | tolerated(1) | benign(0) | TCGA-CA-6717-01 | Colorectum | colon adenocarcinoma | Male | <65 | I/II | Chemotherapy | oxaliplatin | CR |
| KHK | SNV | Missense_Mutation | rs201014038 | c.427G>A | p.Ala143Thr | p.A143T | P50053 | protein_coding | tolerated(0.28) | possibly_damaging(0.806) | TCGA-G4-6304-01 | Colorectum | colon adenocarcinoma | Female | >=65 | I/II | Chemotherapy | fluorouracil | PD |
| KHK | SNV | Missense_Mutation | rs104893644 | c.127N>A | p.Ala43Thr | p.A43T | P50053 | protein_coding | deleterious(0) | possibly_damaging(0.897) | TCGA-NH-A5IV-01 | Colorectum | colon adenocarcinoma | Female | >=65 | I/II | Unknown | Unknown | SD |
| KHK | SNV | Missense_Mutation | novel | c.215N>C | p.Val72Ala | p.V72A | P50053 | protein_coding | tolerated(0.32) | benign(0.277) | TCGA-A5-A0G2-01 | Endometrium | uterine corpus endometrioid carcinoma | Female | <65 | III/IV | Unknown | Unknown | SD |
| KHK | SNV | Missense_Mutation | novel | c.83N>T | p.Ser28Leu | p.S28L | P50053 | protein_coding | tolerated(0.09) | benign(0.185) | TCGA-AP-A1DV-01 | Endometrium | uterine corpus endometrioid carcinoma | Female | <65 | I/II | Unknown | Unknown | SD |
| KHK | SNV | Missense_Mutation | rs200431044 | c.157N>T | p.Leu53Phe | p.L53F | P50053 | protein_coding | deleterious(0.03) | probably_damaging(0.984) | TCGA-AX-A0J0-01 | Endometrium | uterine corpus endometrioid carcinoma | Female | <65 | I/II | Unknown | Unknown | SD |
| Page: 1 2 3 4 |
Top |
Related drugs of malignant transformation related genes |
| Identification of chemicals and drugs interact with genes involved in malignant transfromation |
| (DGIdb 4.0) |
| Entrez ID | Symbol | Category | Interaction Types | Drug Claim Name | Drug Name | PMIDs |
| 3795 | KHK | KINASE, ENZYME, DRUGGABLE GENOME | fructose | FRUCTOSE | 24915143 |
| Page: 1 |

Copyright 2023-Present -The University of Texas Health Science Center at Houston |