
|
|||||
|
 | |
| |
| |
| |
| |
| |
|
Gene: KHDRBS3 |
Gene summary for KHDRBS3 |
| Gene information | Species | Human | Gene symbol | KHDRBS3 | Gene ID | 10656 |
| Gene name | KH RNA binding domain containing, signal transduction associated 3 | |
| Gene Alias | Etle | |
| Cytomap | 8q24.23 | |
| Gene Type | protein-coding | GO ID | GO:0000375 | UniProtAcc | O75525 |
Top |
Malignant transformation analysis |
| Identification of the aberrant gene expression in precancerous and cancerous lesions by comparing the gene expression of stem-like cells in diseased tissues with normal stem cells |
| Entrez ID | Symbol | Replicates | Species | Organ | Tissue | Adj P-value | Log2FC | Malignancy |
| 10656 | KHDRBS3 | P2T-E | Human | Esophagus | ESCC | 3.26e-13 | 2.16e-01 | 0.1177 |
| 10656 | KHDRBS3 | P5T-E | Human | Esophagus | ESCC | 5.45e-13 | 3.49e-01 | 0.1327 |
| 10656 | KHDRBS3 | P10T-E | Human | Esophagus | ESCC | 1.17e-10 | 6.36e-02 | 0.116 |
| 10656 | KHDRBS3 | P11T-E | Human | Esophagus | ESCC | 2.74e-03 | 1.68e-01 | 0.1426 |
| 10656 | KHDRBS3 | P12T-E | Human | Esophagus | ESCC | 1.29e-07 | 1.56e-01 | 0.1122 |
| 10656 | KHDRBS3 | P16T-E | Human | Esophagus | ESCC | 1.24e-16 | 4.59e-01 | 0.1153 |
| 10656 | KHDRBS3 | P22T-E | Human | Esophagus | ESCC | 1.38e-04 | 5.91e-04 | 0.1236 |
| 10656 | KHDRBS3 | P24T-E | Human | Esophagus | ESCC | 1.58e-02 | 6.84e-02 | 0.1287 |
| 10656 | KHDRBS3 | P26T-E | Human | Esophagus | ESCC | 1.37e-08 | 2.07e-01 | 0.1276 |
| 10656 | KHDRBS3 | P28T-E | Human | Esophagus | ESCC | 4.00e-09 | 1.34e-01 | 0.1149 |
| 10656 | KHDRBS3 | P30T-E | Human | Esophagus | ESCC | 6.75e-05 | 1.71e-01 | 0.137 |
| 10656 | KHDRBS3 | P32T-E | Human | Esophagus | ESCC | 1.27e-03 | 8.34e-02 | 0.1666 |
| 10656 | KHDRBS3 | P37T-E | Human | Esophagus | ESCC | 3.89e-02 | -6.41e-02 | 0.1371 |
| 10656 | KHDRBS3 | P42T-E | Human | Esophagus | ESCC | 3.59e-03 | 3.75e-02 | 0.1175 |
| 10656 | KHDRBS3 | P47T-E | Human | Esophagus | ESCC | 4.34e-02 | -1.63e-02 | 0.1067 |
| 10656 | KHDRBS3 | P52T-E | Human | Esophagus | ESCC | 9.16e-06 | 3.25e-02 | 0.1555 |
| 10656 | KHDRBS3 | P54T-E | Human | Esophagus | ESCC | 7.24e-16 | 2.50e-01 | 0.0975 |
| 10656 | KHDRBS3 | P56T-E | Human | Esophagus | ESCC | 8.34e-06 | 6.71e-01 | 0.1613 |
| 10656 | KHDRBS3 | P61T-E | Human | Esophagus | ESCC | 1.01e-03 | -4.16e-02 | 0.099 |
| 10656 | KHDRBS3 | P74T-E | Human | Esophagus | ESCC | 8.85e-04 | 3.19e-02 | 0.1479 |
| Page: 1 2 3 |
| Tissue | Expression Dynamics | Abbreviation |
| Esophagus |  | ESCC: Esophageal squamous cell carcinoma |
| HGIN: High-grade intraepithelial neoplasias | ||
| LGIN: Low-grade intraepithelial neoplasias | ||
| Liver | 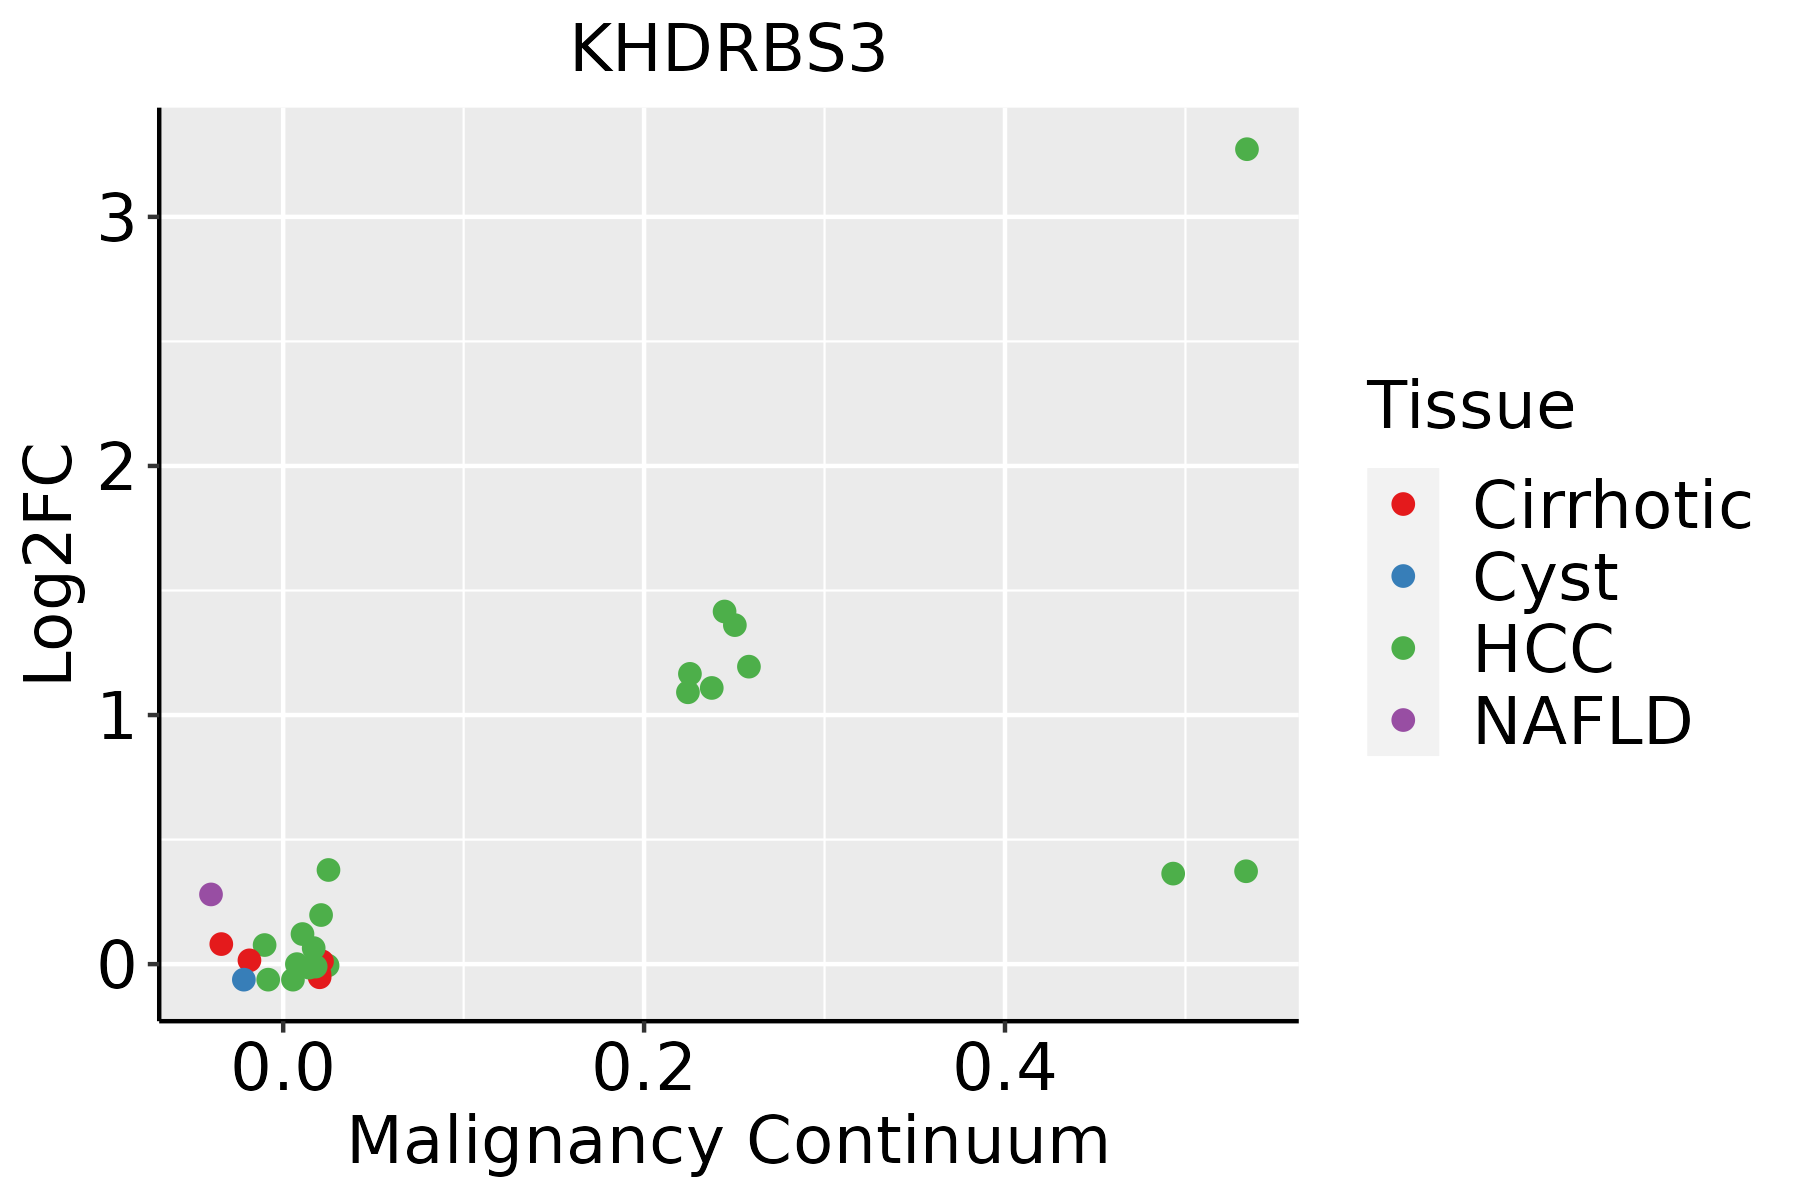 | HCC: Hepatocellular carcinoma |
| NAFLD: Non-alcoholic fatty liver disease | ||
| Lung |  | AAH: Atypical adenomatous hyperplasia |
| AIS: Adenocarcinoma in situ | ||
| IAC: Invasive lung adenocarcinoma | ||
| MIA: Minimally invasive adenocarcinoma | ||
| Prostate | 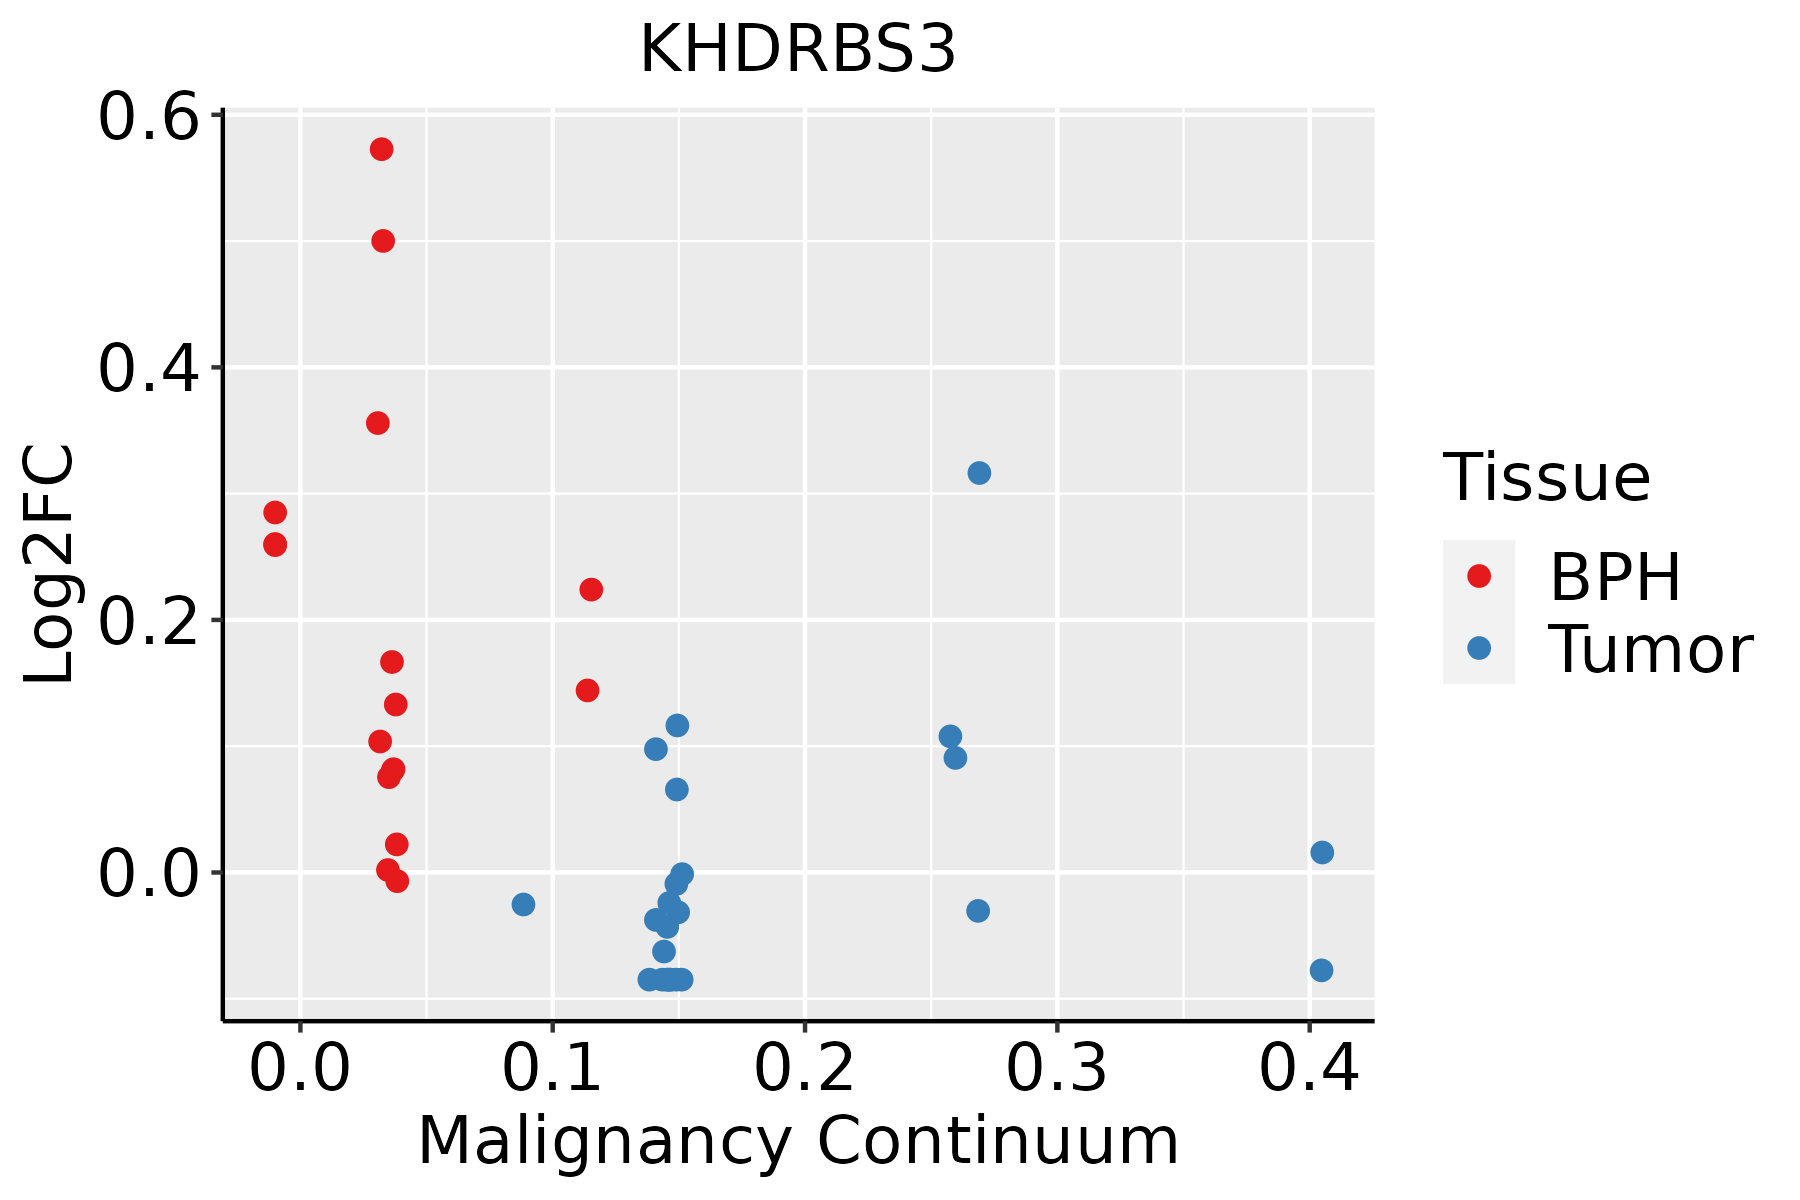 | BPH: Benign Prostatic Hyperplasia |
| ∗log2FC in expression of this searched gene in stem-like cells from each diseased tissue sample relative to stem-like cells in normal samples in each tissue plotted against the malignancy continuum. Samples are colored based on if they are from different disease stage. |
Top |
Malignant transformation related pathway analysis |
| Find out the enriched GO biological processes and KEGG pathways involved in transition from healthy to precancer to cancer |
| Tissue | Disease Stage | Enriched GO biological Processes |
| Colorectum | AD |  |
| Colorectum | SER |  |
| Colorectum | MSS |  |
| Colorectum | MSI-H |  |
| Colorectum | FAP |  |
| ∗Top 15 enriched GO BP terms are showed in the bar plot of each disease state in each tissue. Each row represents a significant GO biological process which is colored according to the -log10(p.adjust). |
| Page: 1 2 3 4 5 6 7 8 9 |
| GO ID | Tissue | Disease Stage | Description | Gene Ratio | Bg Ratio | pvalue | p.adjust | Count |
| GO:0008380111 | Esophagus | ESCC | RNA splicing | 336/8552 | 434/18723 | 1.74e-42 | 3.67e-39 | 336 |
| GO:0000375111 | Esophagus | ESCC | RNA splicing, via transesterification reactions | 248/8552 | 324/18723 | 3.05e-30 | 1.49e-27 | 248 |
| GO:0000377111 | Esophagus | ESCC | RNA splicing, via transesterification reactions with bulged adenosine as nucleophile | 244/8552 | 320/18723 | 2.52e-29 | 1.07e-26 | 244 |
| GO:0000398111 | Esophagus | ESCC | mRNA splicing, via spliceosome | 244/8552 | 320/18723 | 2.52e-29 | 1.07e-26 | 244 |
| GO:1903311110 | Esophagus | ESCC | regulation of mRNA metabolic process | 210/8552 | 288/18723 | 3.25e-21 | 5.56e-19 | 210 |
| GO:0043484111 | Esophagus | ESCC | regulation of RNA splicing | 116/8552 | 148/18723 | 3.18e-16 | 2.38e-14 | 116 |
| GO:0050684110 | Esophagus | ESCC | regulation of mRNA processing | 109/8552 | 137/18723 | 3.51e-16 | 2.59e-14 | 109 |
| GO:0048024111 | Esophagus | ESCC | regulation of mRNA splicing, via spliceosome | 78/8552 | 101/18723 | 8.72e-11 | 2.66e-09 | 78 |
| GO:000038019 | Esophagus | ESCC | alternative mRNA splicing, via spliceosome | 55/8552 | 77/18723 | 4.07e-06 | 4.38e-05 | 55 |
| GO:000038119 | Esophagus | ESCC | regulation of alternative mRNA splicing, via spliceosome | 40/8552 | 60/18723 | 8.30e-04 | 4.28e-03 | 40 |
| GO:000838022 | Liver | HCC | RNA splicing | 313/7958 | 434/18723 | 1.36e-36 | 1.73e-33 | 313 |
| GO:000037522 | Liver | HCC | RNA splicing, via transesterification reactions | 228/7958 | 324/18723 | 1.47e-24 | 4.06e-22 | 228 |
| GO:000037722 | Liver | HCC | RNA splicing, via transesterification reactions with bulged adenosine as nucleophile | 224/7958 | 320/18723 | 1.16e-23 | 2.62e-21 | 224 |
| GO:000039822 | Liver | HCC | mRNA splicing, via spliceosome | 224/7958 | 320/18723 | 1.16e-23 | 2.62e-21 | 224 |
| GO:190331121 | Liver | HCC | regulation of mRNA metabolic process | 205/7958 | 288/18723 | 3.38e-23 | 6.90e-21 | 205 |
| GO:004348422 | Liver | HCC | regulation of RNA splicing | 113/7958 | 148/18723 | 4.32e-17 | 4.15e-15 | 113 |
| GO:005068421 | Liver | HCC | regulation of mRNA processing | 106/7958 | 137/18723 | 7.64e-17 | 7.12e-15 | 106 |
| GO:004802422 | Liver | HCC | regulation of mRNA splicing, via spliceosome | 74/7958 | 101/18723 | 3.29e-10 | 1.10e-08 | 74 |
| GO:000038021 | Liver | HCC | alternative mRNA splicing, via spliceosome | 52/7958 | 77/18723 | 7.87e-06 | 9.27e-05 | 52 |
| GO:000038121 | Liver | HCC | regulation of alternative mRNA splicing, via spliceosome | 37/7958 | 60/18723 | 2.13e-03 | 1.07e-02 | 37 |
| Page: 1 2 3 |
| Pathway ID | Tissue | Disease Stage | Description | Gene Ratio | Bg Ratio | pvalue | p.adjust | qvalue | Count |
| Page: 1 |
Top |
Cell-cell communication analysis |
| Identification of potential cell-cell interactions between two cell types and their ligand-receptor pairs for different disease states |
| Ligand | Receptor | LRpair | Pathway | Tissue | Disease Stage |
| Page: 1 |
Top |
Single-cell gene regulatory network inference analysis |
| Find out the significant the regulons (TFs) and the target genes of each regulon across cell types for different disease states |
| TF | Cell Type | Tissue | Disease Stage | Target Gene | RSS | Regulon Activity |
| ∗The dot plots of a searched regulon are shown for all cell subpopulations in each disease state of each tissue based on the regulon specific score inferred using pySCENIC and by calculating the average expression. |
| Page: 1 |
Top |
Somatic mutation of malignant transformation related genes |
| Annotation of somatic variants for genes involved in malignant transformation |
| Hugo Symbol | Variant Class | Variant Classification | dbSNP RS | HGVSc | HGVSp | HGVSp Short | SWISSPROT | BIOTYPE | SIFT | PolyPhen | Tumor Sample Barcode | Tissue | Histology | Sex | Age | Stage | Therapy Types | Drugs | Outcome |
| KHDRBS3 | SNV | Missense_Mutation | c.864N>A | p.Asp288Glu | p.D288E | O75525 | protein_coding | tolerated(0.61) | benign(0.02) | TCGA-BH-A0BG-01 | Breast | breast invasive carcinoma | Female | >=65 | I/II | Unknown | Unknown | SD | |
| KHDRBS3 | deletion | In_Frame_Del | c.1012_1026delNNNNNNNNNNNNNNN | p.Tyr338_Pro342del | p.Y338_P342del | O75525 | protein_coding | TCGA-D8-A143-01 | Breast | breast invasive carcinoma | Female | <65 | I/II | Chemotherapy | doxorubicin | SD | |||
| KHDRBS3 | SNV | Missense_Mutation | novel | c.112N>A | p.Glu38Lys | p.E38K | O75525 | protein_coding | tolerated(0.27) | possibly_damaging(0.71) | TCGA-C5-A8XH-01 | Cervix | cervical & endocervical cancer | Female | <65 | I/II | Unknown | Unknown | SD |
| KHDRBS3 | SNV | Missense_Mutation | c.331N>A | p.Glu111Lys | p.E111K | O75525 | protein_coding | deleterious(0) | benign(0.444) | TCGA-IR-A3LC-01 | Cervix | cervical & endocervical cancer | Female | <65 | I/II | Unspecific | Cisplatin | Complete Response | |
| KHDRBS3 | deletion | In_Frame_Del | novel | c.58_60delTTC | p.Phe20del | p.F20del | O75525 | protein_coding | TCGA-VS-A9U6-01 | Cervix | cervical & endocervical cancer | Female | <65 | I/II | Chemotherapy | cisplatin | PD | ||
| KHDRBS3 | SNV | Missense_Mutation | rs376433950 | c.560G>A | p.Arg187Gln | p.R187Q | O75525 | protein_coding | tolerated(0.2) | benign(0.358) | TCGA-A6-5661-01 | Colorectum | colon adenocarcinoma | Female | >=65 | I/II | Unknown | Unknown | SD |
| KHDRBS3 | SNV | Missense_Mutation | rs779240853 | c.353N>T | p.Ala118Val | p.A118V | O75525 | protein_coding | deleterious(0.03) | benign(0.119) | TCGA-AA-3672-01 | Colorectum | colon adenocarcinoma | Female | >=65 | III/IV | Unknown | Unknown | SD |
| KHDRBS3 | SNV | Missense_Mutation | novel | c.1001N>A | p.Ala334Glu | p.A334E | O75525 | protein_coding | tolerated(0.05) | possibly_damaging(0.48) | TCGA-AA-3821-01 | Colorectum | colon adenocarcinoma | Female | >=65 | I/II | Unknown | Unknown | SD |
| KHDRBS3 | SNV | Missense_Mutation | novel | c.964N>G | p.Thr322Ala | p.T322A | O75525 | protein_coding | tolerated(0.6) | benign(0.003) | TCGA-AA-3980-01 | Colorectum | colon adenocarcinoma | Female | >=65 | I/II | Unknown | Unknown | SD |
| KHDRBS3 | SNV | Missense_Mutation | novel | c.653N>G | p.Val218Gly | p.V218G | O75525 | protein_coding | tolerated(0.33) | benign(0.006) | TCGA-AA-A02J-01 | Colorectum | colon adenocarcinoma | Female | >=65 | III/IV | Unknown | Unknown | PD |
| Page: 1 2 3 4 5 6 |
Top |
Related drugs of malignant transformation related genes |
| Identification of chemicals and drugs interact with genes involved in malignant transfromation |
| (DGIdb 4.0) |
| Entrez ID | Symbol | Category | Interaction Types | Drug Claim Name | Drug Name | PMIDs |
| Page: 1 |

Copyright 2023-Present -The University of Texas Health Science Center at Houston |