
|
|||||
|
 | |
| |
| |
| |
| |
| |
|
Gene: KEAP1 |
Gene summary for KEAP1 |
| Gene information | Species | Human | Gene symbol | KEAP1 | Gene ID | 9817 |
| Gene name | kelch like ECH associated protein 1 | |
| Gene Alias | INrf2 | |
| Cytomap | 19p13.2 | |
| Gene Type | protein-coding | GO ID | GO:0001701 | UniProtAcc | A0A024R7C0 |
Top |
Malignant transformation analysis |
| Identification of the aberrant gene expression in precancerous and cancerous lesions by comparing the gene expression of stem-like cells in diseased tissues with normal stem cells |
| Entrez ID | Symbol | Replicates | Species | Organ | Tissue | Adj P-value | Log2FC | Malignancy |
| 9817 | KEAP1 | LZE2T | Human | Esophagus | ESCC | 2.96e-03 | 4.40e-01 | 0.082 |
| 9817 | KEAP1 | LZE4T | Human | Esophagus | ESCC | 2.56e-16 | 5.87e-01 | 0.0811 |
| 9817 | KEAP1 | LZE7T | Human | Esophagus | ESCC | 2.76e-11 | 8.03e-01 | 0.0667 |
| 9817 | KEAP1 | LZE8T | Human | Esophagus | ESCC | 5.65e-12 | 4.55e-01 | 0.067 |
| 9817 | KEAP1 | LZE20T | Human | Esophagus | ESCC | 8.54e-04 | 5.35e-02 | 0.0662 |
| 9817 | KEAP1 | LZE22D1 | Human | Esophagus | HGIN | 1.39e-04 | 1.87e-01 | 0.0595 |
| 9817 | KEAP1 | LZE22T | Human | Esophagus | ESCC | 2.68e-05 | 4.63e-01 | 0.068 |
| 9817 | KEAP1 | LZE24T | Human | Esophagus | ESCC | 6.75e-19 | 6.80e-01 | 0.0596 |
| 9817 | KEAP1 | LZE21T | Human | Esophagus | ESCC | 1.33e-04 | 6.53e-01 | 0.0655 |
| 9817 | KEAP1 | LZE6T | Human | Esophagus | ESCC | 1.71e-05 | 3.69e-01 | 0.0845 |
| 9817 | KEAP1 | P1T-E | Human | Esophagus | ESCC | 7.46e-09 | 6.28e-01 | 0.0875 |
| 9817 | KEAP1 | P2T-E | Human | Esophagus | ESCC | 5.33e-32 | 4.75e-01 | 0.1177 |
| 9817 | KEAP1 | P4T-E | Human | Esophagus | ESCC | 4.71e-26 | 7.93e-01 | 0.1323 |
| 9817 | KEAP1 | P5T-E | Human | Esophagus | ESCC | 3.18e-20 | 3.76e-01 | 0.1327 |
| 9817 | KEAP1 | P8T-E | Human | Esophagus | ESCC | 5.64e-33 | 7.29e-01 | 0.0889 |
| 9817 | KEAP1 | P9T-E | Human | Esophagus | ESCC | 3.87e-40 | 1.05e+00 | 0.1131 |
| 9817 | KEAP1 | P10T-E | Human | Esophagus | ESCC | 1.15e-34 | 7.44e-01 | 0.116 |
| 9817 | KEAP1 | P11T-E | Human | Esophagus | ESCC | 5.06e-09 | 7.52e-01 | 0.1426 |
| 9817 | KEAP1 | P12T-E | Human | Esophagus | ESCC | 1.20e-38 | 7.48e-01 | 0.1122 |
| 9817 | KEAP1 | P15T-E | Human | Esophagus | ESCC | 6.81e-32 | 8.68e-01 | 0.1149 |
| Page: 1 2 3 4 5 |
| Tissue | Expression Dynamics | Abbreviation |
| Esophagus |  | ESCC: Esophageal squamous cell carcinoma |
| HGIN: High-grade intraepithelial neoplasias | ||
| LGIN: Low-grade intraepithelial neoplasias | ||
| Liver | 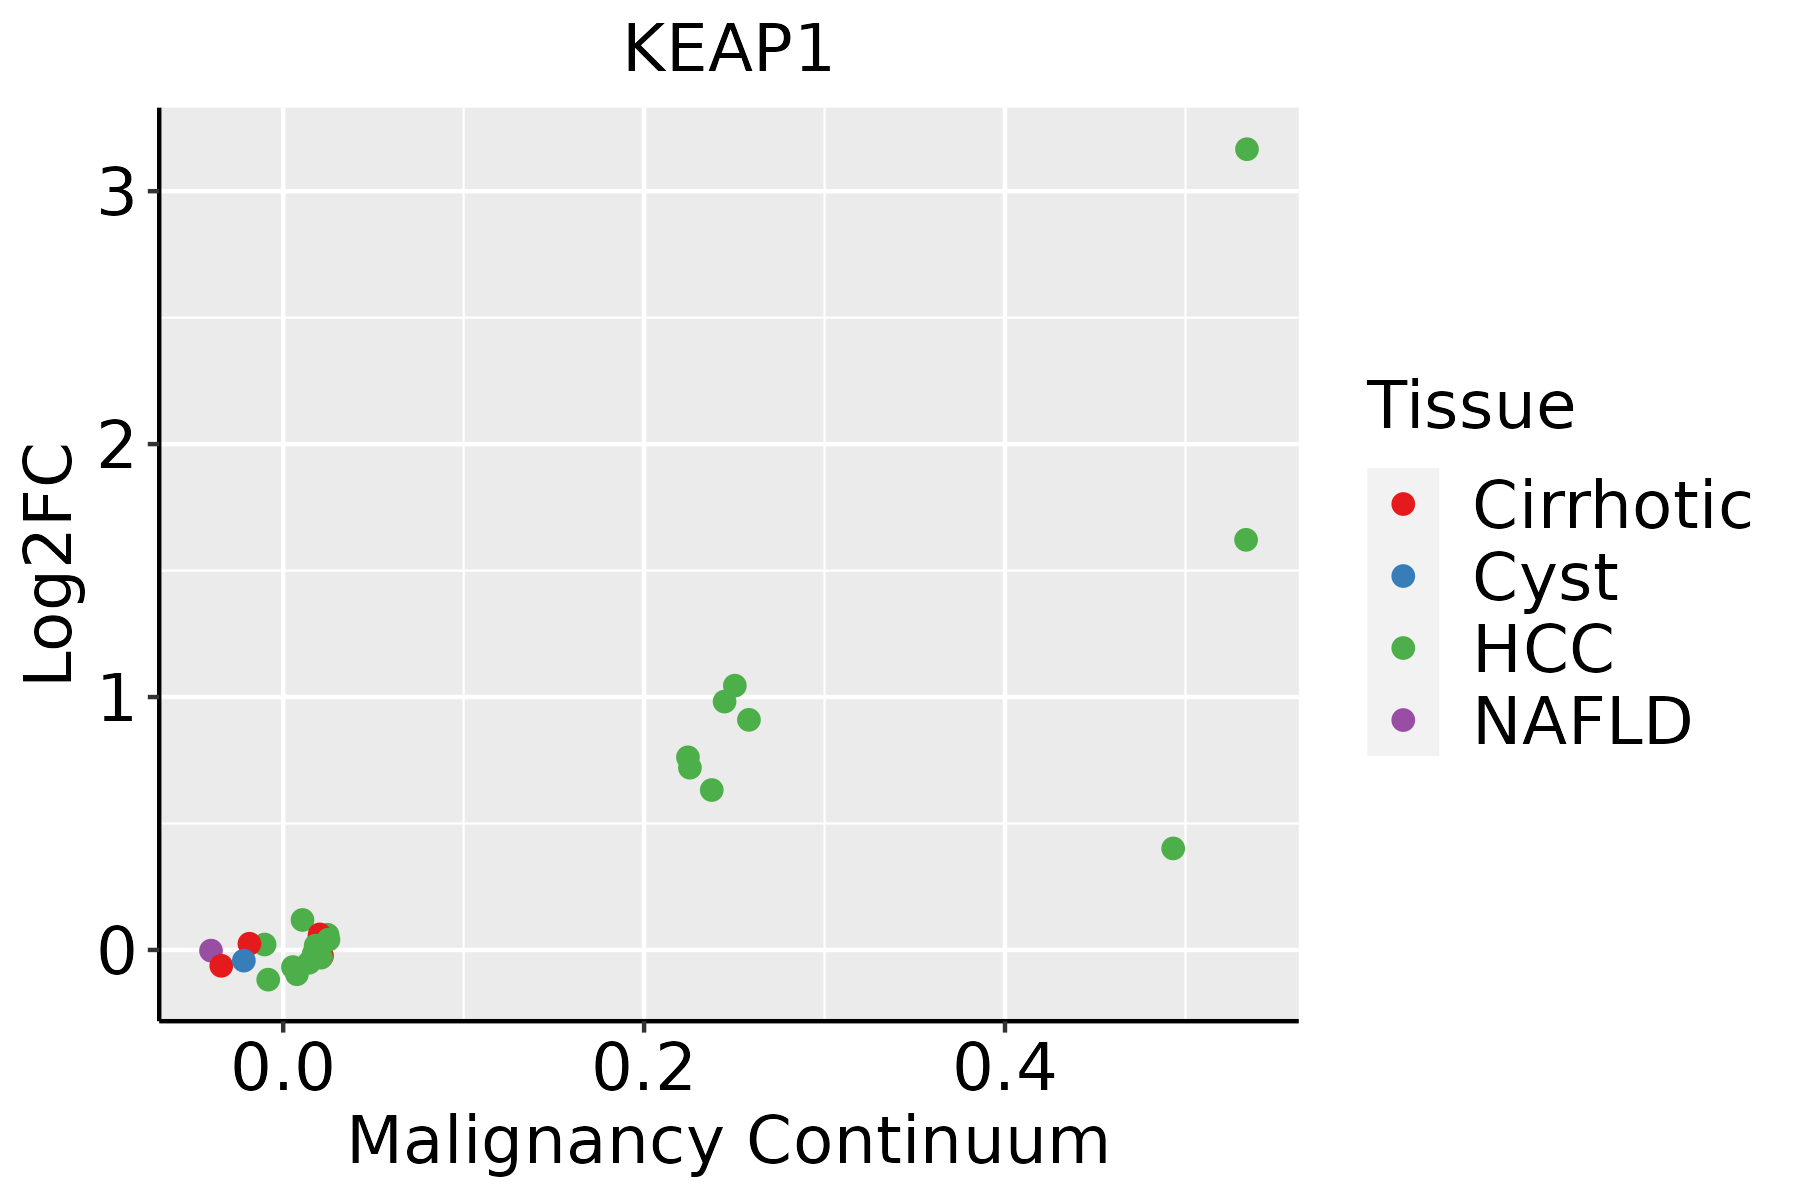 | HCC: Hepatocellular carcinoma |
| NAFLD: Non-alcoholic fatty liver disease | ||
| Oral Cavity | 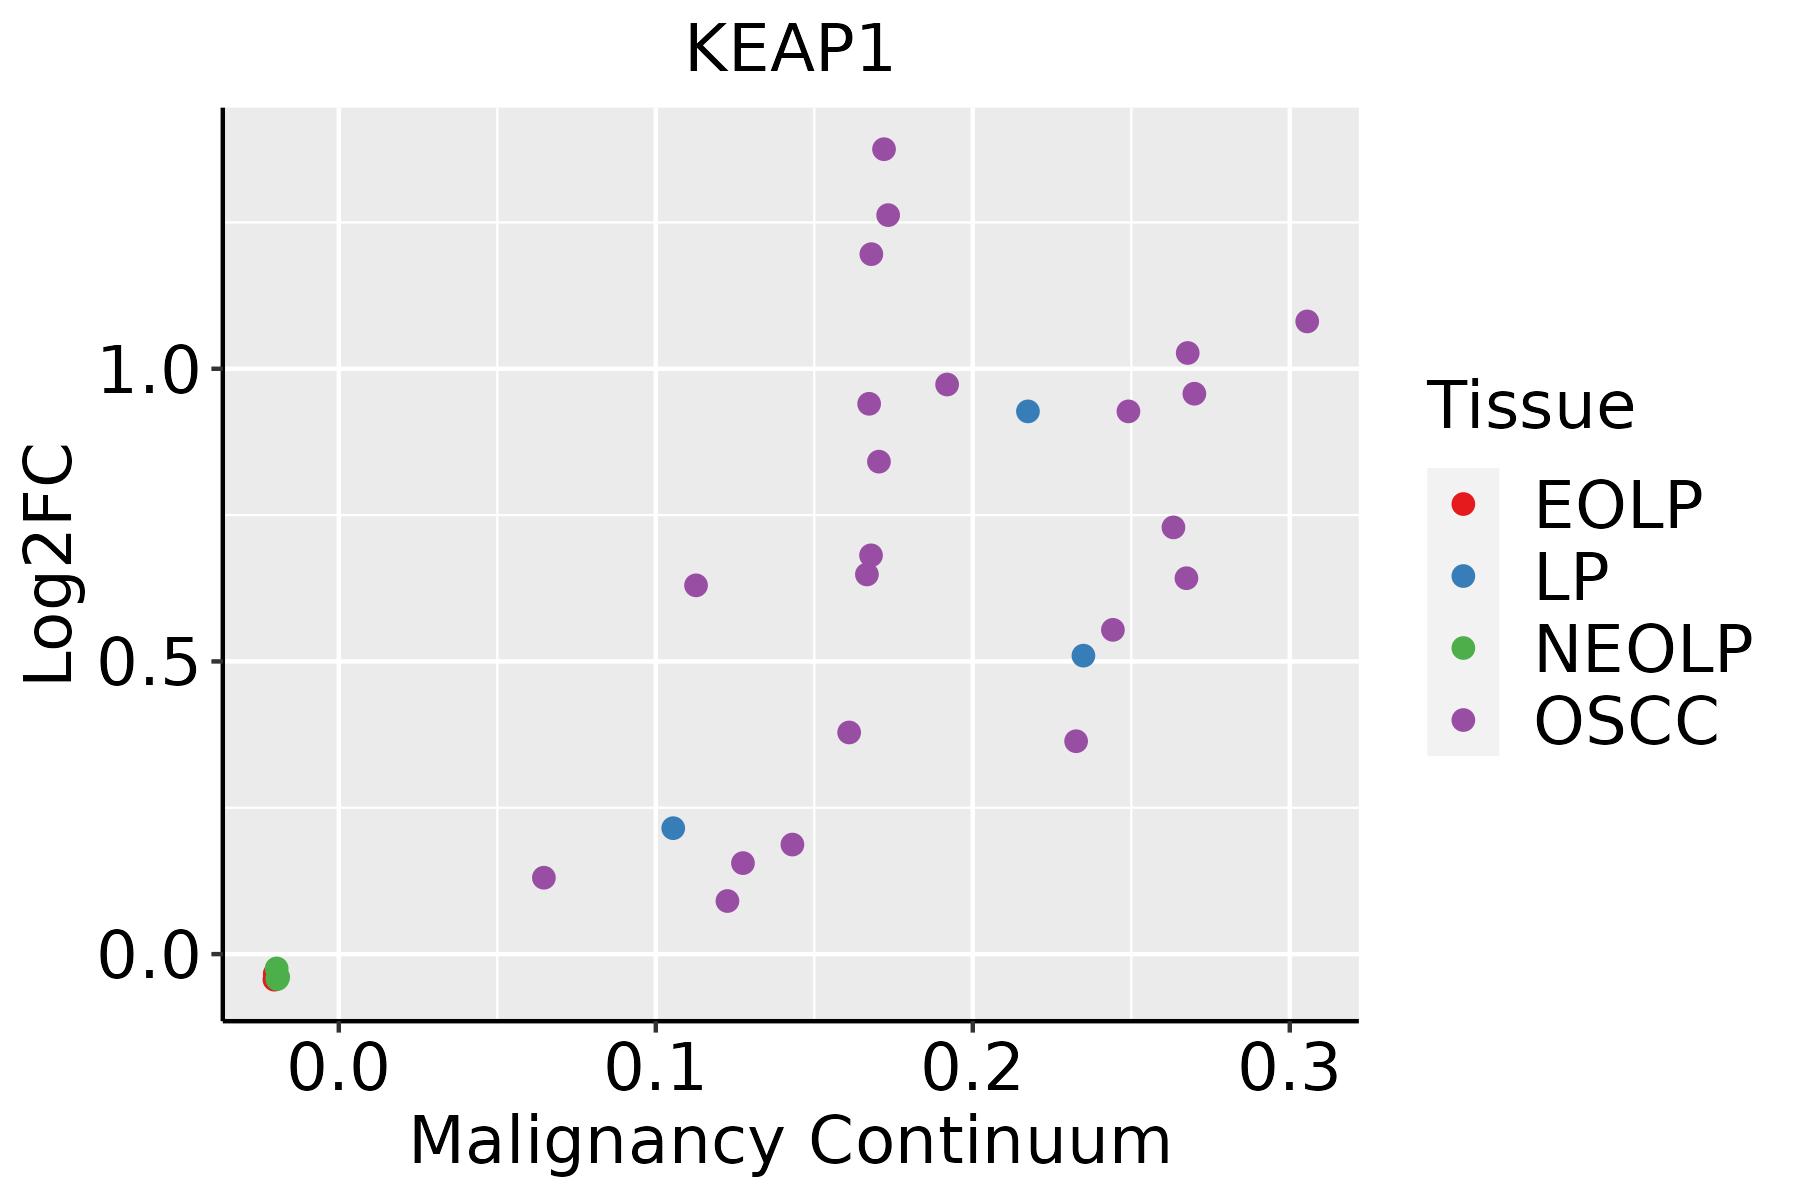 | EOLP: Erosive Oral lichen planus |
| LP: leukoplakia | ||
| NEOLP: Non-erosive oral lichen planus | ||
| OSCC: Oral squamous cell carcinoma | ||
| Skin | 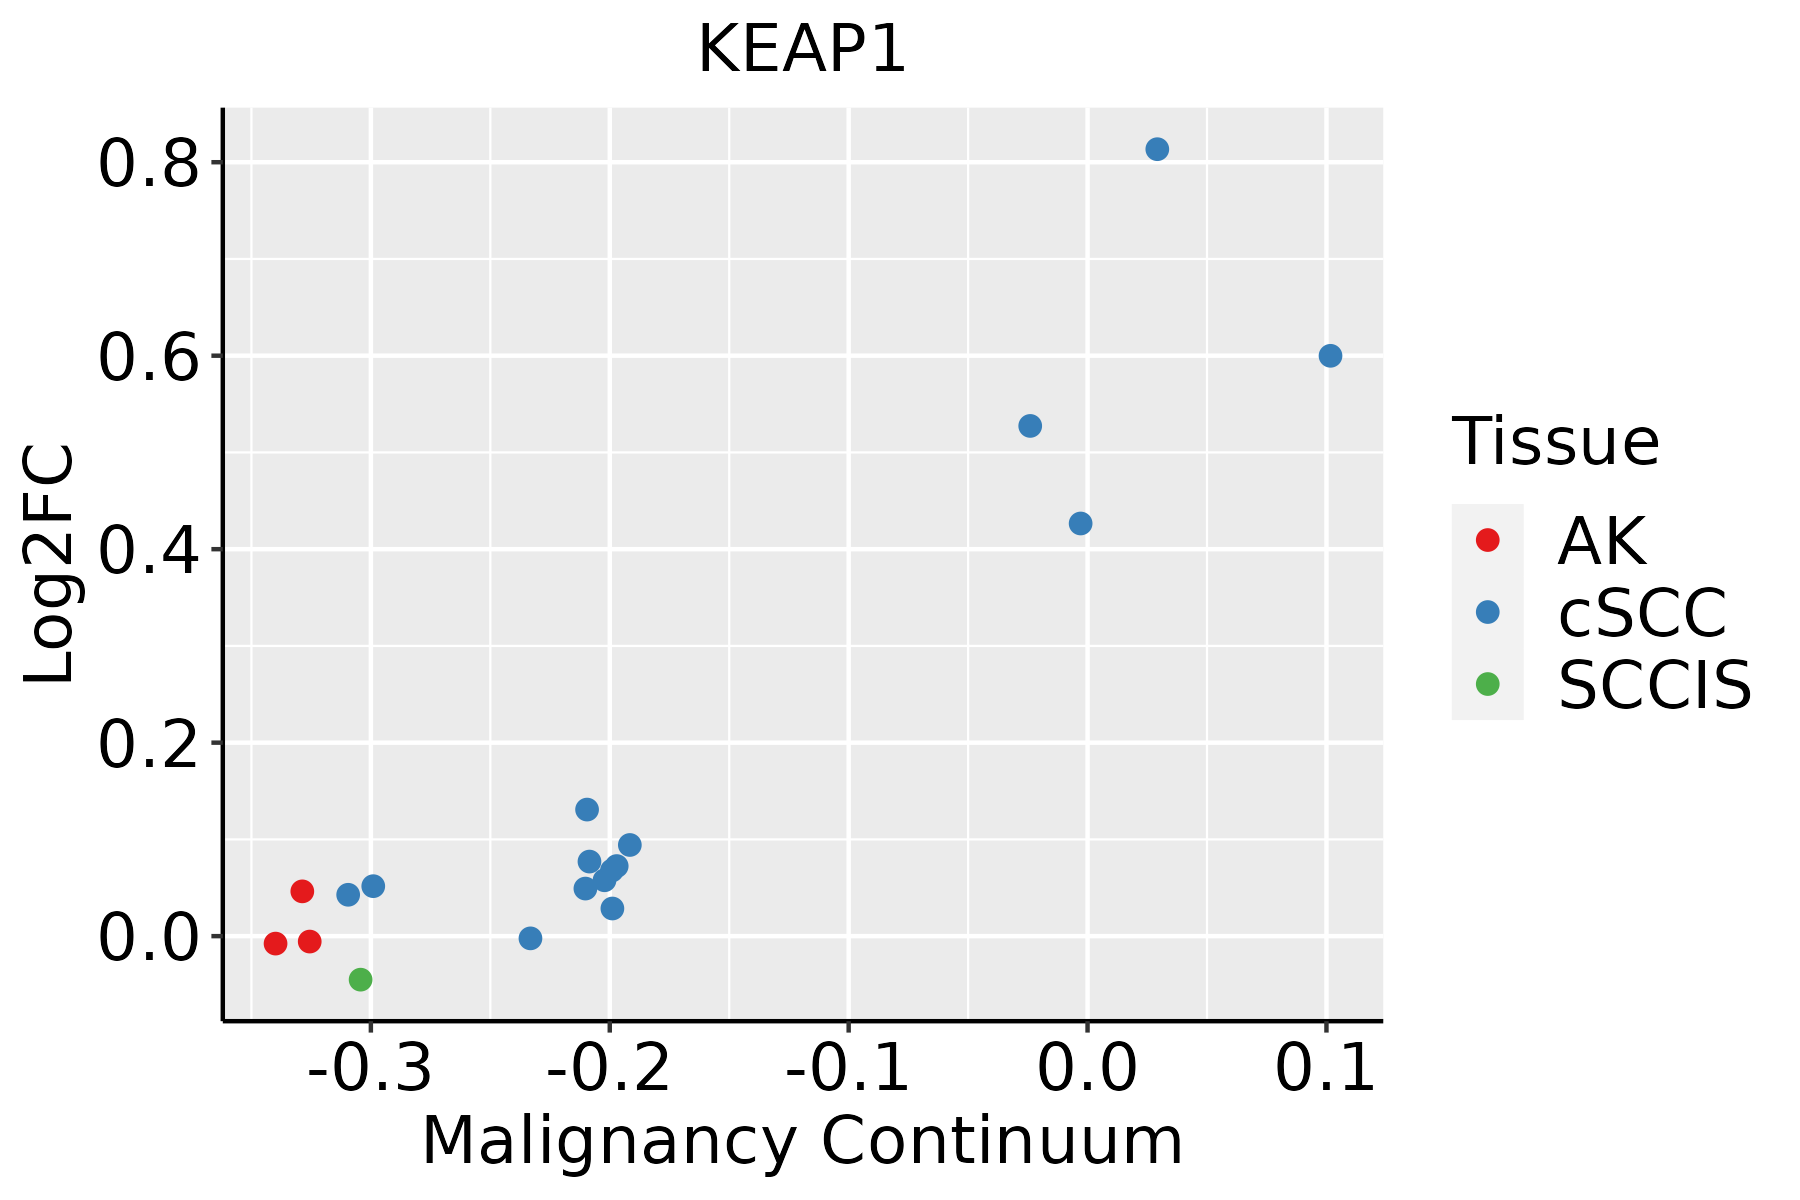 | AK: Actinic keratosis |
| cSCC: Cutaneous squamous cell carcinoma | ||
| SCCIS:squamous cell carcinoma in situ |
| ∗log2FC in expression of this searched gene in stem-like cells from each diseased tissue sample relative to stem-like cells in normal samples in each tissue plotted against the malignancy continuum. Samples are colored based on if they are from different disease stage. |
Top |
Malignant transformation related pathway analysis |
| Find out the enriched GO biological processes and KEGG pathways involved in transition from healthy to precancer to cancer |
| Tissue | Disease Stage | Enriched GO biological Processes |
| Colorectum | AD |  |
| Colorectum | SER |  |
| Colorectum | MSS |  |
| Colorectum | MSI-H |  |
| Colorectum | FAP |  |
| ∗Top 15 enriched GO BP terms are showed in the bar plot of each disease state in each tissue. Each row represents a significant GO biological process which is colored according to the -log10(p.adjust). |
| Page: 1 2 3 4 5 6 7 8 9 |
| GO ID | Tissue | Disease Stage | Description | Gene Ratio | Bg Ratio | pvalue | p.adjust | Count |
| GO:004217627 | Esophagus | HGIN | regulation of protein catabolic process | 119/2587 | 391/18723 | 8.09e-18 | 2.43e-15 | 119 |
| GO:001049826 | Esophagus | HGIN | proteasomal protein catabolic process | 139/2587 | 490/18723 | 1.20e-17 | 3.41e-15 | 139 |
| GO:004586227 | Esophagus | HGIN | positive regulation of proteolysis | 107/2587 | 372/18723 | 2.61e-14 | 4.60e-12 | 107 |
| GO:004316126 | Esophagus | HGIN | proteasome-mediated ubiquitin-dependent protein catabolic process | 114/2587 | 412/18723 | 7.00e-14 | 1.20e-11 | 114 |
| GO:190336227 | Esophagus | HGIN | regulation of cellular protein catabolic process | 81/2587 | 255/18723 | 1.16e-13 | 1.93e-11 | 81 |
| GO:000989626 | Esophagus | HGIN | positive regulation of catabolic process | 126/2587 | 492/18723 | 1.46e-12 | 2.09e-10 | 126 |
| GO:003133126 | Esophagus | HGIN | positive regulation of cellular catabolic process | 112/2587 | 427/18723 | 5.15e-12 | 6.72e-10 | 112 |
| GO:190305027 | Esophagus | HGIN | regulation of proteolysis involved in cellular protein catabolic process | 70/2587 | 221/18723 | 6.21e-12 | 7.76e-10 | 70 |
| GO:006113627 | Esophagus | HGIN | regulation of proteasomal protein catabolic process | 60/2587 | 187/18723 | 1.10e-10 | 1.12e-08 | 60 |
| GO:004573227 | Esophagus | HGIN | positive regulation of protein catabolic process | 69/2587 | 231/18723 | 1.66e-10 | 1.64e-08 | 69 |
| GO:200005827 | Esophagus | HGIN | regulation of ubiquitin-dependent protein catabolic process | 53/2587 | 164/18723 | 9.89e-10 | 8.13e-08 | 53 |
| GO:190336427 | Esophagus | HGIN | positive regulation of cellular protein catabolic process | 51/2587 | 155/18723 | 1.01e-09 | 8.15e-08 | 51 |
| GO:001050616 | Esophagus | HGIN | regulation of autophagy | 84/2587 | 317/18723 | 1.39e-09 | 1.08e-07 | 84 |
| GO:190180020 | Esophagus | HGIN | positive regulation of proteasomal protein catabolic process | 41/2587 | 114/18723 | 2.25e-09 | 1.67e-07 | 41 |
| GO:190305219 | Esophagus | HGIN | positive regulation of proteolysis involved in cellular protein catabolic process | 45/2587 | 133/18723 | 3.55e-09 | 2.53e-07 | 45 |
| GO:000697927 | Esophagus | HGIN | response to oxidative stress | 107/2587 | 446/18723 | 3.91e-09 | 2.76e-07 | 107 |
| GO:003243427 | Esophagus | HGIN | regulation of proteasomal ubiquitin-dependent protein catabolic process | 45/2587 | 134/18723 | 4.64e-09 | 3.12e-07 | 45 |
| GO:003243620 | Esophagus | HGIN | positive regulation of proteasomal ubiquitin-dependent protein catabolic process | 32/2587 | 90/18723 | 1.71e-07 | 8.47e-06 | 32 |
| GO:200006025 | Esophagus | HGIN | positive regulation of ubiquitin-dependent protein catabolic process | 34/2587 | 107/18723 | 1.46e-06 | 5.56e-05 | 34 |
| GO:006219727 | Esophagus | HGIN | cellular response to chemical stress | 76/2587 | 337/18723 | 8.00e-06 | 2.41e-04 | 76 |
| Page: 1 2 3 4 5 6 7 8 9 10 11 |
| Pathway ID | Tissue | Disease Stage | Description | Gene Ratio | Bg Ratio | pvalue | p.adjust | qvalue | Count |
| hsa0501239 | Esophagus | HGIN | Parkinson disease | 124/1383 | 266/8465 | 5.95e-32 | 9.70e-30 | 7.70e-30 | 124 |
| hsa0520839 | Esophagus | HGIN | Chemical carcinogenesis - reactive oxygen species | 92/1383 | 223/8465 | 2.41e-19 | 9.83e-18 | 7.80e-18 | 92 |
| hsa0412026 | Esophagus | HGIN | Ubiquitin mediated proteolysis | 49/1383 | 142/8465 | 7.78e-08 | 1.33e-06 | 1.06e-06 | 49 |
| hsa0541839 | Esophagus | HGIN | Fluid shear stress and atherosclerosis | 42/1383 | 139/8465 | 2.92e-05 | 3.81e-04 | 3.02e-04 | 42 |
| hsa05012114 | Esophagus | HGIN | Parkinson disease | 124/1383 | 266/8465 | 5.95e-32 | 9.70e-30 | 7.70e-30 | 124 |
| hsa05208115 | Esophagus | HGIN | Chemical carcinogenesis - reactive oxygen species | 92/1383 | 223/8465 | 2.41e-19 | 9.83e-18 | 7.80e-18 | 92 |
| hsa04120111 | Esophagus | HGIN | Ubiquitin mediated proteolysis | 49/1383 | 142/8465 | 7.78e-08 | 1.33e-06 | 1.06e-06 | 49 |
| hsa05418115 | Esophagus | HGIN | Fluid shear stress and atherosclerosis | 42/1383 | 139/8465 | 2.92e-05 | 3.81e-04 | 3.02e-04 | 42 |
| hsa0412027 | Esophagus | ESCC | Ubiquitin mediated proteolysis | 122/4205 | 142/8465 | 6.53e-20 | 7.29e-18 | 3.74e-18 | 122 |
| hsa05012211 | Esophagus | ESCC | Parkinson disease | 201/4205 | 266/8465 | 1.56e-18 | 8.72e-17 | 4.46e-17 | 201 |
| hsa05208211 | Esophagus | ESCC | Chemical carcinogenesis - reactive oxygen species | 168/4205 | 223/8465 | 1.83e-15 | 6.81e-14 | 3.49e-14 | 168 |
| hsa05418211 | Esophagus | ESCC | Fluid shear stress and atherosclerosis | 109/4205 | 139/8465 | 2.00e-12 | 3.72e-11 | 1.90e-11 | 109 |
| hsa0522518 | Esophagus | ESCC | Hepatocellular carcinoma | 109/4205 | 168/8465 | 4.27e-05 | 1.88e-04 | 9.64e-05 | 109 |
| hsa0412036 | Esophagus | ESCC | Ubiquitin mediated proteolysis | 122/4205 | 142/8465 | 6.53e-20 | 7.29e-18 | 3.74e-18 | 122 |
| hsa05012310 | Esophagus | ESCC | Parkinson disease | 201/4205 | 266/8465 | 1.56e-18 | 8.72e-17 | 4.46e-17 | 201 |
| hsa05208310 | Esophagus | ESCC | Chemical carcinogenesis - reactive oxygen species | 168/4205 | 223/8465 | 1.83e-15 | 6.81e-14 | 3.49e-14 | 168 |
| hsa05418310 | Esophagus | ESCC | Fluid shear stress and atherosclerosis | 109/4205 | 139/8465 | 2.00e-12 | 3.72e-11 | 1.90e-11 | 109 |
| hsa0522519 | Esophagus | ESCC | Hepatocellular carcinoma | 109/4205 | 168/8465 | 4.27e-05 | 1.88e-04 | 9.64e-05 | 109 |
| hsa0501214 | Liver | Cirrhotic | Parkinson disease | 158/2530 | 266/8465 | 3.62e-24 | 6.02e-22 | 3.71e-22 | 158 |
| hsa0520822 | Liver | Cirrhotic | Chemical carcinogenesis - reactive oxygen species | 121/2530 | 223/8465 | 1.35e-14 | 4.08e-13 | 2.52e-13 | 121 |
| Page: 1 2 3 |
Top |
Cell-cell communication analysis |
| Identification of potential cell-cell interactions between two cell types and their ligand-receptor pairs for different disease states |
| Ligand | Receptor | LRpair | Pathway | Tissue | Disease Stage |
| Page: 1 |
Top |
Single-cell gene regulatory network inference analysis |
| Find out the significant the regulons (TFs) and the target genes of each regulon across cell types for different disease states |
| TF | Cell Type | Tissue | Disease Stage | Target Gene | RSS | Regulon Activity |
| ∗The dot plots of a searched regulon are shown for all cell subpopulations in each disease state of each tissue based on the regulon specific score inferred using pySCENIC and by calculating the average expression. |
| Page: 1 |
Top |
Somatic mutation of malignant transformation related genes |
| Annotation of somatic variants for genes involved in malignant transformation |
| Hugo Symbol | Variant Class | Variant Classification | dbSNP RS | HGVSc | HGVSp | HGVSp Short | SWISSPROT | BIOTYPE | SIFT | PolyPhen | Tumor Sample Barcode | Tissue | Histology | Sex | Age | Stage | Therapy Types | Drugs | Outcome |
| KEAP1 | SNV | Missense_Mutation | rs752325770 | c.493N>A | p.Asp165Asn | p.D165N | Q14145 | protein_coding | tolerated(0.53) | benign(0.089) | TCGA-AN-A046-01 | Breast | breast invasive carcinoma | Female | >=65 | I/II | Unknown | Unknown | SD |
| KEAP1 | insertion | In_Frame_Ins | novel | c.1818_1819insAATTCCTGGGCTCAAGTGATCCTCCCACCTCAGCCTCCT | p.Val606_Ala607insAsnSerTrpAlaGlnValIleLeuProProGlnProPro | p.V606_A607insNSWAQVILPPQPP | Q14145 | protein_coding | TCGA-A2-A0EO-01 | Breast | breast invasive carcinoma | Female | <65 | I/II | Hormone Therapy | tamoxiphen | SD | ||
| KEAP1 | SNV | Missense_Mutation | c.700N>T | p.Arg234Trp | p.R234W | Q14145 | protein_coding | deleterious(0) | probably_damaging(0.94) | TCGA-JW-A5VK-01 | Cervix | cervical & endocervical cancer | Female | <65 | I/II | Unknown | Unknown | SD | |
| KEAP1 | SNV | Missense_Mutation | c.239N>T | p.Thr80Ile | p.T80I | Q14145 | protein_coding | tolerated(0.17) | possibly_damaging(0.489) | TCGA-A6-2686-01 | Colorectum | colon adenocarcinoma | Female | >=65 | I/II | Unknown | Unknown | SD | |
| KEAP1 | SNV | Missense_Mutation | c.373N>G | p.Ile125Val | p.I125V | Q14145 | protein_coding | deleterious(0.04) | possibly_damaging(0.672) | TCGA-AA-3715-01 | Colorectum | colon adenocarcinoma | Male | >=65 | I/II | Unknown | Unknown | PD | |
| KEAP1 | SNV | Missense_Mutation | novel | c.1509G>T | p.Met503Ile | p.M503I | Q14145 | protein_coding | deleterious(0.01) | probably_damaging(0.984) | TCGA-AA-3984-01 | Colorectum | colon adenocarcinoma | Female | <65 | I/II | Unknown | Unknown | SD |
| KEAP1 | SNV | Missense_Mutation | novel | c.667N>A | p.Leu223Met | p.L223M | Q14145 | protein_coding | deleterious(0) | probably_damaging(0.975) | TCGA-AZ-6601-01 | Colorectum | colon adenocarcinoma | Male | >=65 | I/II | Unknown | Unknown | PD |
| KEAP1 | SNV | Missense_Mutation | rs752325770 | c.493N>A | p.Asp165Asn | p.D165N | Q14145 | protein_coding | tolerated(0.53) | benign(0.089) | TCGA-CM-6674-01 | Colorectum | colon adenocarcinoma | Male | <65 | I/II | Unknown | Unknown | SD |
| KEAP1 | SNV | Missense_Mutation | c.1525G>A | p.Gly509Arg | p.G509R | Q14145 | protein_coding | deleterious(0.03) | probably_damaging(1) | TCGA-A5-A0G2-01 | Endometrium | uterine corpus endometrioid carcinoma | Female | <65 | III/IV | Unknown | Unknown | SD | |
| KEAP1 | SNV | Missense_Mutation | novel | c.1013N>T | p.Ser338Leu | p.S338L | Q14145 | protein_coding | deleterious(0) | probably_damaging(0.999) | TCGA-A5-A1OF-01 | Endometrium | uterine corpus endometrioid carcinoma | Female | <65 | I/II | Unknown | Unknown | SD |
| Page: 1 2 3 4 5 6 7 8 9 10 11 12 13 14 15 16 17 18 19 20 21 22 23 |
Top |
Related drugs of malignant transformation related genes |
| Identification of chemicals and drugs interact with genes involved in malignant transfromation |
| (DGIdb 4.0) |
| Entrez ID | Symbol | Category | Interaction Types | Drug Claim Name | Drug Name | PMIDs |
| 9817 | KEAP1 | ENZYME, CLINICALLY ACTIONABLE, DRUGGABLE GENOME, TRANSCRIPTION FACTOR BINDING | inhibitor | CHEMBL1762621 | BARDOXOLONE METHYL | |
| 9817 | KEAP1 | ENZYME, CLINICALLY ACTIONABLE, DRUGGABLE GENOME, TRANSCRIPTION FACTOR BINDING | inhibitor | 252827430 | ||
| 9817 | KEAP1 | ENZYME, CLINICALLY ACTIONABLE, DRUGGABLE GENOME, TRANSCRIPTION FACTOR BINDING | 135650061 | BARDOXOLONE | ||
| 9817 | KEAP1 | ENZYME, CLINICALLY ACTIONABLE, DRUGGABLE GENOME, TRANSCRIPTION FACTOR BINDING | inhibitor | CHEMBL2107333 | DIMETHYL FUMARATE | |
| 9817 | KEAP1 | ENZYME, CLINICALLY ACTIONABLE, DRUGGABLE GENOME, TRANSCRIPTION FACTOR BINDING | 385612246 | |||
| 9817 | KEAP1 | ENZYME, CLINICALLY ACTIONABLE, DRUGGABLE GENOME, TRANSCRIPTION FACTOR BINDING | 385612247 | |||
| 9817 | KEAP1 | ENZYME, CLINICALLY ACTIONABLE, DRUGGABLE GENOME, TRANSCRIPTION FACTOR BINDING | DIMETHYL FUMARATE | DIMETHYL FUMARATE | 23647822 | |
| 9817 | KEAP1 | ENZYME, CLINICALLY ACTIONABLE, DRUGGABLE GENOME, TRANSCRIPTION FACTOR BINDING | 348353669 | |||
| 9817 | KEAP1 | ENZYME, CLINICALLY ACTIONABLE, DRUGGABLE GENOME, TRANSCRIPTION FACTOR BINDING | 375973258 |
| Page: 1 |

Copyright 2023-Present -The University of Texas Health Science Center at Houston |