
|
|||||
|
 | |
| |
| |
| |
| |
| |
|
Gene: KDSR |
Gene summary for KDSR |
| Gene information | Species | Human | Gene symbol | KDSR | Gene ID | 2531 |
| Gene name | 3-ketodihydrosphingosine reductase | |
| Gene Alias | DHSR | |
| Cytomap | 18q21.33 | |
| Gene Type | protein-coding | GO ID | GO:0006629 | UniProtAcc | A0A024R292 |
Top |
Malignant transformation analysis |
| Identification of the aberrant gene expression in precancerous and cancerous lesions by comparing the gene expression of stem-like cells in diseased tissues with normal stem cells |
| Entrez ID | Symbol | Replicates | Species | Organ | Tissue | Adj P-value | Log2FC | Malignancy |
| 2531 | KDSR | HTA11_347_2000001011 | Human | Colorectum | AD | 3.03e-02 | 1.94e-01 | -0.1954 |
| 2531 | KDSR | HTA11_99999970781_79442 | Human | Colorectum | MSS | 2.07e-07 | 5.23e-01 | 0.294 |
| 2531 | KDSR | HTA11_99999965104_69814 | Human | Colorectum | MSS | 1.16e-05 | 5.43e-01 | 0.281 |
| 2531 | KDSR | A015-C-203 | Human | Colorectum | FAP | 1.95e-09 | -1.83e-01 | -0.1294 |
| 2531 | KDSR | A001-C-108 | Human | Colorectum | FAP | 1.33e-02 | -1.49e-01 | -0.0272 |
| 2531 | KDSR | A002-C-205 | Human | Colorectum | FAP | 3.56e-03 | -1.57e-01 | -0.1236 |
| 2531 | KDSR | A002-C-114 | Human | Colorectum | FAP | 3.01e-03 | -2.02e-01 | -0.1561 |
| 2531 | KDSR | A015-C-104 | Human | Colorectum | FAP | 8.81e-07 | -1.78e-01 | -0.1899 |
| 2531 | KDSR | A002-C-016 | Human | Colorectum | FAP | 1.34e-02 | -1.50e-01 | 0.0521 |
| 2531 | KDSR | A002-C-116 | Human | Colorectum | FAP | 8.72e-08 | -1.61e-01 | -0.0452 |
| 2531 | KDSR | A014-C-008 | Human | Colorectum | FAP | 1.40e-02 | -2.34e-01 | -0.191 |
| 2531 | KDSR | A018-E-020 | Human | Colorectum | FAP | 2.90e-02 | -1.44e-01 | -0.2034 |
| 2531 | KDSR | F034 | Human | Colorectum | FAP | 3.47e-03 | -1.08e-01 | -0.0665 |
| 2531 | KDSR | CRC-3-11773 | Human | Colorectum | CRC | 2.13e-02 | -1.29e-01 | 0.2564 |
| 2531 | KDSR | LZE4T | Human | Esophagus | ESCC | 2.29e-06 | -9.03e-02 | 0.0811 |
| 2531 | KDSR | LZE5T | Human | Esophagus | ESCC | 4.03e-02 | -2.78e-01 | 0.0514 |
| 2531 | KDSR | LZE8T | Human | Esophagus | ESCC | 2.22e-07 | -2.70e-01 | 0.067 |
| 2531 | KDSR | LZE20T | Human | Esophagus | ESCC | 4.73e-08 | -1.09e-01 | 0.0662 |
| 2531 | KDSR | LZE22T | Human | Esophagus | ESCC | 2.59e-03 | -1.62e-01 | 0.068 |
| 2531 | KDSR | LZE24T | Human | Esophagus | ESCC | 4.27e-11 | 4.61e-01 | 0.0596 |
| Page: 1 2 3 4 5 6 7 |
| Tissue | Expression Dynamics | Abbreviation |
| Colorectum (GSE201348) |  | FAP: Familial adenomatous polyposis |
| CRC: Colorectal cancer | ||
| Colorectum (HTA11) |  | AD: Adenomas |
| SER: Sessile serrated lesions | ||
| MSI-H: Microsatellite-high colorectal cancer | ||
| MSS: Microsatellite stable colorectal cancer | ||
| Esophagus |  | ESCC: Esophageal squamous cell carcinoma |
| HGIN: High-grade intraepithelial neoplasias | ||
| LGIN: Low-grade intraepithelial neoplasias | ||
| Liver | 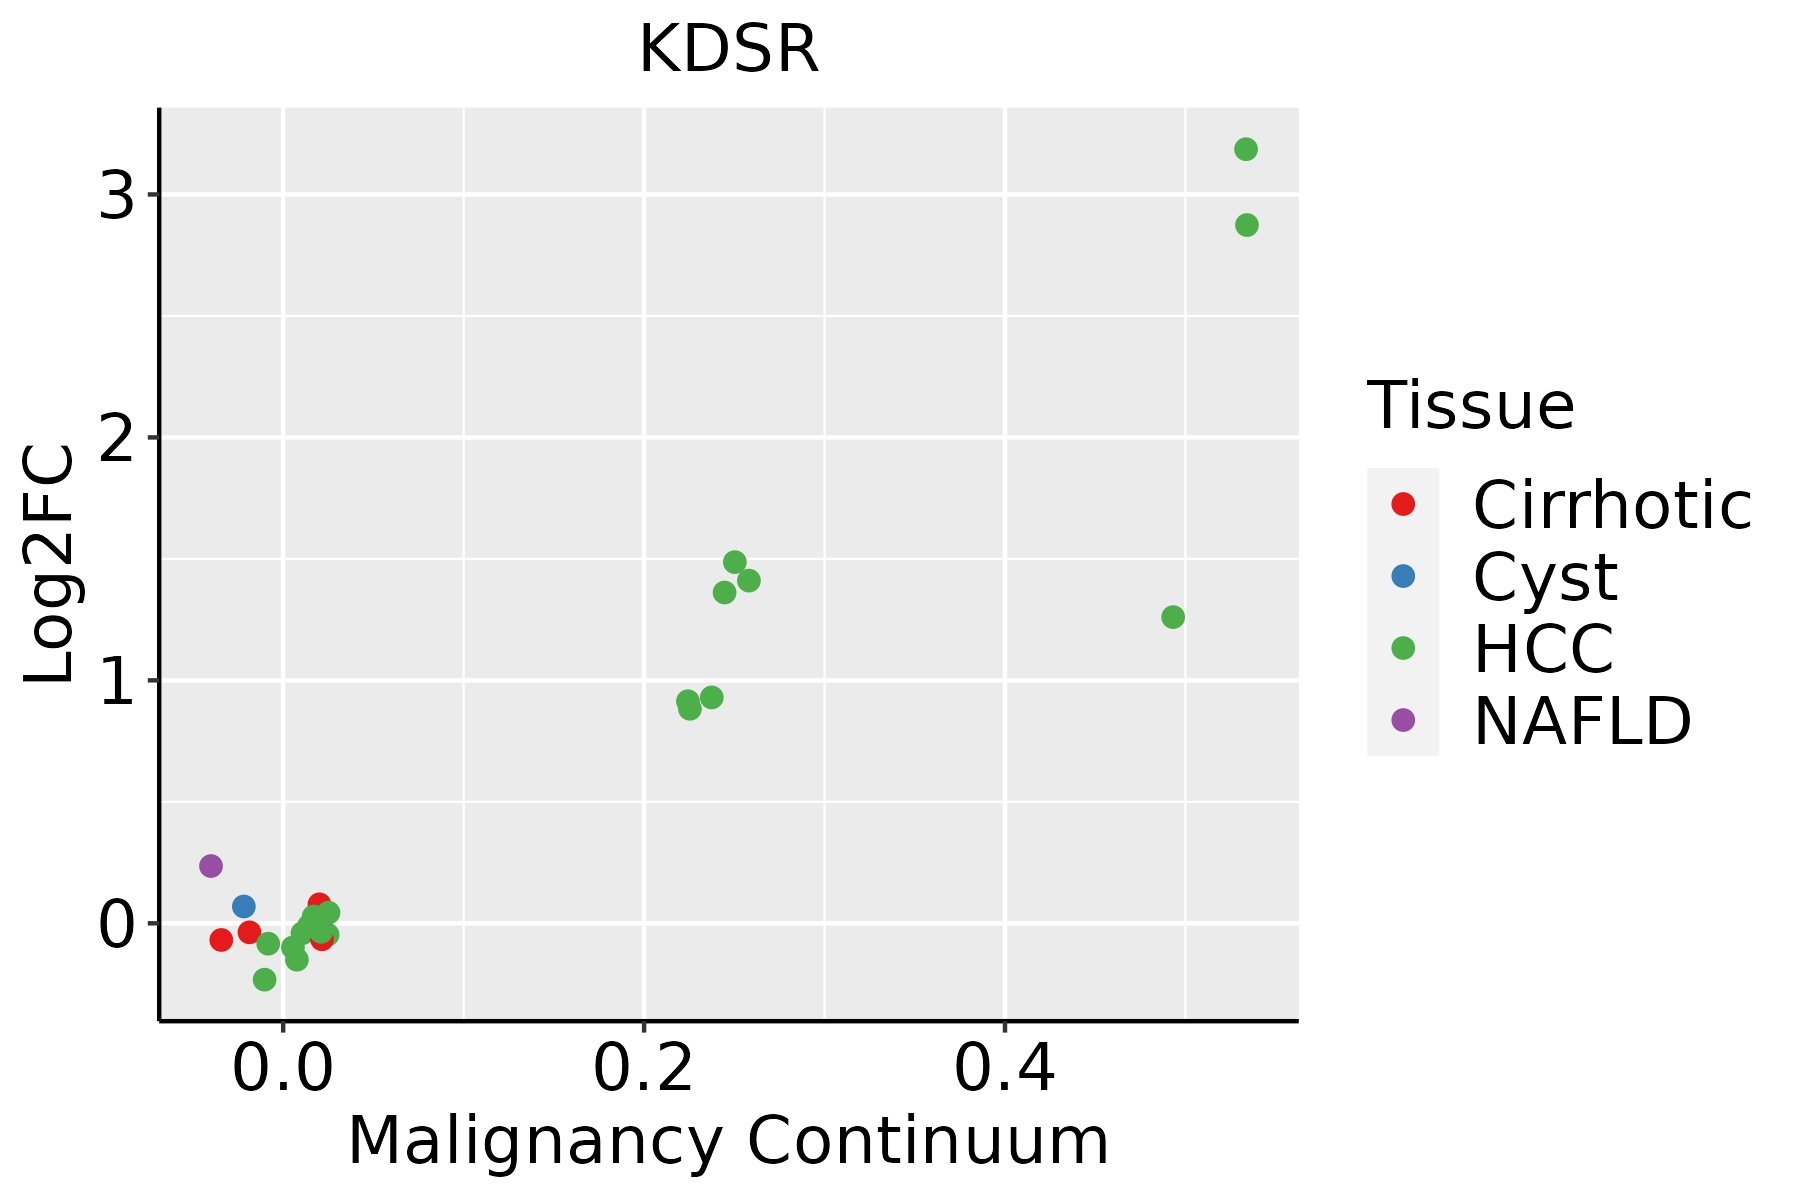 | HCC: Hepatocellular carcinoma |
| NAFLD: Non-alcoholic fatty liver disease | ||
| Oral Cavity | 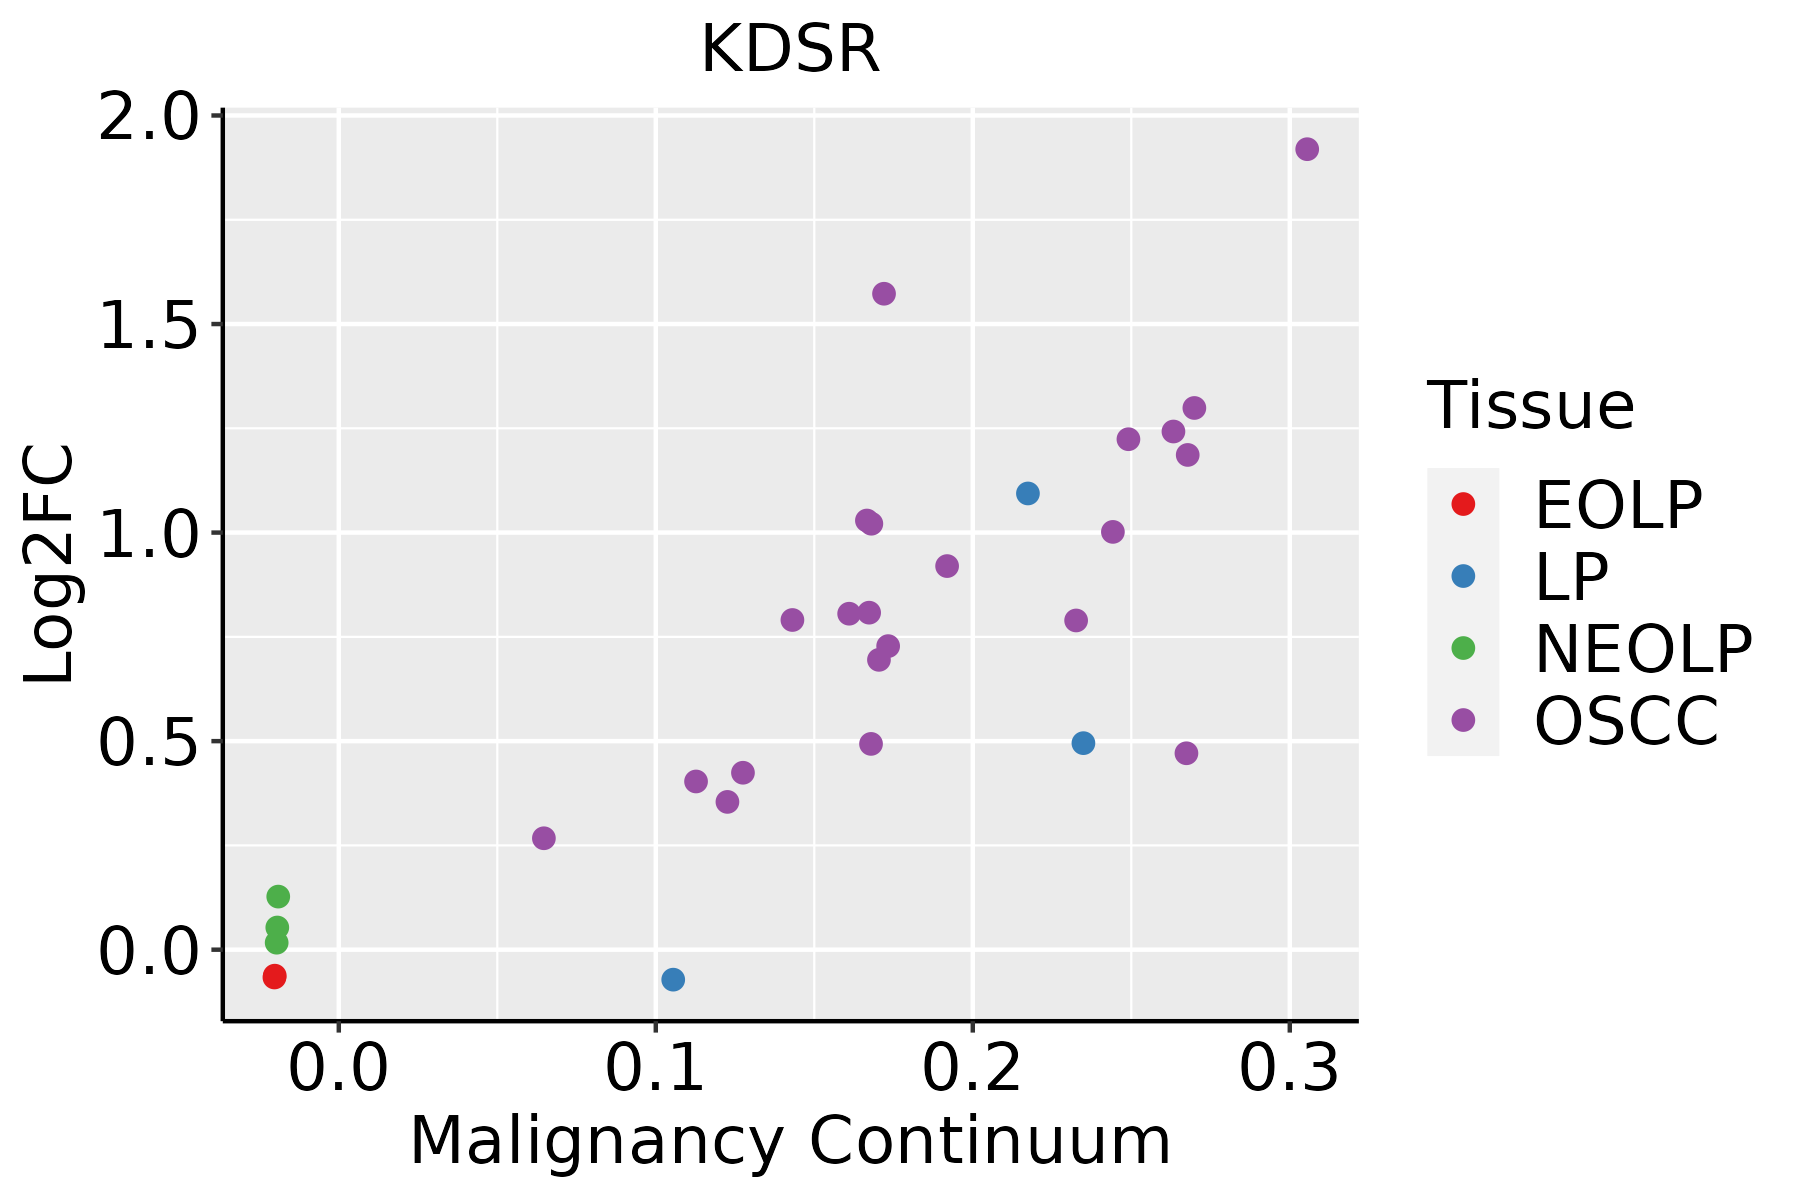 | EOLP: Erosive Oral lichen planus |
| LP: leukoplakia | ||
| NEOLP: Non-erosive oral lichen planus | ||
| OSCC: Oral squamous cell carcinoma | ||
| Skin | 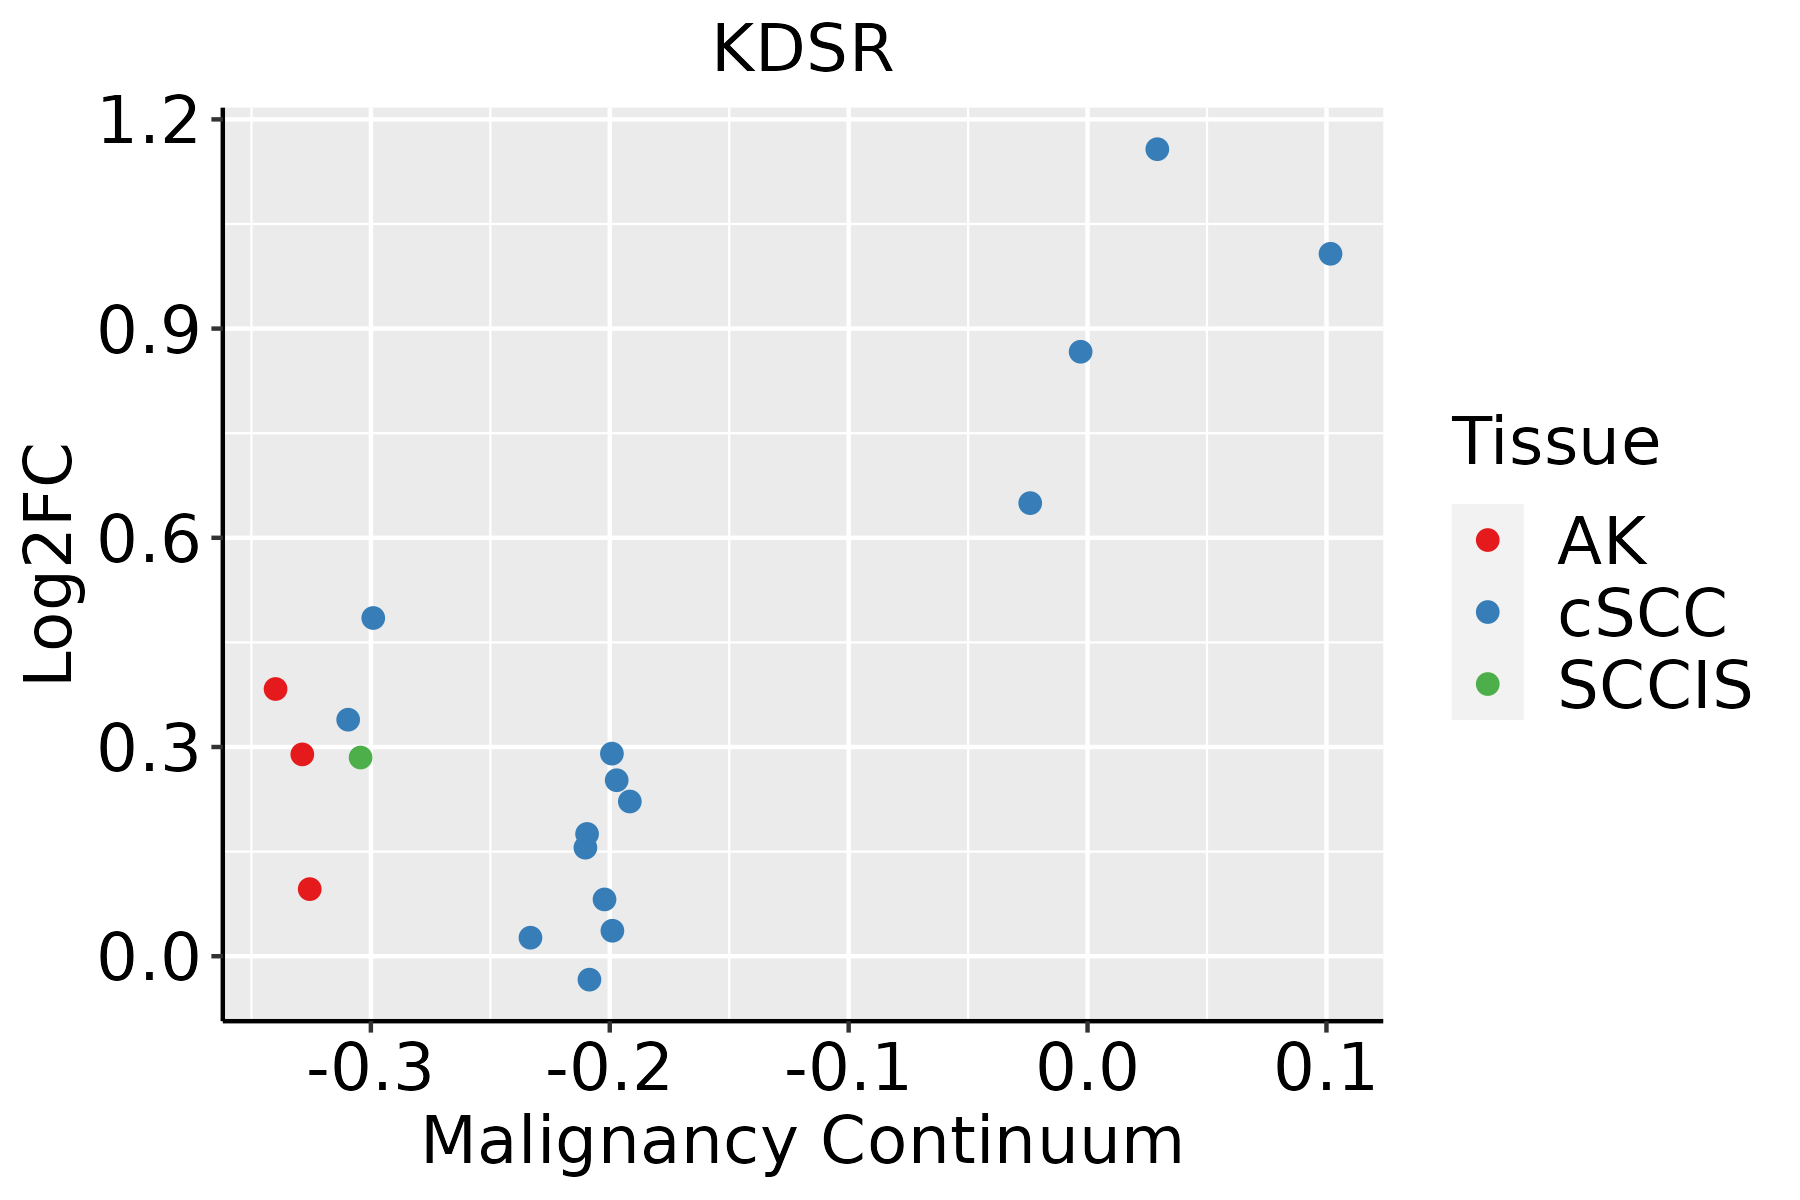 | AK: Actinic keratosis |
| cSCC: Cutaneous squamous cell carcinoma | ||
| SCCIS:squamous cell carcinoma in situ | ||
| Thyroid |  | ATC: Anaplastic thyroid cancer |
| HT: Hashimoto's thyroiditis | ||
| PTC: Papillary thyroid cancer |
| ∗log2FC in expression of this searched gene in stem-like cells from each diseased tissue sample relative to stem-like cells in normal samples in each tissue plotted against the malignancy continuum. Samples are colored based on if they are from different disease stage. |
Top |
Malignant transformation related pathway analysis |
| Find out the enriched GO biological processes and KEGG pathways involved in transition from healthy to precancer to cancer |
| Tissue | Disease Stage | Enriched GO biological Processes |
| Colorectum | AD |  |
| Colorectum | SER |  |
| Colorectum | MSS |  |
| Colorectum | MSI-H |  |
| Colorectum | FAP |  |
| ∗Top 15 enriched GO BP terms are showed in the bar plot of each disease state in each tissue. Each row represents a significant GO biological process which is colored according to the -log10(p.adjust). |
| Page: 1 2 3 4 5 6 7 8 9 |
| GO ID | Tissue | Disease Stage | Description | Gene Ratio | Bg Ratio | pvalue | p.adjust | Count |
| GO:0046519 | Colorectum | FAP | sphingoid metabolic process | 8/2622 | 21/18723 | 5.43e-03 | 3.53e-02 | 8 |
| GO:00465191 | Colorectum | CRC | sphingoid metabolic process | 7/2078 | 21/18723 | 5.85e-03 | 4.32e-02 | 7 |
| GO:00066433 | Esophagus | ESCC | membrane lipid metabolic process | 130/8552 | 203/18723 | 9.29e-08 | 1.54e-06 | 130 |
| GO:00464673 | Esophagus | ESCC | membrane lipid biosynthetic process | 91/8552 | 142/18723 | 7.19e-06 | 7.19e-05 | 91 |
| GO:00066652 | Esophagus | ESCC | sphingolipid metabolic process | 96/8552 | 155/18723 | 3.21e-05 | 2.66e-04 | 96 |
| GO:00421805 | Esophagus | ESCC | cellular ketone metabolic process | 120/8552 | 211/18723 | 6.70e-04 | 3.55e-03 | 120 |
| GO:00301481 | Esophagus | ESCC | sphingolipid biosynthetic process | 62/8552 | 103/18723 | 2.10e-03 | 9.38e-03 | 62 |
| GO:004218011 | Liver | Cirrhotic | cellular ketone metabolic process | 80/4634 | 211/18723 | 1.40e-05 | 1.95e-04 | 80 |
| GO:0006643 | Liver | Cirrhotic | membrane lipid metabolic process | 69/4634 | 203/18723 | 1.89e-03 | 1.19e-02 | 69 |
| GO:004218021 | Liver | HCC | cellular ketone metabolic process | 123/7958 | 211/18723 | 2.52e-06 | 3.37e-05 | 123 |
| GO:00066431 | Liver | HCC | membrane lipid metabolic process | 115/7958 | 203/18723 | 3.17e-05 | 3.22e-04 | 115 |
| GO:0006665 | Liver | HCC | sphingolipid metabolic process | 85/7958 | 155/18723 | 1.27e-03 | 6.92e-03 | 85 |
| GO:0046467 | Liver | HCC | membrane lipid biosynthetic process | 78/7958 | 142/18723 | 1.85e-03 | 9.46e-03 | 78 |
| GO:00066432 | Oral cavity | OSCC | membrane lipid metabolic process | 111/7305 | 203/18723 | 4.02e-06 | 4.69e-05 | 111 |
| GO:00421804 | Oral cavity | OSCC | cellular ketone metabolic process | 111/7305 | 211/18723 | 3.94e-05 | 3.45e-04 | 111 |
| GO:00066651 | Oral cavity | OSCC | sphingolipid metabolic process | 84/7305 | 155/18723 | 8.64e-05 | 6.61e-04 | 84 |
| GO:00464672 | Oral cavity | OSCC | membrane lipid biosynthetic process | 77/7305 | 142/18723 | 1.63e-04 | 1.13e-03 | 77 |
| GO:0030148 | Oral cavity | OSCC | sphingolipid biosynthetic process | 53/7305 | 103/18723 | 6.81e-03 | 2.53e-02 | 53 |
| GO:000664311 | Oral cavity | LP | membrane lipid metabolic process | 69/4623 | 203/18723 | 1.77e-03 | 1.34e-02 | 69 |
| GO:004218012 | Oral cavity | LP | cellular ketone metabolic process | 70/4623 | 211/18723 | 3.29e-03 | 2.21e-02 | 70 |
| Page: 1 2 |
| Pathway ID | Tissue | Disease Stage | Description | Gene Ratio | Bg Ratio | pvalue | p.adjust | qvalue | Count |
| hsa006003 | Esophagus | ESCC | Sphingolipid metabolism | 36/4205 | 53/8465 | 5.41e-03 | 1.36e-02 | 6.99e-03 | 36 |
| hsa0060012 | Esophagus | ESCC | Sphingolipid metabolism | 36/4205 | 53/8465 | 5.41e-03 | 1.36e-02 | 6.99e-03 | 36 |
| hsa00600 | Liver | HCC | Sphingolipid metabolism | 34/4020 | 53/8465 | 1.06e-02 | 2.71e-02 | 1.51e-02 | 34 |
| hsa006001 | Liver | HCC | Sphingolipid metabolism | 34/4020 | 53/8465 | 1.06e-02 | 2.71e-02 | 1.51e-02 | 34 |
| hsa006002 | Oral cavity | OSCC | Sphingolipid metabolism | 33/3704 | 53/8465 | 5.00e-03 | 1.20e-02 | 6.13e-03 | 33 |
| hsa0060011 | Oral cavity | OSCC | Sphingolipid metabolism | 33/3704 | 53/8465 | 5.00e-03 | 1.20e-02 | 6.13e-03 | 33 |
| Page: 1 |
Top |
Cell-cell communication analysis |
| Identification of potential cell-cell interactions between two cell types and their ligand-receptor pairs for different disease states |
| Ligand | Receptor | LRpair | Pathway | Tissue | Disease Stage |
| Page: 1 |
Top |
Single-cell gene regulatory network inference analysis |
| Find out the significant the regulons (TFs) and the target genes of each regulon across cell types for different disease states |
| TF | Cell Type | Tissue | Disease Stage | Target Gene | RSS | Regulon Activity |
| ∗The dot plots of a searched regulon are shown for all cell subpopulations in each disease state of each tissue based on the regulon specific score inferred using pySCENIC and by calculating the average expression. |
| Page: 1 |
Top |
Somatic mutation of malignant transformation related genes |
| Annotation of somatic variants for genes involved in malignant transformation |
| Hugo Symbol | Variant Class | Variant Classification | dbSNP RS | HGVSc | HGVSp | HGVSp Short | SWISSPROT | BIOTYPE | SIFT | PolyPhen | Tumor Sample Barcode | Tissue | Histology | Sex | Age | Stage | Therapy Types | Drugs | Outcome |
| KDSR | insertion | Frame_Shift_Ins | novel | c.364_365insTGCGCCGTCTAGACAGACTTTCCCTTAAACCTCT | p.Ala122ValfsTer21 | p.A122Vfs*21 | Q06136 | protein_coding | TCGA-AN-A0AL-01 | Breast | breast invasive carcinoma | Female | <65 | III/IV | Unknown | Unknown | SD | ||
| KDSR | SNV | Missense_Mutation | c.219N>C | p.Lys73Asn | p.K73N | Q06136 | protein_coding | deleterious(0.01) | possibly_damaging(0.624) | TCGA-EK-A2PG-01 | Cervix | cervical & endocervical cancer | Female | >=65 | I/II | Unknown | Unknown | SD | |
| KDSR | SNV | Missense_Mutation | rs750015953 | c.901N>T | p.Arg301Cys | p.R301C | Q06136 | protein_coding | deleterious(0) | probably_damaging(1) | TCGA-AA-3833-01 | Colorectum | colon adenocarcinoma | Female | <65 | I/II | Unknown | Unknown | SD |
| KDSR | SNV | Missense_Mutation | rs141264328 | c.902N>A | p.Arg301His | p.R301H | Q06136 | protein_coding | deleterious(0) | probably_damaging(0.999) | TCGA-AY-A69D-01 | Colorectum | colon adenocarcinoma | Female | <65 | I/II | Unknown | Unknown | SD |
| KDSR | SNV | Missense_Mutation | c.827C>T | p.Ala276Val | p.A276V | Q06136 | protein_coding | tolerated(0.54) | benign(0.003) | TCGA-F4-6703-01 | Colorectum | colon adenocarcinoma | Male | <65 | I/II | Unknown | Unknown | SD | |
| KDSR | SNV | Missense_Mutation | novel | c.284C>T | p.Ser95Phe | p.S95F | Q06136 | protein_coding | deleterious(0) | possibly_damaging(0.886) | TCGA-A5-A0G2-01 | Endometrium | uterine corpus endometrioid carcinoma | Female | <65 | III/IV | Unknown | Unknown | SD |
| KDSR | SNV | Missense_Mutation | rs768170793 | c.487C>T | p.Arg163Cys | p.R163C | Q06136 | protein_coding | deleterious(0) | probably_damaging(0.996) | TCGA-AJ-A3BG-01 | Endometrium | uterine corpus endometrioid carcinoma | Female | >=65 | I/II | Chemotherapy | carboplatin | PD |
| KDSR | SNV | Missense_Mutation | novel | c.299A>G | p.Gln100Arg | p.Q100R | Q06136 | protein_coding | tolerated(0.28) | benign(0.267) | TCGA-AP-A0LM-01 | Endometrium | uterine corpus endometrioid carcinoma | Female | <65 | III/IV | Chemotherapy | cisplatin | SD |
| KDSR | SNV | Missense_Mutation | c.193A>C | p.Asn65His | p.N65H | Q06136 | protein_coding | deleterious(0) | probably_damaging(0.917) | TCGA-AX-A05Z-01 | Endometrium | uterine corpus endometrioid carcinoma | Female | <65 | III/IV | Chemotherapy | adriamycin | SD | |
| KDSR | SNV | Missense_Mutation | c.818N>C | p.Met273Thr | p.M273T | Q06136 | protein_coding | deleterious(0) | possibly_damaging(0.526) | TCGA-B5-A0JR-01 | Endometrium | uterine corpus endometrioid carcinoma | Female | >=65 | I/II | Unknown | Unknown | SD |
| Page: 1 2 3 |
Top |
Related drugs of malignant transformation related genes |
| Identification of chemicals and drugs interact with genes involved in malignant transfromation |
| (DGIdb 4.0) |
| Entrez ID | Symbol | Category | Interaction Types | Drug Claim Name | Drug Name | PMIDs |
| Page: 1 |

Copyright 2023-Present -The University of Texas Health Science Center at Houston |