
|
|||||
|
 | |
| |
| |
| |
| |
| |
|
Gene: KDM7A |
Gene summary for KDM7A |
| Gene information | Species | Human | Gene symbol | KDM7A | Gene ID | 80853 |
| Gene name | lysine demethylase 7A | |
| Gene Alias | JHDM1D | |
| Cytomap | 7q34 | |
| Gene Type | protein-coding | GO ID | GO:0006139 | UniProtAcc | Q6ZMT4 |
Top |
Malignant transformation analysis |
| Identification of the aberrant gene expression in precancerous and cancerous lesions by comparing the gene expression of stem-like cells in diseased tissues with normal stem cells |
| Entrez ID | Symbol | Replicates | Species | Organ | Tissue | Adj P-value | Log2FC | Malignancy |
| 80853 | KDM7A | HTA11_3410_2000001011 | Human | Colorectum | AD | 3.65e-10 | -5.09e-01 | 0.0155 |
| 80853 | KDM7A | HTA11_2951_2000001011 | Human | Colorectum | AD | 1.42e-02 | -6.58e-01 | 0.0216 |
| 80853 | KDM7A | HTA11_347_2000001011 | Human | Colorectum | AD | 1.25e-08 | 5.43e-01 | -0.1954 |
| 80853 | KDM7A | HTA11_866_3004761011 | Human | Colorectum | AD | 8.56e-04 | -4.58e-01 | 0.096 |
| 80853 | KDM7A | HTA11_8622_2000001021 | Human | Colorectum | SER | 3.47e-03 | -5.29e-01 | 0.0528 |
| 80853 | KDM7A | HTA11_99999965104_69814 | Human | Colorectum | MSS | 1.89e-12 | 8.31e-01 | 0.281 |
| 80853 | KDM7A | HTA11_99999971662_82457 | Human | Colorectum | MSS | 3.17e-02 | -3.26e-01 | 0.3859 |
| 80853 | KDM7A | HTA11_99999974143_84620 | Human | Colorectum | MSS | 4.15e-10 | -4.57e-01 | 0.3005 |
| 80853 | KDM7A | F007 | Human | Colorectum | FAP | 6.72e-03 | 1.24e-01 | 0.1176 |
| 80853 | KDM7A | A002-C-010 | Human | Colorectum | FAP | 2.48e-02 | -3.04e-02 | 0.242 |
| 80853 | KDM7A | A001-C-207 | Human | Colorectum | FAP | 4.09e-03 | 9.80e-02 | 0.1278 |
| 80853 | KDM7A | A015-C-203 | Human | Colorectum | FAP | 1.38e-32 | -5.32e-02 | -0.1294 |
| 80853 | KDM7A | A015-C-204 | Human | Colorectum | FAP | 3.79e-04 | 1.96e-02 | -0.0228 |
| 80853 | KDM7A | A014-C-040 | Human | Colorectum | FAP | 7.14e-04 | -2.30e-01 | -0.1184 |
| 80853 | KDM7A | A002-C-201 | Human | Colorectum | FAP | 3.45e-14 | -7.56e-02 | 0.0324 |
| 80853 | KDM7A | A002-C-203 | Human | Colorectum | FAP | 6.02e-11 | 2.52e-01 | 0.2786 |
| 80853 | KDM7A | A001-C-119 | Human | Colorectum | FAP | 3.56e-08 | -5.36e-03 | -0.1557 |
| 80853 | KDM7A | A001-C-108 | Human | Colorectum | FAP | 1.55e-24 | 2.62e-01 | -0.0272 |
| 80853 | KDM7A | A002-C-205 | Human | Colorectum | FAP | 2.54e-30 | 1.66e-01 | -0.1236 |
| 80853 | KDM7A | A001-C-104 | Human | Colorectum | FAP | 3.87e-11 | 2.54e-01 | 0.0184 |
| Page: 1 2 3 4 5 6 |
| Tissue | Expression Dynamics | Abbreviation |
| Colorectum (GSE201348) |  | FAP: Familial adenomatous polyposis |
| CRC: Colorectal cancer | ||
| Colorectum (HTA11) |  | AD: Adenomas |
| SER: Sessile serrated lesions | ||
| MSI-H: Microsatellite-high colorectal cancer | ||
| MSS: Microsatellite stable colorectal cancer | ||
| Esophagus |  | ESCC: Esophageal squamous cell carcinoma |
| HGIN: High-grade intraepithelial neoplasias | ||
| LGIN: Low-grade intraepithelial neoplasias | ||
| Liver |  | HCC: Hepatocellular carcinoma |
| NAFLD: Non-alcoholic fatty liver disease | ||
| Lung | 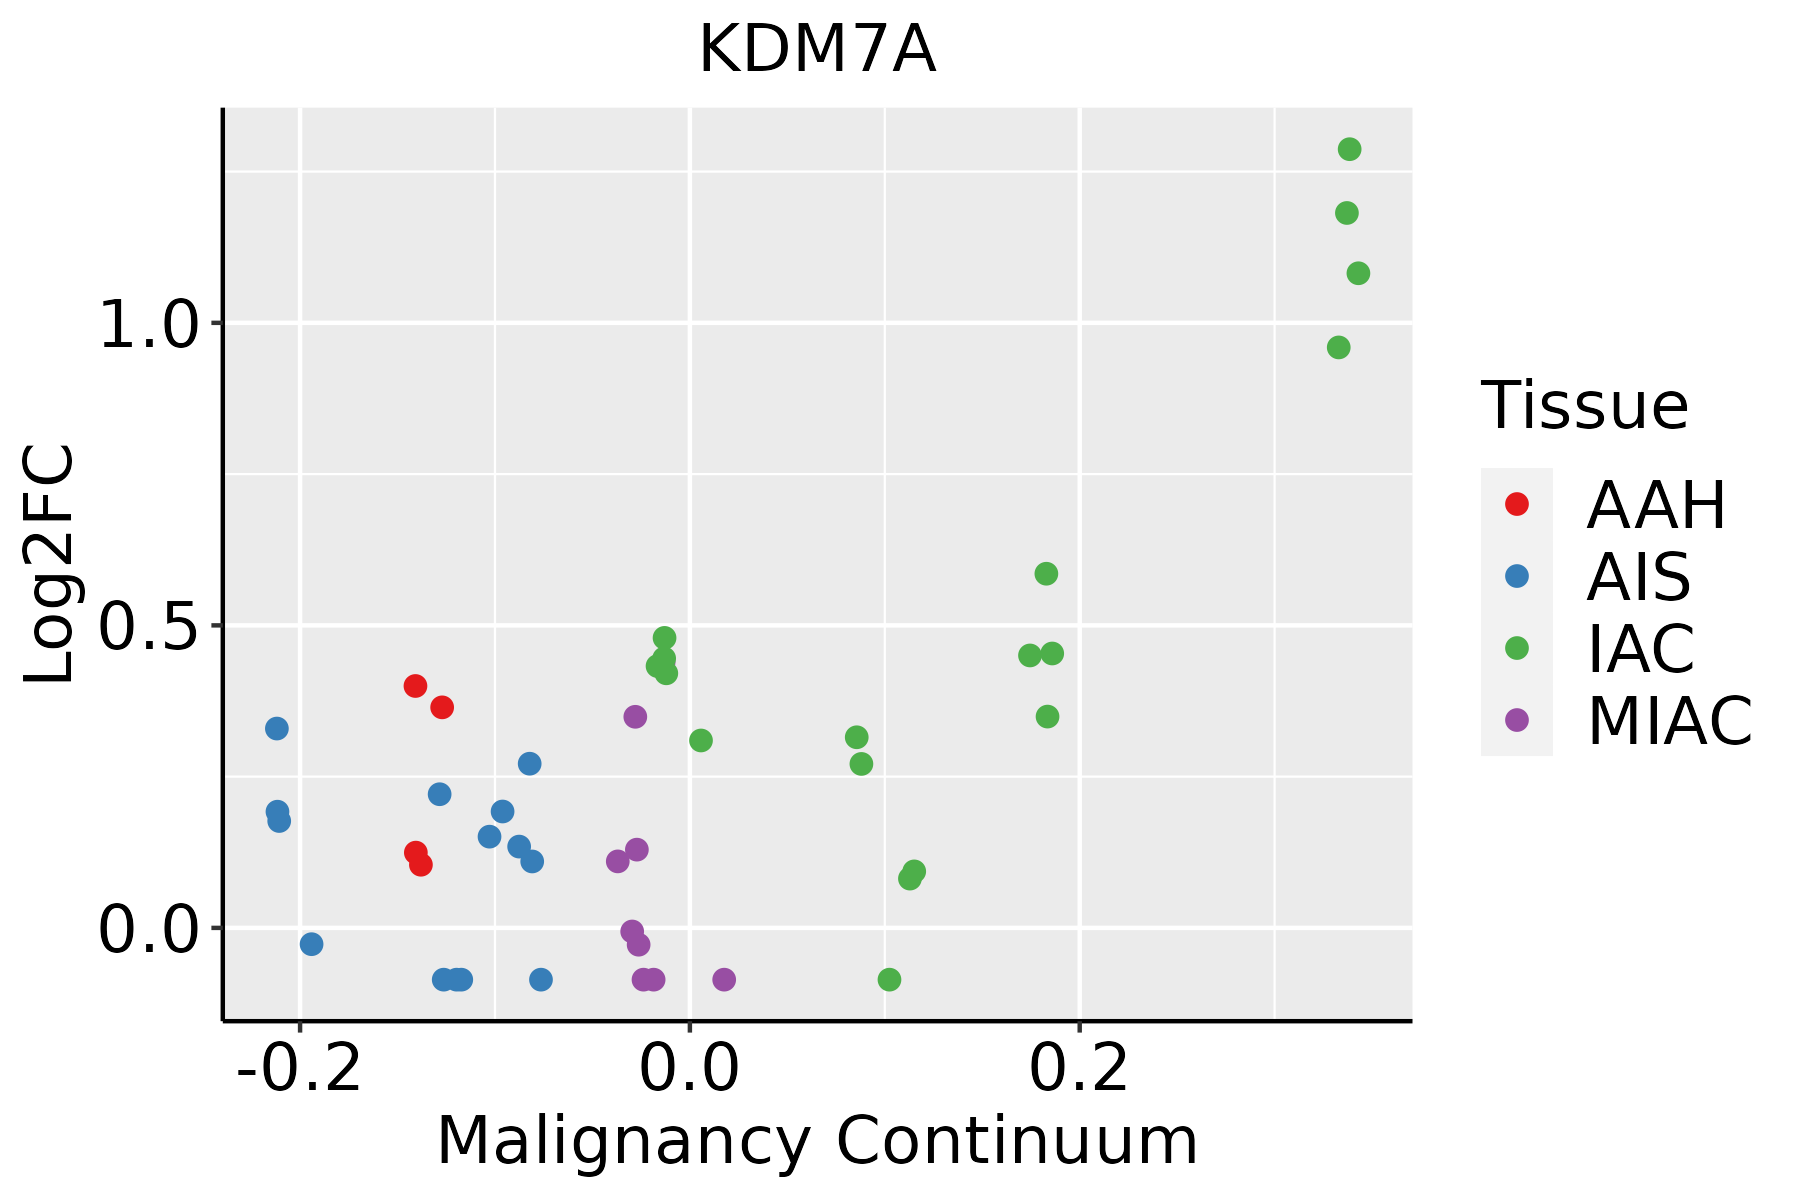 | AAH: Atypical adenomatous hyperplasia |
| AIS: Adenocarcinoma in situ | ||
| IAC: Invasive lung adenocarcinoma | ||
| MIA: Minimally invasive adenocarcinoma | ||
| Prostate | 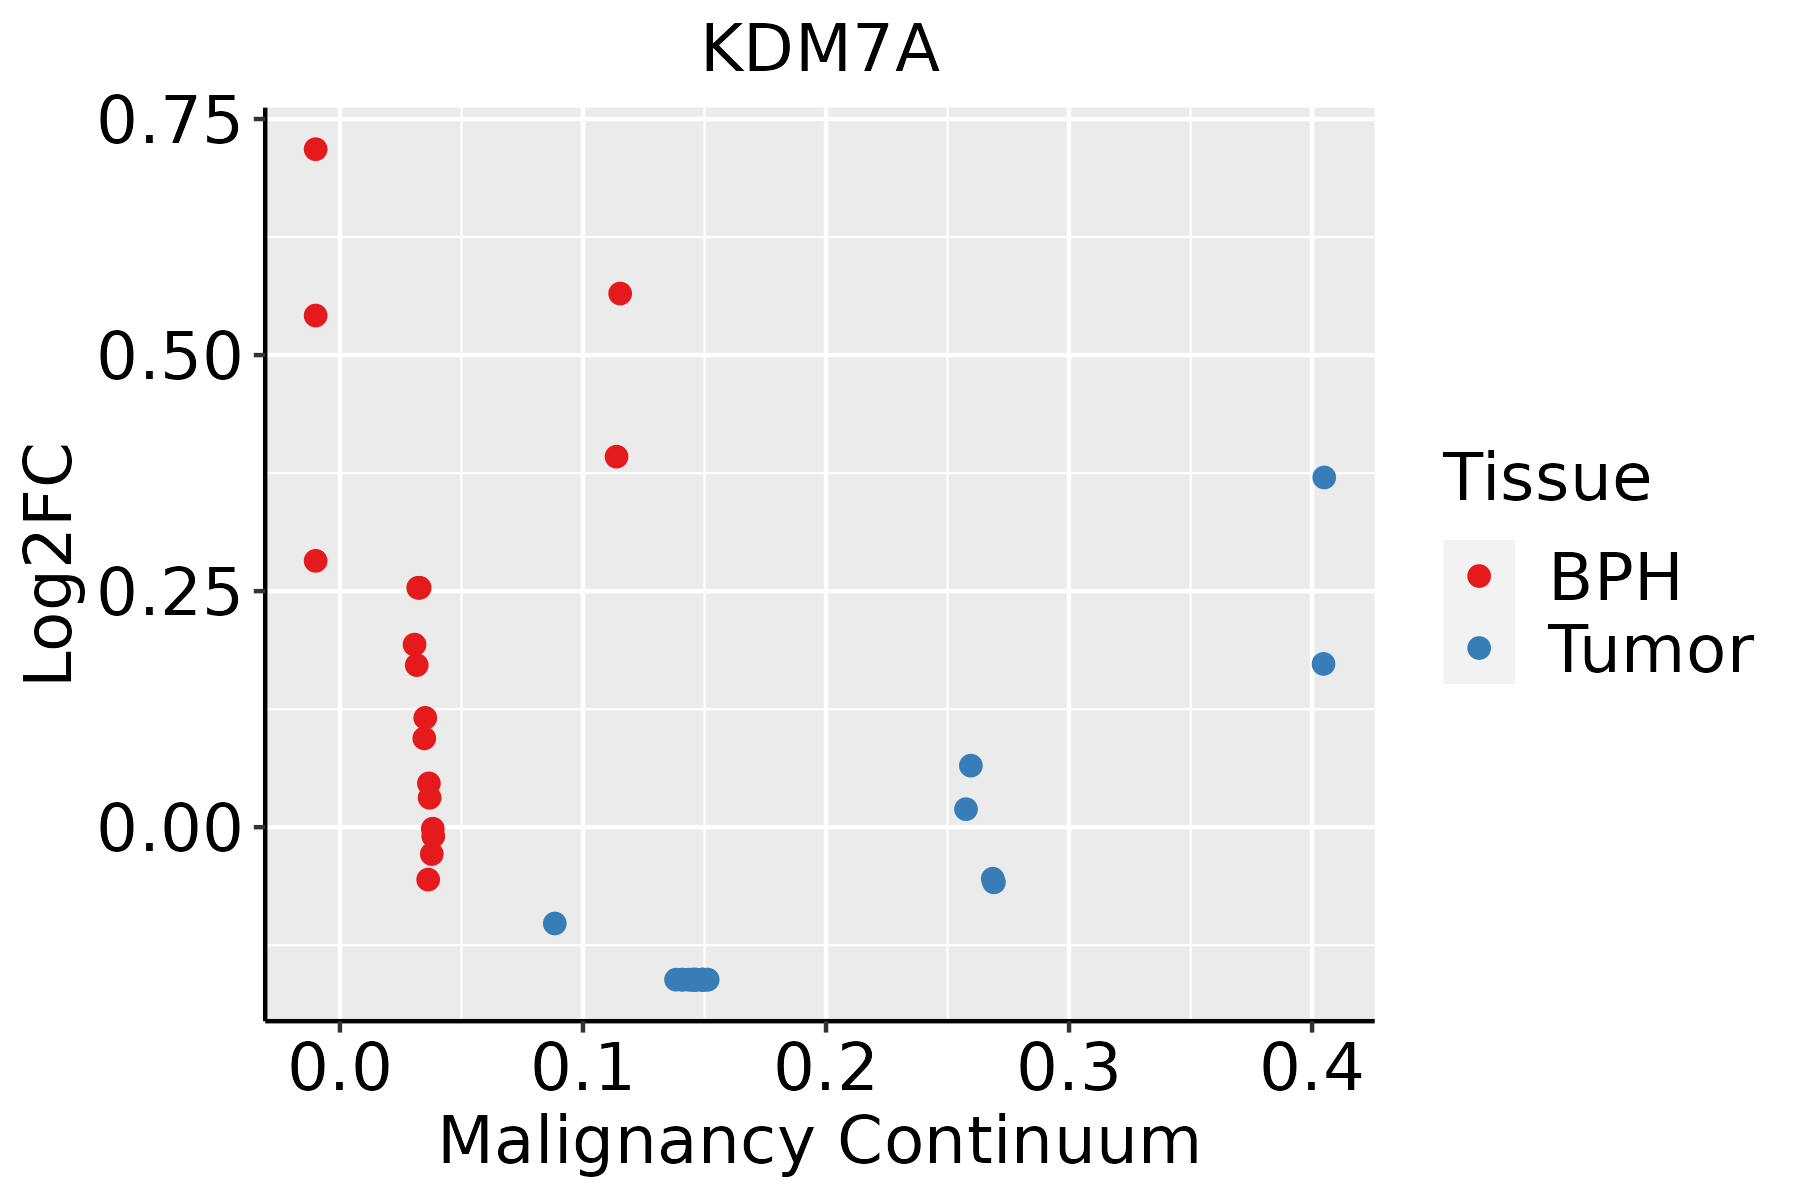 | BPH: Benign Prostatic Hyperplasia |
| ∗log2FC in expression of this searched gene in stem-like cells from each diseased tissue sample relative to stem-like cells in normal samples in each tissue plotted against the malignancy continuum. Samples are colored based on if they are from different disease stage. |
Top |
Malignant transformation related pathway analysis |
| Find out the enriched GO biological processes and KEGG pathways involved in transition from healthy to precancer to cancer |
| Tissue | Disease Stage | Enriched GO biological Processes |
| Colorectum | AD |  |
| Colorectum | SER |  |
| Colorectum | MSS |  |
| Colorectum | MSI-H |  |
| Colorectum | FAP |  |
| ∗Top 15 enriched GO BP terms are showed in the bar plot of each disease state in each tissue. Each row represents a significant GO biological process which is colored according to the -log10(p.adjust). |
| Page: 1 2 3 4 5 6 7 8 9 |
| GO ID | Tissue | Disease Stage | Description | Gene Ratio | Bg Ratio | pvalue | p.adjust | Count |
| GO:0030901 | Colorectum | AD | midbrain development | 32/3918 | 90/18723 | 9.45e-04 | 8.95e-03 | 32 |
| GO:00309011 | Colorectum | SER | midbrain development | 29/2897 | 90/18723 | 5.50e-05 | 1.30e-03 | 29 |
| GO:00309012 | Colorectum | MSS | midbrain development | 31/3467 | 90/18723 | 2.36e-04 | 3.24e-03 | 31 |
| GO:0016570 | Colorectum | MSS | histone modification | 113/3467 | 463/18723 | 8.37e-04 | 8.68e-03 | 113 |
| GO:00165701 | Colorectum | FAP | histone modification | 94/2622 | 463/18723 | 1.06e-04 | 1.76e-03 | 94 |
| GO:00309014 | Colorectum | FAP | midbrain development | 24/2622 | 90/18723 | 1.12e-03 | 1.08e-02 | 24 |
| GO:00165702 | Colorectum | CRC | histone modification | 75/2078 | 463/18723 | 4.95e-04 | 7.06e-03 | 75 |
| GO:00309015 | Colorectum | CRC | midbrain development | 21/2078 | 90/18723 | 7.06e-04 | 9.17e-03 | 21 |
| GO:001657015 | Esophagus | ESCC | histone modification | 323/8552 | 463/18723 | 2.61e-26 | 7.88e-24 | 323 |
| GO:003090118 | Esophagus | ESCC | midbrain development | 58/8552 | 90/18723 | 2.52e-04 | 1.55e-03 | 58 |
| GO:00064824 | Esophagus | ESCC | protein demethylation | 24/8552 | 33/18723 | 1.50e-03 | 7.06e-03 | 24 |
| GO:00082144 | Esophagus | ESCC | protein dealkylation | 24/8552 | 33/18723 | 1.50e-03 | 7.06e-03 | 24 |
| GO:00165773 | Esophagus | ESCC | histone demethylation | 22/8552 | 31/18723 | 3.90e-03 | 1.58e-02 | 22 |
| GO:00700763 | Esophagus | ESCC | histone lysine demethylation | 20/8552 | 28/18723 | 5.23e-03 | 1.97e-02 | 20 |
| GO:00165703 | Liver | NAFLD | histone modification | 90/1882 | 463/18723 | 5.74e-10 | 1.28e-07 | 90 |
| GO:0070076 | Liver | NAFLD | histone lysine demethylation | 10/1882 | 28/18723 | 2.46e-04 | 4.09e-03 | 10 |
| GO:0016577 | Liver | NAFLD | histone demethylation | 10/1882 | 31/18723 | 6.28e-04 | 8.21e-03 | 10 |
| GO:0006482 | Liver | NAFLD | protein demethylation | 10/1882 | 33/18723 | 1.09e-03 | 1.27e-02 | 10 |
| GO:0008214 | Liver | NAFLD | protein dealkylation | 10/1882 | 33/18723 | 1.09e-03 | 1.27e-02 | 10 |
| GO:00309017 | Liver | NAFLD | midbrain development | 19/1882 | 90/18723 | 1.35e-03 | 1.52e-02 | 19 |
| Page: 1 2 3 |
| Pathway ID | Tissue | Disease Stage | Description | Gene Ratio | Bg Ratio | pvalue | p.adjust | qvalue | Count |
| Page: 1 |
Top |
Cell-cell communication analysis |
| Identification of potential cell-cell interactions between two cell types and their ligand-receptor pairs for different disease states |
| Ligand | Receptor | LRpair | Pathway | Tissue | Disease Stage |
| Page: 1 |
Top |
Single-cell gene regulatory network inference analysis |
| Find out the significant the regulons (TFs) and the target genes of each regulon across cell types for different disease states |
| TF | Cell Type | Tissue | Disease Stage | Target Gene | RSS | Regulon Activity |
| KDM7A | CD8TEXP | Breast | Precancer | TMEM204,GLO1,THADA, etc. | 4.58e-02 |  |
| ∗The dot plots of a searched regulon are shown for all cell subpopulations in each disease state of each tissue based on the regulon specific score inferred using pySCENIC and by calculating the average expression. |
| Page: 1 |
Top |
Somatic mutation of malignant transformation related genes |
| Annotation of somatic variants for genes involved in malignant transformation |
| Hugo Symbol | Variant Class | Variant Classification | dbSNP RS | HGVSc | HGVSp | HGVSp Short | SWISSPROT | BIOTYPE | SIFT | PolyPhen | Tumor Sample Barcode | Tissue | Histology | Sex | Age | Stage | Therapy Types | Drugs | Outcome |
| KDM7A | SNV | Missense_Mutation | c.1553A>G | p.Asn518Ser | p.N518S | Q6ZMT4 | protein_coding | tolerated(1) | benign(0) | TCGA-A2-A04T-01 | Breast | breast invasive carcinoma | Female | <65 | I/II | Chemotherapy | cyclophosphamide | SD | |
| KDM7A | SNV | Missense_Mutation | c.1652N>G | p.Ser551Cys | p.S551C | Q6ZMT4 | protein_coding | deleterious(0.03) | possibly_damaging(0.628) | TCGA-AC-A23H-01 | Breast | breast invasive carcinoma | Female | >=65 | I/II | Unknown | Unknown | PD | |
| KDM7A | SNV | Missense_Mutation | novel | c.1831A>G | p.Arg611Gly | p.R611G | Q6ZMT4 | protein_coding | tolerated(0.13) | benign(0) | TCGA-D8-A1JL-01 | Breast | breast invasive carcinoma | Female | >=65 | I/II | Unknown | Unknown | SD |
| KDM7A | insertion | In_Frame_Ins | novel | c.2459_2460insAACATATGGCACACTCAAGGACAG | p.Asp820delinsGluThrTyrGlyThrLeuLysAspSer | p.D820delinsETYGTLKDS | Q6ZMT4 | protein_coding | TCGA-AO-A0JD-01 | Breast | breast invasive carcinoma | Female | <65 | III/IV | Chemotherapy | cyclophosphamide | SD | ||
| KDM7A | deletion | Frame_Shift_Del | c.914delA | p.Lys305SerfsTer17 | p.K305Sfs*17 | Q6ZMT4 | protein_coding | TCGA-E9-A1NE-01 | Breast | breast invasive carcinoma | Female | <65 | I/II | Chemotherapy | doxorubicin | CR | |||
| KDM7A | SNV | Missense_Mutation | novel | c.787A>G | p.Lys263Glu | p.K263E | Q6ZMT4 | protein_coding | deleterious(0) | probably_damaging(0.986) | TCGA-2W-A8YY-01 | Cervix | cervical & endocervical cancer | Female | <65 | I/II | Chemotherapy | cisplatin | CR |
| KDM7A | SNV | Missense_Mutation | c.1369G>C | p.Asp457His | p.D457H | Q6ZMT4 | protein_coding | deleterious(0) | probably_damaging(0.968) | TCGA-EK-A2RA-01 | Cervix | cervical & endocervical cancer | Female | >=65 | I/II | Unknown | Unknown | SD | |
| KDM7A | SNV | Missense_Mutation | rs758963637 | c.2548N>A | p.Gly850Ser | p.G850S | Q6ZMT4 | protein_coding | tolerated(0.29) | benign(0.003) | TCGA-VS-A950-01 | Cervix | cervical & endocervical cancer | Female | <65 | III/IV | Unknown | Unknown | SD |
| KDM7A | SNV | Missense_Mutation | novel | c.997N>C | p.Asp333His | p.D333H | Q6ZMT4 | protein_coding | deleterious(0) | probably_damaging(0.943) | TCGA-VS-A958-01 | Cervix | cervical & endocervical cancer | Female | <65 | I/II | Chemotherapy | cisplatin | CR |
| KDM7A | SNV | Missense_Mutation | c.2755G>A | p.Ala919Thr | p.A919T | Q6ZMT4 | protein_coding | deleterious(0) | probably_damaging(0.996) | TCGA-A6-2683-01 | Colorectum | colon adenocarcinoma | Female | <65 | III/IV | Chemotherapy | irinotecan | PD |
| Page: 1 2 3 4 5 6 7 8 9 |
Top |
Related drugs of malignant transformation related genes |
| Identification of chemicals and drugs interact with genes involved in malignant transfromation |
| (DGIdb 4.0) |
| Entrez ID | Symbol | Category | Interaction Types | Drug Claim Name | Drug Name | PMIDs |
| 80853 | KDM7A | ENZYME | inhibitor | 178103604 |
| Page: 1 |

Copyright 2023-Present -The University of Texas Health Science Center at Houston |