
|
|||||
|
 | |
| |
| |
| |
| |
| |
|
Gene: KDM6B |
Gene summary for KDM6B |
| Gene information | Species | Human | Gene symbol | KDM6B | Gene ID | 23135 |
| Gene name | lysine demethylase 6B | |
| Gene Alias | JMJD3 | |
| Cytomap | 17p13.1 | |
| Gene Type | protein-coding | GO ID | GO:0000302 | UniProtAcc | O15054 |
Top |
Malignant transformation analysis |
| Identification of the aberrant gene expression in precancerous and cancerous lesions by comparing the gene expression of stem-like cells in diseased tissues with normal stem cells |
| Entrez ID | Symbol | Replicates | Species | Organ | Tissue | Adj P-value | Log2FC | Malignancy |
| 23135 | KDM6B | AEH-subject1 | Human | Endometrium | AEH | 1.29e-02 | 2.02e-01 | -0.3059 |
| 23135 | KDM6B | AEH-subject5 | Human | Endometrium | AEH | 4.52e-02 | 1.80e-01 | -0.2953 |
| 23135 | KDM6B | EEC-subject1 | Human | Endometrium | EEC | 8.34e-09 | 2.73e-01 | -0.2682 |
| 23135 | KDM6B | EEC-subject3 | Human | Endometrium | EEC | 1.10e-05 | 1.80e-01 | -0.2525 |
| 23135 | KDM6B | GSM5276934 | Human | Endometrium | EEC | 1.77e-17 | 5.68e-01 | -0.0913 |
| 23135 | KDM6B | GSM5276937 | Human | Endometrium | EEC | 7.08e-19 | 5.85e-01 | -0.0897 |
| 23135 | KDM6B | GSM6177620_NYU_UCEC1_lib1_lib1 | Human | Endometrium | EEC | 1.69e-08 | -1.62e-01 | -0.1869 |
| 23135 | KDM6B | GSM6177620_NYU_UCEC1_lib2_lib2 | Human | Endometrium | EEC | 1.98e-08 | -1.31e-01 | -0.1875 |
| 23135 | KDM6B | GSM6177620_NYU_UCEC1_lib3_lib3 | Human | Endometrium | EEC | 1.73e-07 | -1.95e-01 | -0.1883 |
| 23135 | KDM6B | GSM6177621_NYU_UCEC2_lib1_lib1 | Human | Endometrium | EEC | 1.81e-06 | -1.83e-01 | -0.1934 |
| 23135 | KDM6B | GSM6177622_NYU_UCEC3_lib1_lib1 | Human | Endometrium | EEC | 3.07e-15 | 4.22e-02 | -0.1917 |
| 23135 | KDM6B | GSM6177622_NYU_UCEC3_lib2_lib2 | Human | Endometrium | EEC | 3.20e-13 | -6.95e-02 | -0.1916 |
| 23135 | KDM6B | LZE8T | Human | Esophagus | ESCC | 5.82e-06 | 4.22e-01 | 0.067 |
| 23135 | KDM6B | LZE24T | Human | Esophagus | ESCC | 1.41e-19 | 1.04e+00 | 0.0596 |
| 23135 | KDM6B | LZE21T | Human | Esophagus | ESCC | 1.56e-02 | 5.10e-01 | 0.0655 |
| 23135 | KDM6B | LZE6T | Human | Esophagus | ESCC | 4.62e-04 | -6.50e-03 | 0.0845 |
| 23135 | KDM6B | P1T-E | Human | Esophagus | ESCC | 1.81e-07 | 7.66e-01 | 0.0875 |
| 23135 | KDM6B | P2T-E | Human | Esophagus | ESCC | 1.60e-26 | 6.14e-01 | 0.1177 |
| 23135 | KDM6B | P4T-E | Human | Esophagus | ESCC | 1.59e-12 | 4.35e-01 | 0.1323 |
| 23135 | KDM6B | P5T-E | Human | Esophagus | ESCC | 2.96e-09 | -1.13e-01 | 0.1327 |
| Page: 1 2 3 4 5 6 7 |
| Tissue | Expression Dynamics | Abbreviation |
| Endometrium |  | AEH: Atypical endometrial hyperplasia |
| EEC: Endometrioid Cancer | ||
| Esophagus | 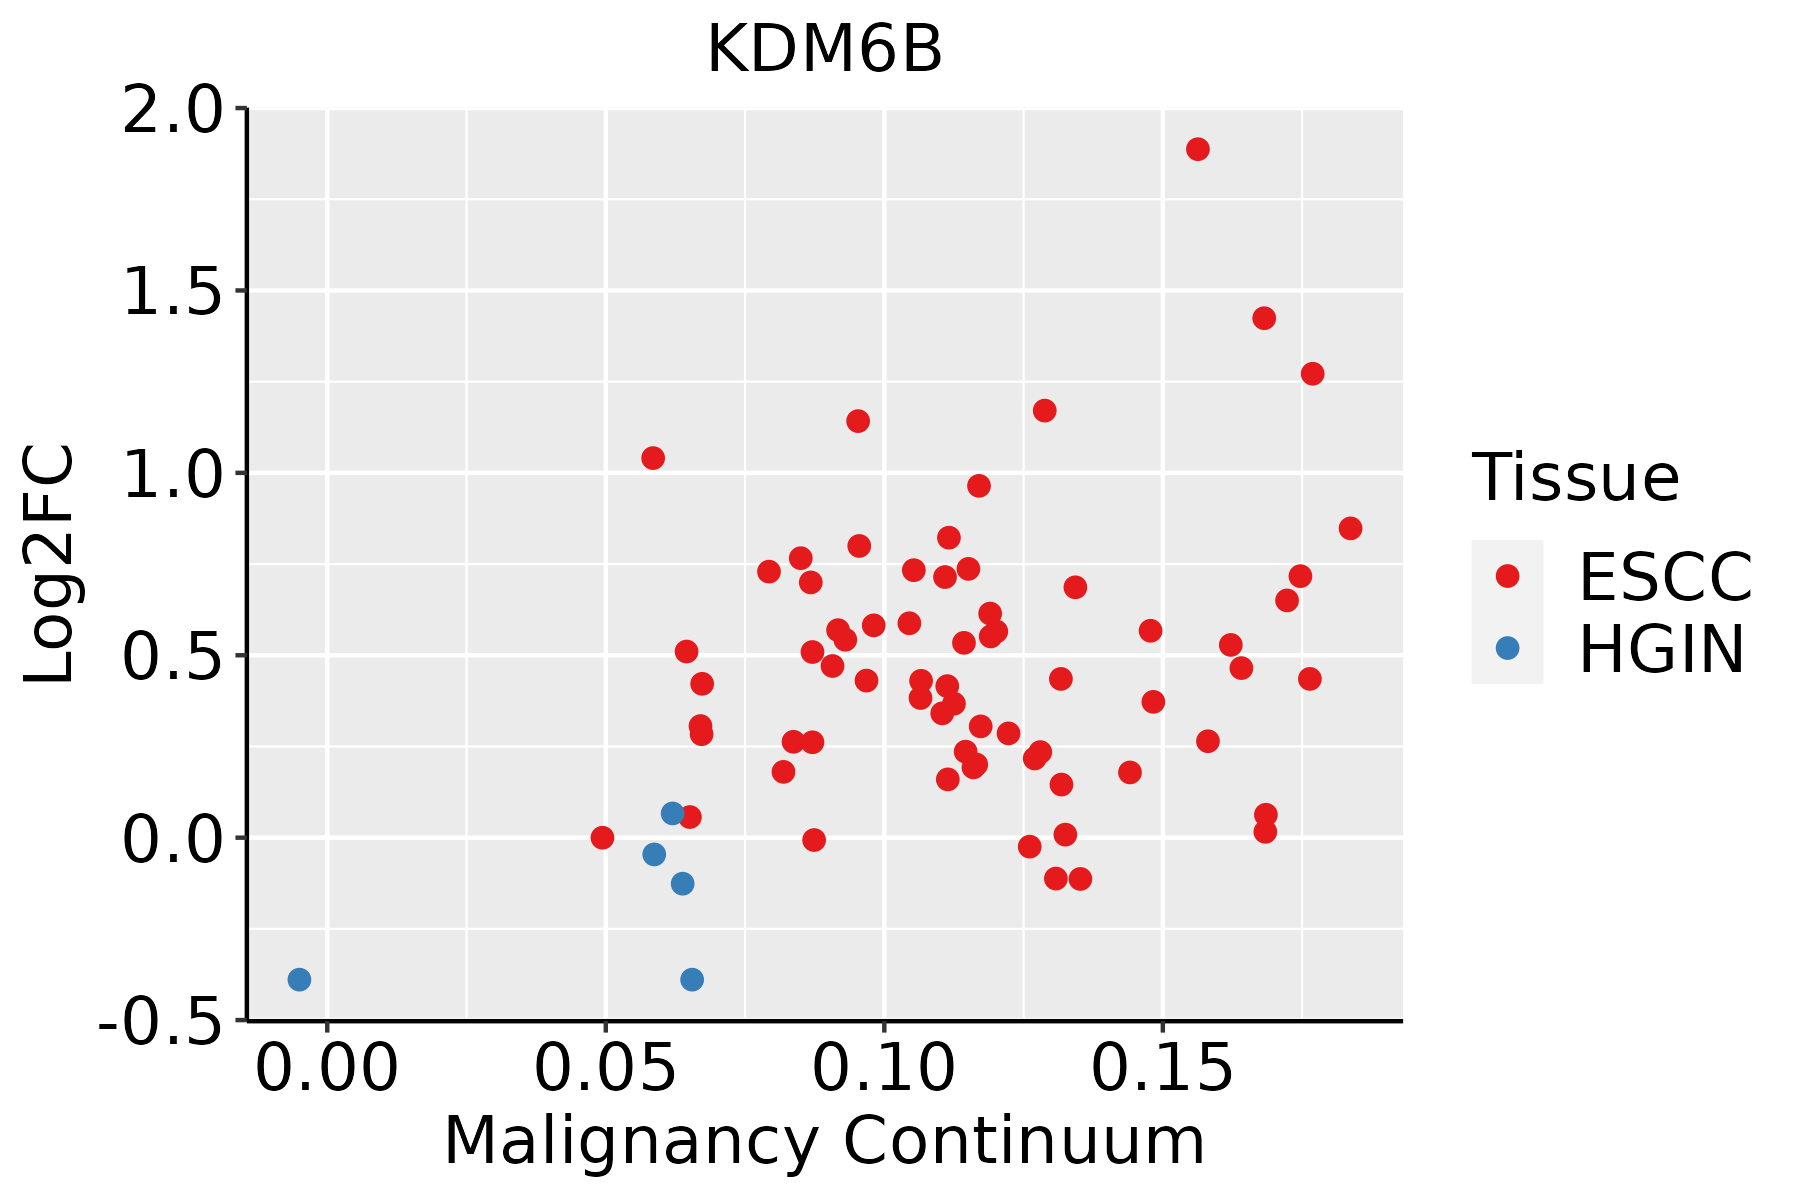 | ESCC: Esophageal squamous cell carcinoma |
| HGIN: High-grade intraepithelial neoplasias | ||
| LGIN: Low-grade intraepithelial neoplasias | ||
| Liver | 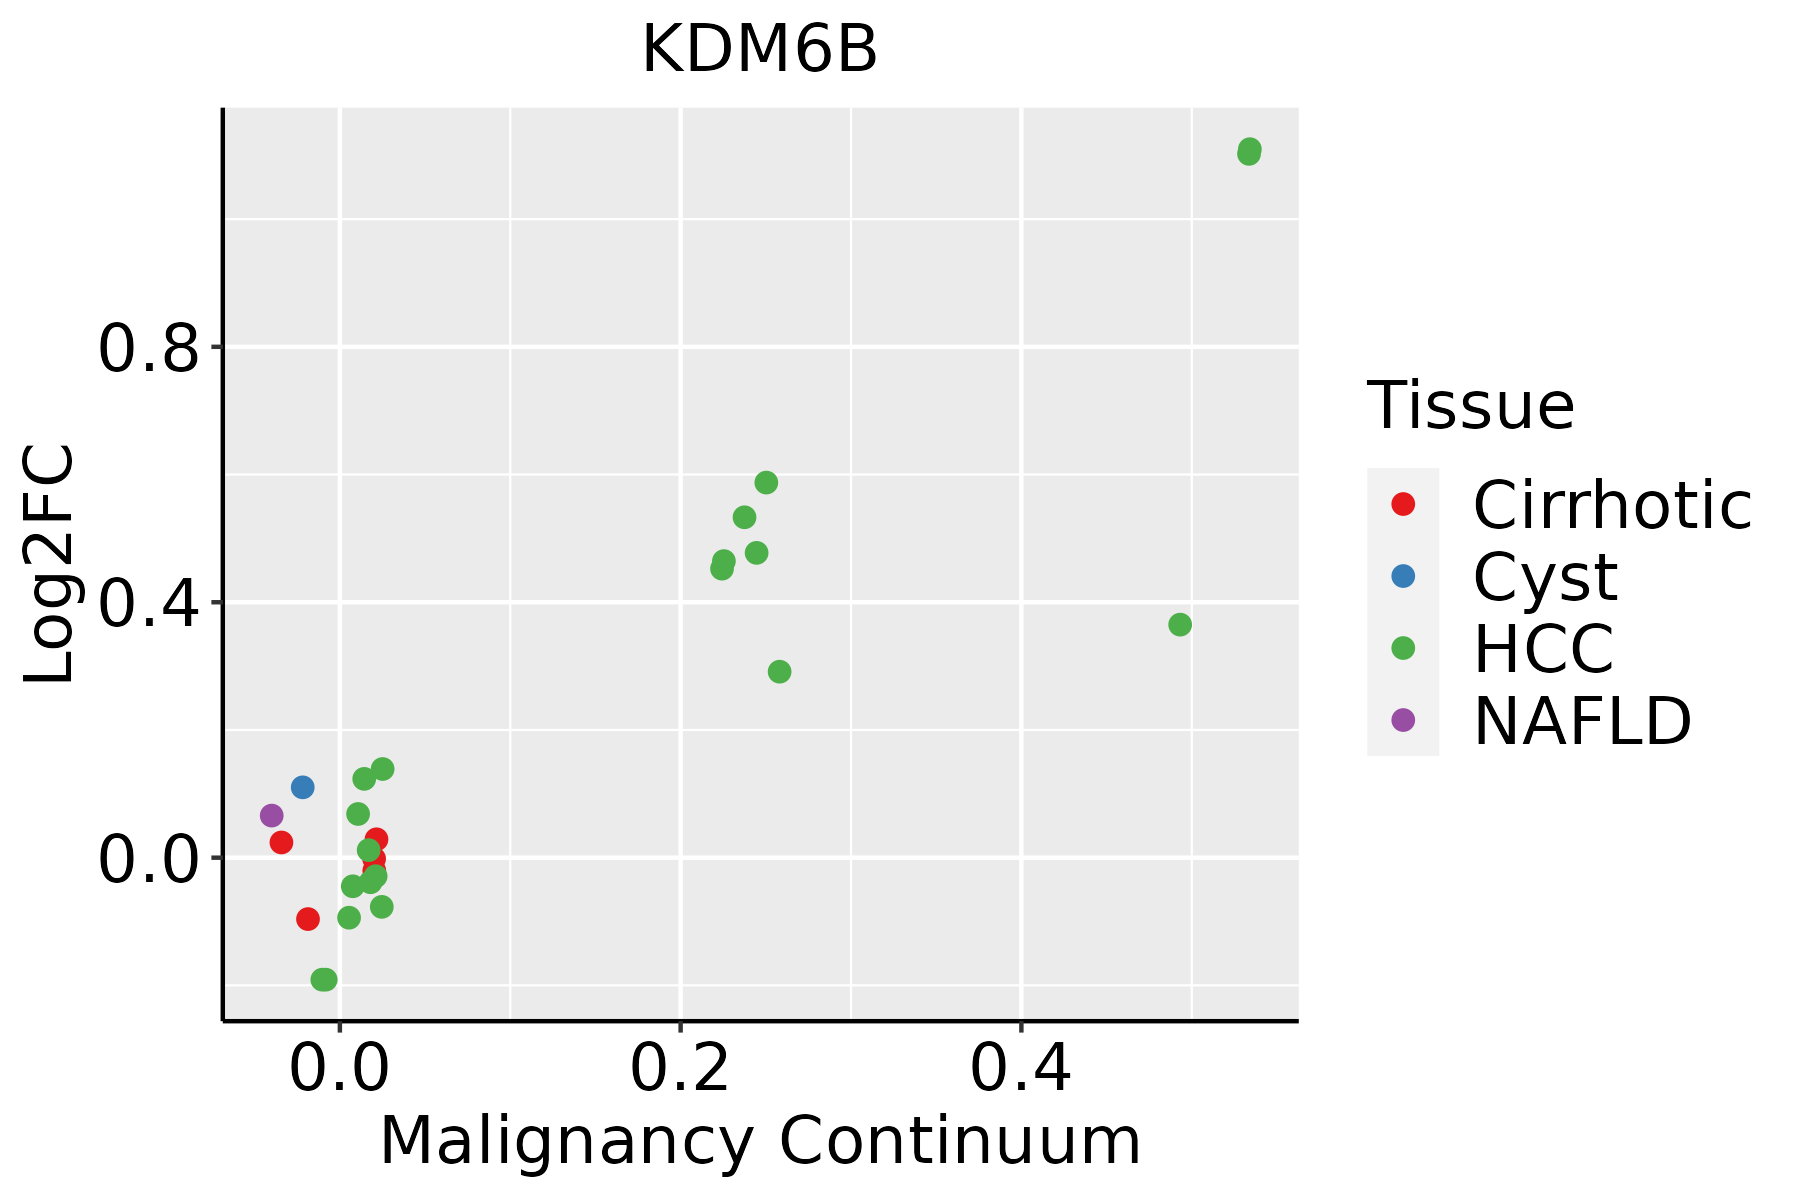 | HCC: Hepatocellular carcinoma |
| NAFLD: Non-alcoholic fatty liver disease | ||
| Oral Cavity | 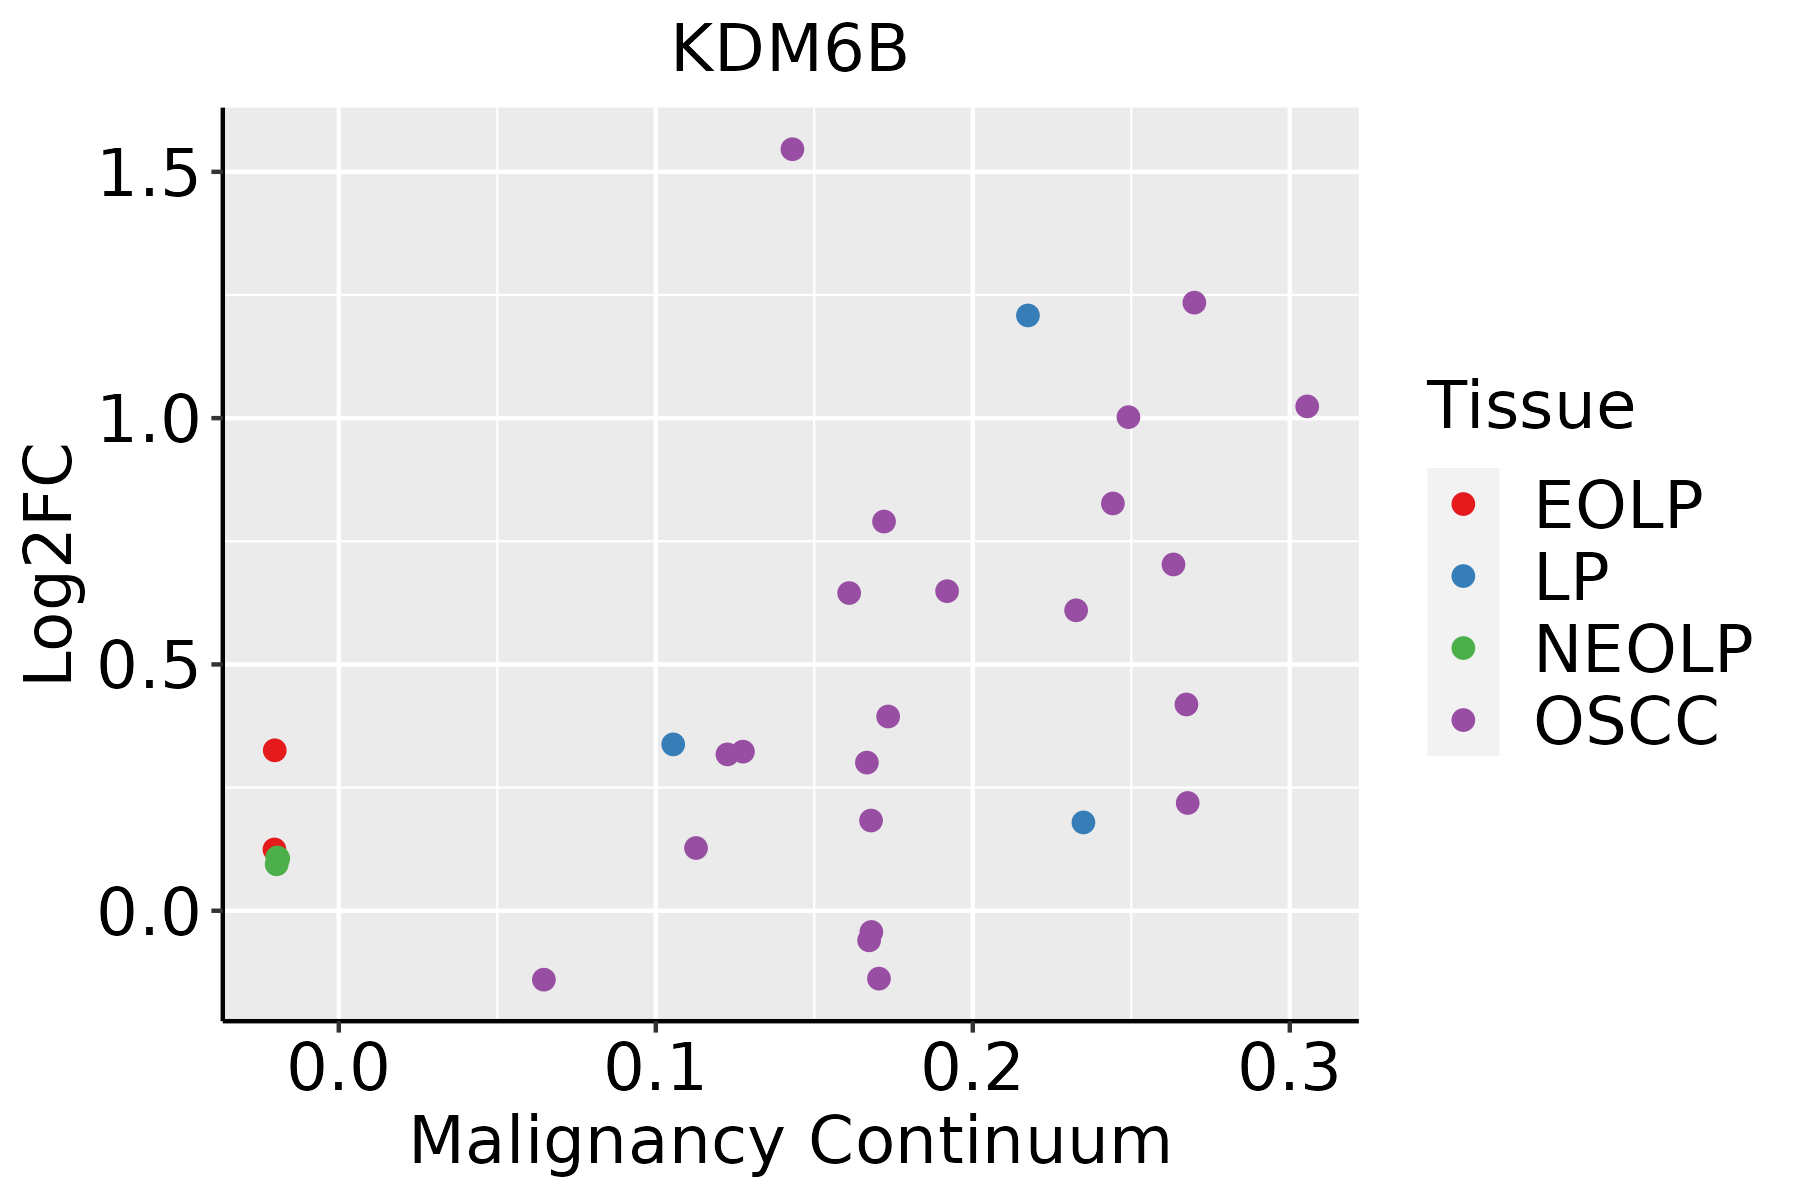 | EOLP: Erosive Oral lichen planus |
| LP: leukoplakia | ||
| NEOLP: Non-erosive oral lichen planus | ||
| OSCC: Oral squamous cell carcinoma | ||
| Prostate |  | BPH: Benign Prostatic Hyperplasia |
| Thyroid | 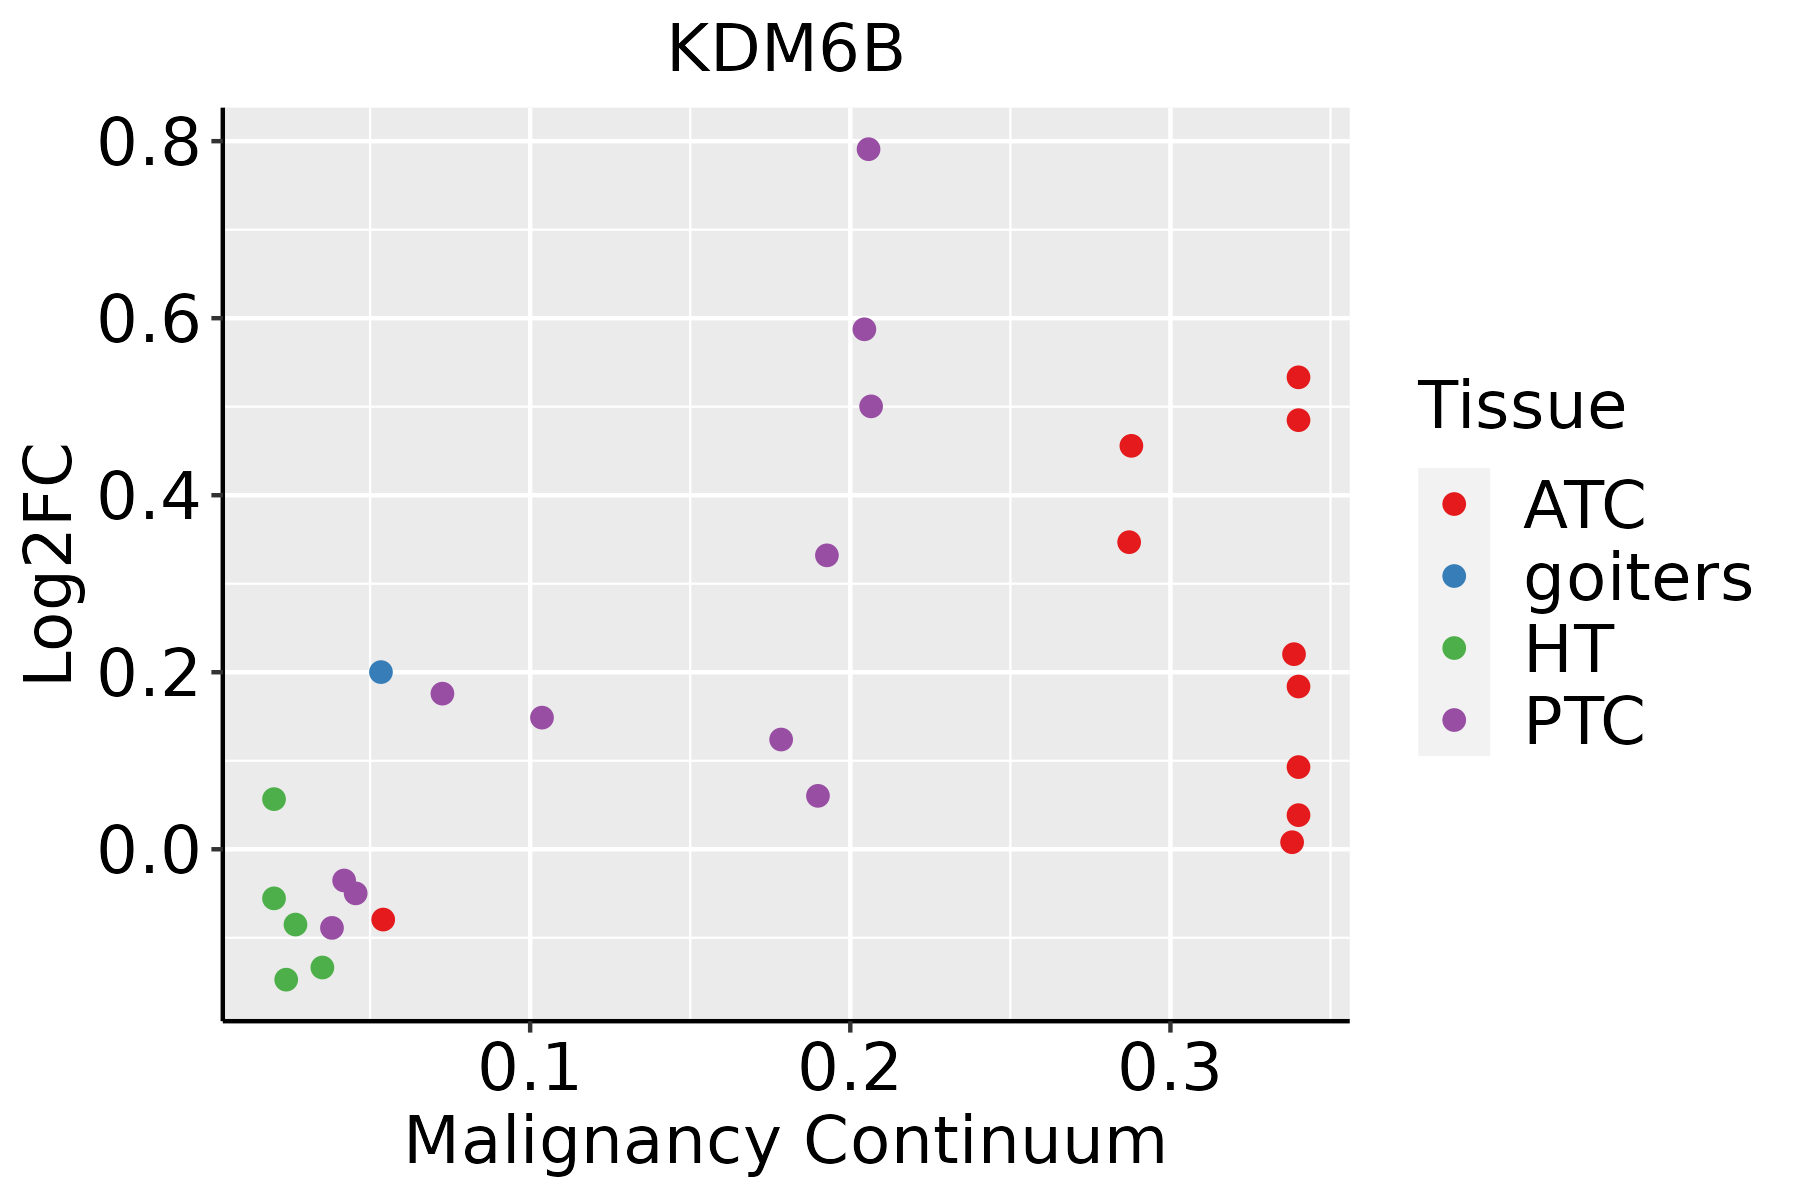 | ATC: Anaplastic thyroid cancer |
| HT: Hashimoto's thyroiditis | ||
| PTC: Papillary thyroid cancer |
| ∗log2FC in expression of this searched gene in stem-like cells from each diseased tissue sample relative to stem-like cells in normal samples in each tissue plotted against the malignancy continuum. Samples are colored based on if they are from different disease stage. |
Top |
Malignant transformation related pathway analysis |
| Find out the enriched GO biological processes and KEGG pathways involved in transition from healthy to precancer to cancer |
| Tissue | Disease Stage | Enriched GO biological Processes |
| Colorectum | AD |  |
| Colorectum | SER |  |
| Colorectum | MSS |  |
| Colorectum | MSI-H |  |
| Colorectum | FAP |  |
| ∗Top 15 enriched GO BP terms are showed in the bar plot of each disease state in each tissue. Each row represents a significant GO biological process which is colored according to the -log10(p.adjust). |
| Page: 1 2 3 4 5 6 7 8 9 |
| GO ID | Tissue | Disease Stage | Description | Gene Ratio | Bg Ratio | pvalue | p.adjust | Count |
| GO:000697916 | Endometrium | AEH | response to oxidative stress | 93/2100 | 446/18723 | 1.94e-09 | 1.64e-07 | 93 |
| GO:000030216 | Endometrium | AEH | response to reactive oxygen species | 54/2100 | 222/18723 | 2.54e-08 | 1.49e-06 | 54 |
| GO:00605376 | Endometrium | AEH | muscle tissue development | 83/2100 | 403/18723 | 2.57e-08 | 1.50e-06 | 83 |
| GO:006219716 | Endometrium | AEH | cellular response to chemical stress | 71/2100 | 337/18723 | 1.03e-07 | 5.05e-06 | 71 |
| GO:004254215 | Endometrium | AEH | response to hydrogen peroxide | 38/2100 | 146/18723 | 4.70e-07 | 1.92e-05 | 38 |
| GO:00147065 | Endometrium | AEH | striated muscle tissue development | 75/2100 | 384/18723 | 1.06e-06 | 3.62e-05 | 75 |
| GO:003459916 | Endometrium | AEH | cellular response to oxidative stress | 58/2100 | 288/18723 | 6.49e-06 | 1.58e-04 | 58 |
| GO:000963610 | Endometrium | AEH | response to toxic substance | 52/2100 | 262/18723 | 2.89e-05 | 5.40e-04 | 52 |
| GO:000315810 | Endometrium | AEH | endothelium development | 31/2100 | 136/18723 | 8.53e-05 | 1.26e-03 | 31 |
| GO:00426925 | Endometrium | AEH | muscle cell differentiation | 68/2100 | 384/18723 | 8.88e-05 | 1.30e-03 | 68 |
| GO:003461415 | Endometrium | AEH | cellular response to reactive oxygen species | 34/2100 | 155/18723 | 9.00e-05 | 1.30e-03 | 34 |
| GO:00511465 | Endometrium | AEH | striated muscle cell differentiation | 51/2100 | 283/18723 | 4.20e-04 | 4.46e-03 | 51 |
| GO:0048738 | Endometrium | AEH | cardiac muscle tissue development | 43/2100 | 236/18723 | 9.06e-04 | 8.30e-03 | 43 |
| GO:00454467 | Endometrium | AEH | endothelial cell differentiation | 24/2100 | 118/18723 | 2.71e-03 | 1.96e-02 | 24 |
| GO:00063258 | Endometrium | AEH | chromatin organization | 64/2100 | 409/18723 | 3.69e-03 | 2.52e-02 | 64 |
| GO:00466772 | Endometrium | AEH | response to antibiotic | 12/2100 | 47/18723 | 4.72e-03 | 3.00e-02 | 12 |
| GO:00703015 | Endometrium | AEH | cellular response to hydrogen peroxide | 20/2100 | 98/18723 | 5.64e-03 | 3.46e-02 | 20 |
| GO:000697917 | Endometrium | EEC | response to oxidative stress | 99/2168 | 446/18723 | 9.02e-11 | 1.13e-08 | 99 |
| GO:006219717 | Endometrium | EEC | cellular response to chemical stress | 77/2168 | 337/18723 | 2.87e-09 | 2.10e-07 | 77 |
| GO:000030217 | Endometrium | EEC | response to reactive oxygen species | 57/2168 | 222/18723 | 4.04e-09 | 2.82e-07 | 57 |
| Page: 1 2 3 4 5 6 7 8 9 10 11 12 13 |
| Pathway ID | Tissue | Disease Stage | Description | Gene Ratio | Bg Ratio | pvalue | p.adjust | qvalue | Count |
| Page: 1 |
Top |
Cell-cell communication analysis |
| Identification of potential cell-cell interactions between two cell types and their ligand-receptor pairs for different disease states |
| Ligand | Receptor | LRpair | Pathway | Tissue | Disease Stage |
| Page: 1 |
Top |
Single-cell gene regulatory network inference analysis |
| Find out the significant the regulons (TFs) and the target genes of each regulon across cell types for different disease states |
| TF | Cell Type | Tissue | Disease Stage | Target Gene | RSS | Regulon Activity |
| ∗The dot plots of a searched regulon are shown for all cell subpopulations in each disease state of each tissue based on the regulon specific score inferred using pySCENIC and by calculating the average expression. |
| Page: 1 |
Top |
Somatic mutation of malignant transformation related genes |
| Annotation of somatic variants for genes involved in malignant transformation |
| Hugo Symbol | Variant Class | Variant Classification | dbSNP RS | HGVSc | HGVSp | HGVSp Short | SWISSPROT | BIOTYPE | SIFT | PolyPhen | Tumor Sample Barcode | Tissue | Histology | Sex | Age | Stage | Therapy Types | Drugs | Outcome |
| KDM6B | SNV | Missense_Mutation | rs148894687 | c.3194N>T | p.Pro1065Leu | p.P1065L | O15054 | protein_coding | deleterious_low_confidence(0.02) | benign(0.183) | TCGA-AC-A5XS-01 | Breast | breast invasive carcinoma | Female | >=65 | I/II | Hormone Therapy | femara | SD |
| KDM6B | SNV | Missense_Mutation | novel | c.899C>T | p.Pro300Leu | p.P300L | O15054 | protein_coding | deleterious_low_confidence(0) | benign(0.055) | TCGA-AQ-A54N-01 | Breast | breast invasive carcinoma | Female | <65 | I/II | Unknown | Unknown | SD |
| KDM6B | SNV | Missense_Mutation | c.4036G>A | p.Glu1346Lys | p.E1346K | O15054 | protein_coding | deleterious(0) | probably_damaging(0.997) | TCGA-AR-A0TX-01 | Breast | breast invasive carcinoma | Female | <65 | I/II | Unknown | Unknown | SD | |
| KDM6B | SNV | Missense_Mutation | rs763945392 | c.2483N>A | p.Arg828Gln | p.R828Q | O15054 | protein_coding | deleterious_low_confidence(0.04) | benign(0.001) | TCGA-AR-A256-01 | Breast | breast invasive carcinoma | Female | <65 | I/II | Chemotherapy | doxorubicin | PD |
| KDM6B | SNV | Missense_Mutation | rs142402964 | c.2155N>A | p.Val719Met | p.V719M | O15054 | protein_coding | deleterious_low_confidence(0.04) | benign(0.255) | TCGA-GM-A2D9-01 | Breast | breast invasive carcinoma | Female | >=65 | I/II | Hormone Therapy | arimidex | SD |
| KDM6B | SNV | Missense_Mutation | rs200586804 | c.2600N>T | p.Ser867Leu | p.S867L | O15054 | protein_coding | tolerated_low_confidence(0.06) | benign(0.003) | TCGA-LD-A74U-01 | Breast | breast invasive carcinoma | Female | >=65 | III/IV | Chemotherapy | taxotere | SD |
| KDM6B | deletion | Frame_Shift_Del | novel | c.3933delN | p.Thr1312ProfsTer37 | p.T1312Pfs*37 | O15054 | protein_coding | TCGA-D8-A27V-01 | Breast | breast invasive carcinoma | Female | <65 | I/II | Hormone Therapy | tamoxiphen | SD | ||
| KDM6B | deletion | Frame_Shift_Del | novel | c.4493delN | p.Glu1498AspfsTer8 | p.E1498Dfs*8 | O15054 | protein_coding | TCGA-D8-A27V-01 | Breast | breast invasive carcinoma | Female | <65 | I/II | Hormone Therapy | tamoxiphen | SD | ||
| KDM6B | SNV | Missense_Mutation | novel | c.511N>T | p.Pro171Ser | p.P171S | O15054 | protein_coding | deleterious_low_confidence(0) | probably_damaging(0.976) | TCGA-2W-A8YY-01 | Cervix | cervical & endocervical cancer | Female | <65 | I/II | Chemotherapy | cisplatin | CR |
| KDM6B | SNV | Missense_Mutation | novel | c.2962N>T | p.Arg988Trp | p.R988W | O15054 | protein_coding | deleterious_low_confidence(0) | probably_damaging(0.977) | TCGA-EA-A3HS-01 | Cervix | cervical & endocervical cancer | Female | <65 | I/II | Unknown | Unknown | SD |
| Page: 1 2 3 4 5 6 7 8 9 10 11 12 13 14 15 16 |
Top |
Related drugs of malignant transformation related genes |
| Identification of chemicals and drugs interact with genes involved in malignant transfromation |
| (DGIdb 4.0) |
| Entrez ID | Symbol | Category | Interaction Types | Drug Claim Name | Drug Name | PMIDs |
| 23135 | KDM6B | ENZYME | inhibitor | 310264759 | ||
| 23135 | KDM6B | ENZYME | inhibitor | 178103606 | ||
| 23135 | KDM6B | ENZYME | inhibitor | 249565910 | ||
| 23135 | KDM6B | ENZYME | inhibitor | 374883847 |
| Page: 1 |

Copyright 2023-Present -The University of Texas Health Science Center at Houston |