
|
|||||
|
 | |
| |
| |
| |
| |
| |
|
Gene: KDM6A |
Gene summary for KDM6A |
| Gene information | Species | Human | Gene symbol | KDM6A | Gene ID | 7403 |
| Gene name | lysine demethylase 6A | |
| Gene Alias | KABUK2 | |
| Cytomap | Xp11.3 | |
| Gene Type | protein-coding | GO ID | GO:0006325 | UniProtAcc | B7ZKN5 |
Top |
Malignant transformation analysis |
| Identification of the aberrant gene expression in precancerous and cancerous lesions by comparing the gene expression of stem-like cells in diseased tissues with normal stem cells |
| Entrez ID | Symbol | Replicates | Species | Organ | Tissue | Adj P-value | Log2FC | Malignancy |
| 7403 | KDM6A | CCI_1 | Human | Cervix | CC | 1.10e-14 | 1.61e+00 | 0.528 |
| 7403 | KDM6A | CCI_2 | Human | Cervix | CC | 4.38e-17 | 2.26e+00 | 0.5249 |
| 7403 | KDM6A | CCI_3 | Human | Cervix | CC | 1.48e-23 | 1.48e+00 | 0.516 |
| 7403 | KDM6A | HTA11_3410_2000001011 | Human | Colorectum | AD | 9.87e-21 | -6.86e-01 | 0.0155 |
| 7403 | KDM6A | HTA11_78_2000001011 | Human | Colorectum | AD | 8.96e-03 | -4.52e-01 | -0.1088 |
| 7403 | KDM6A | HTA11_3361_2000001011 | Human | Colorectum | AD | 1.44e-02 | -5.04e-01 | -0.1207 |
| 7403 | KDM6A | HTA11_696_2000001011 | Human | Colorectum | AD | 2.64e-06 | -3.78e-01 | -0.1464 |
| 7403 | KDM6A | HTA11_866_2000001011 | Human | Colorectum | AD | 1.51e-07 | -3.70e-01 | -0.1001 |
| 7403 | KDM6A | HTA11_7862_2000001011 | Human | Colorectum | AD | 3.55e-04 | -6.44e-01 | -0.0179 |
| 7403 | KDM6A | HTA11_866_3004761011 | Human | Colorectum | AD | 3.19e-15 | -6.71e-01 | 0.096 |
| 7403 | KDM6A | HTA11_8622_2000001021 | Human | Colorectum | SER | 9.01e-03 | -5.11e-01 | 0.0528 |
| 7403 | KDM6A | HTA11_10711_2000001011 | Human | Colorectum | AD | 5.14e-04 | -5.03e-01 | 0.0338 |
| 7403 | KDM6A | HTA11_7696_3000711011 | Human | Colorectum | AD | 1.03e-17 | -6.00e-01 | 0.0674 |
| 7403 | KDM6A | HTA11_6818_2000001021 | Human | Colorectum | AD | 1.11e-05 | -5.99e-01 | 0.0588 |
| 7403 | KDM6A | HTA11_99999970781_79442 | Human | Colorectum | MSS | 2.56e-17 | -5.36e-01 | 0.294 |
| 7403 | KDM6A | HTA11_99999971662_82457 | Human | Colorectum | MSS | 1.39e-16 | -5.50e-01 | 0.3859 |
| 7403 | KDM6A | HTA11_99999973899_84307 | Human | Colorectum | MSS | 1.53e-04 | -5.58e-01 | 0.2585 |
| 7403 | KDM6A | HTA11_99999974143_84620 | Human | Colorectum | MSS | 9.46e-24 | -6.46e-01 | 0.3005 |
| 7403 | KDM6A | A001-C-207 | Human | Colorectum | FAP | 3.57e-05 | -3.06e-01 | 0.1278 |
| 7403 | KDM6A | A015-C-203 | Human | Colorectum | FAP | 5.47e-29 | -4.16e-01 | -0.1294 |
| Page: 1 2 3 4 5 6 7 8 9 10 |
| Tissue | Expression Dynamics | Abbreviation |
| Cervix | 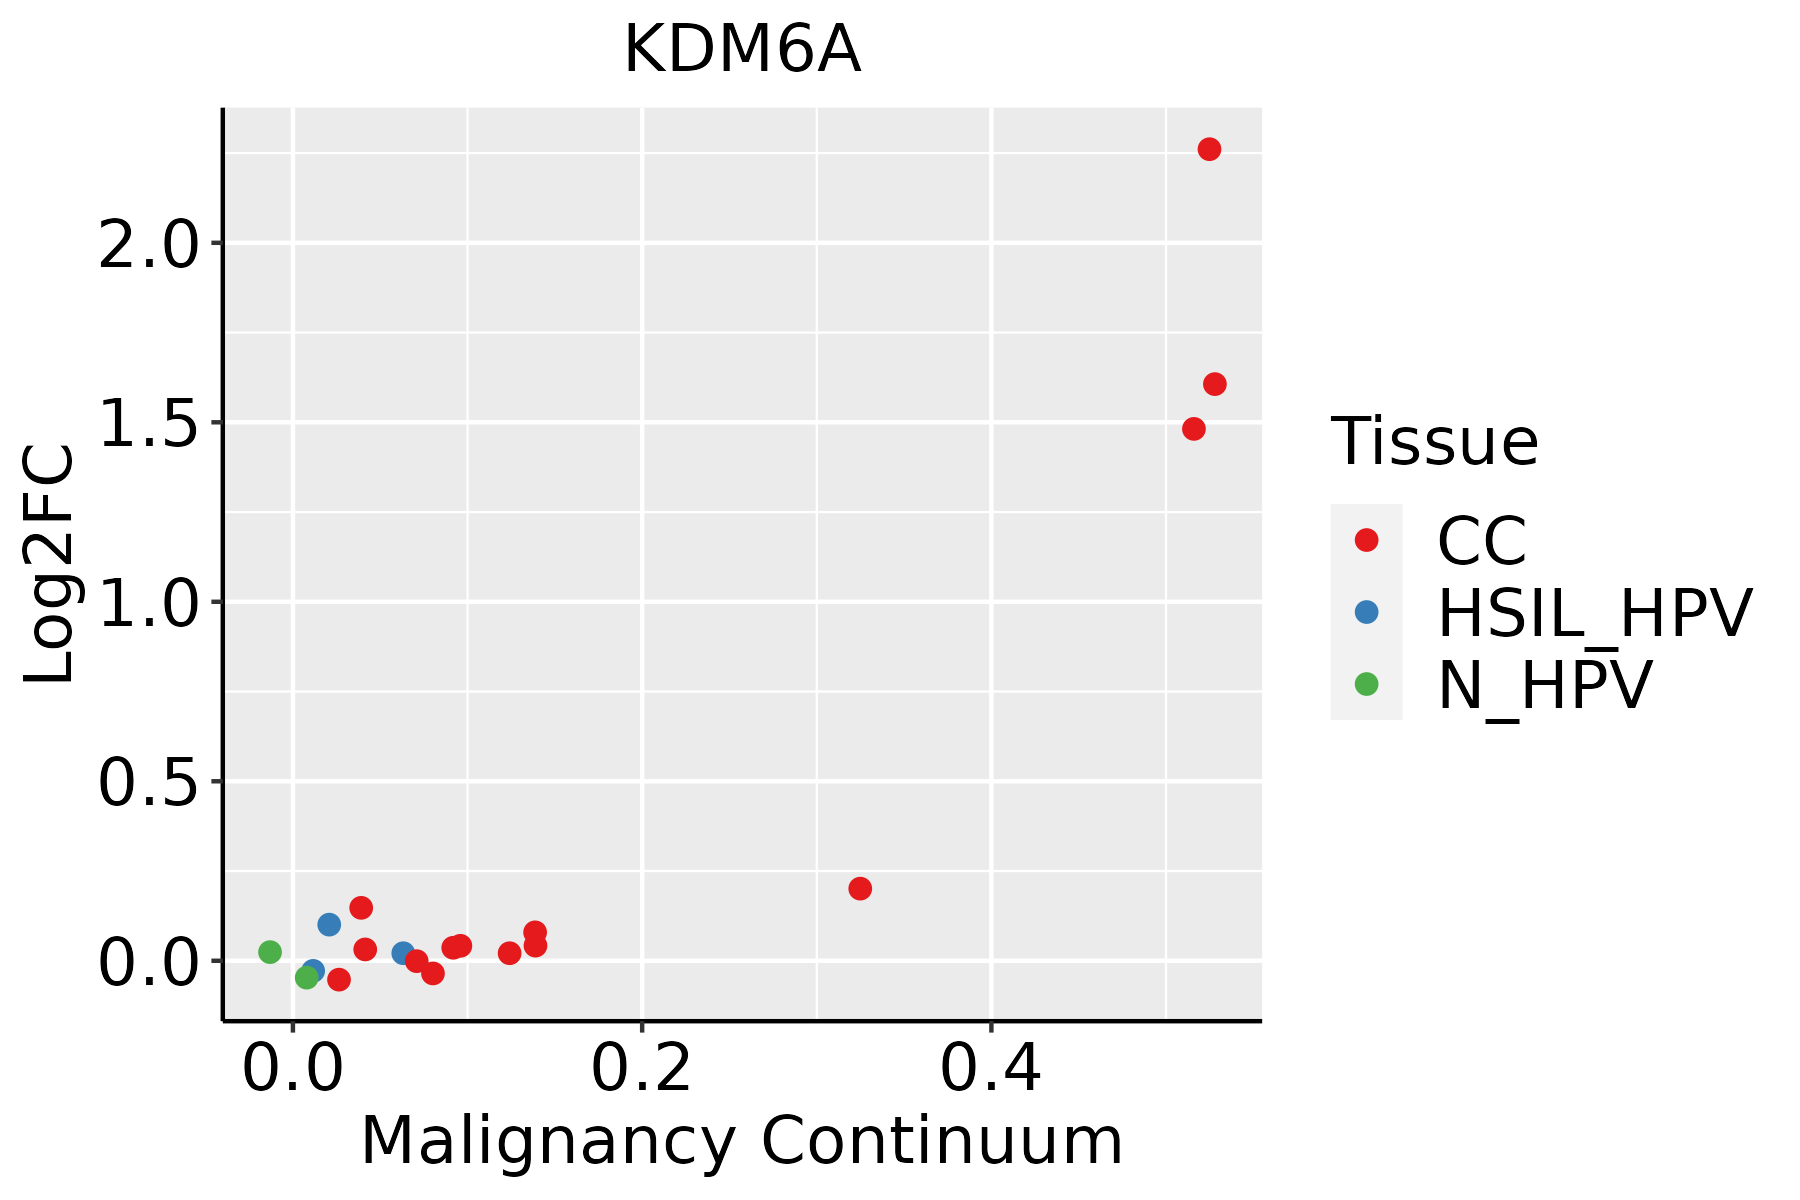 | CC: Cervix cancer |
| HSIL_HPV: HPV-infected high-grade squamous intraepithelial lesions | ||
| N_HPV: HPV-infected normal cervix | ||
| Colorectum (GSE201348) |  | FAP: Familial adenomatous polyposis |
| CRC: Colorectal cancer | ||
| Colorectum (HTA11) |  | AD: Adenomas |
| SER: Sessile serrated lesions | ||
| MSI-H: Microsatellite-high colorectal cancer | ||
| MSS: Microsatellite stable colorectal cancer | ||
| Endometrium | 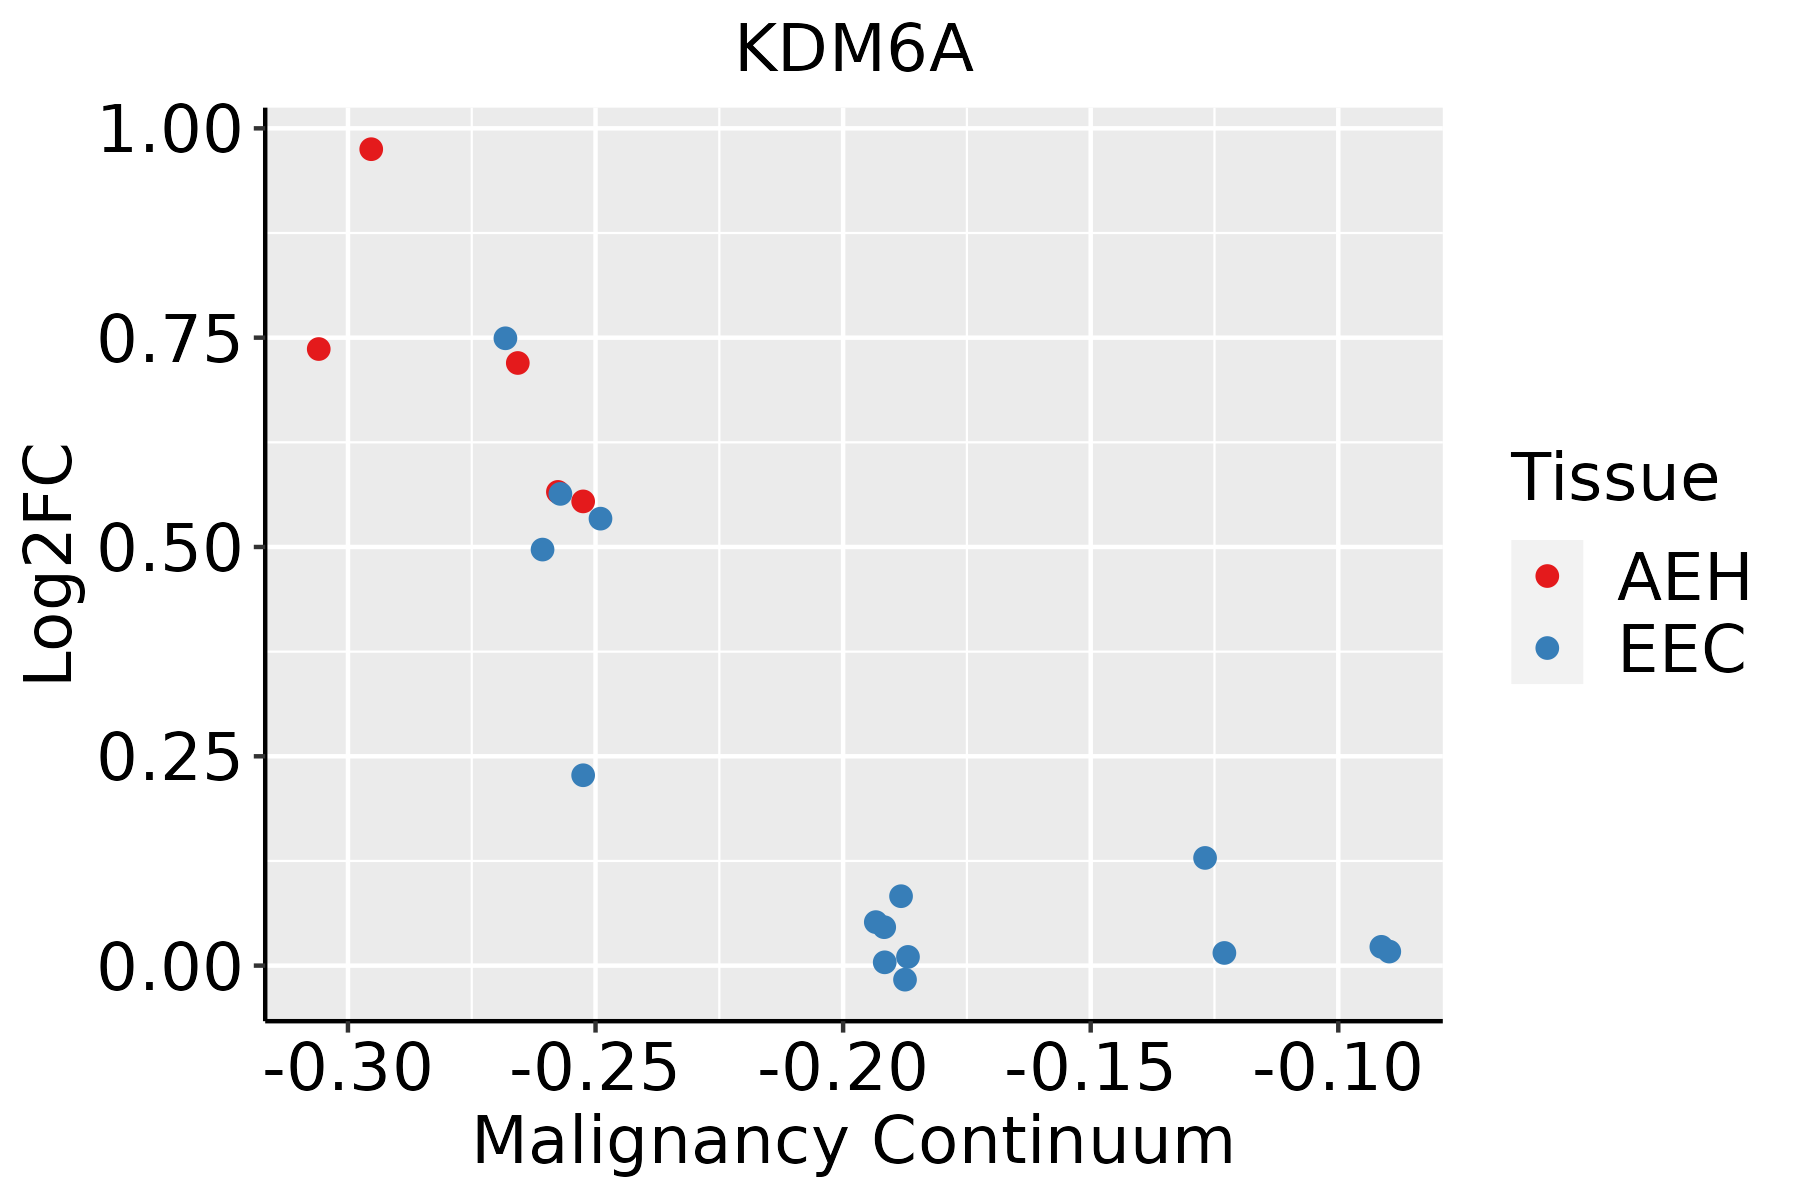 | AEH: Atypical endometrial hyperplasia |
| EEC: Endometrioid Cancer | ||
| Esophagus | 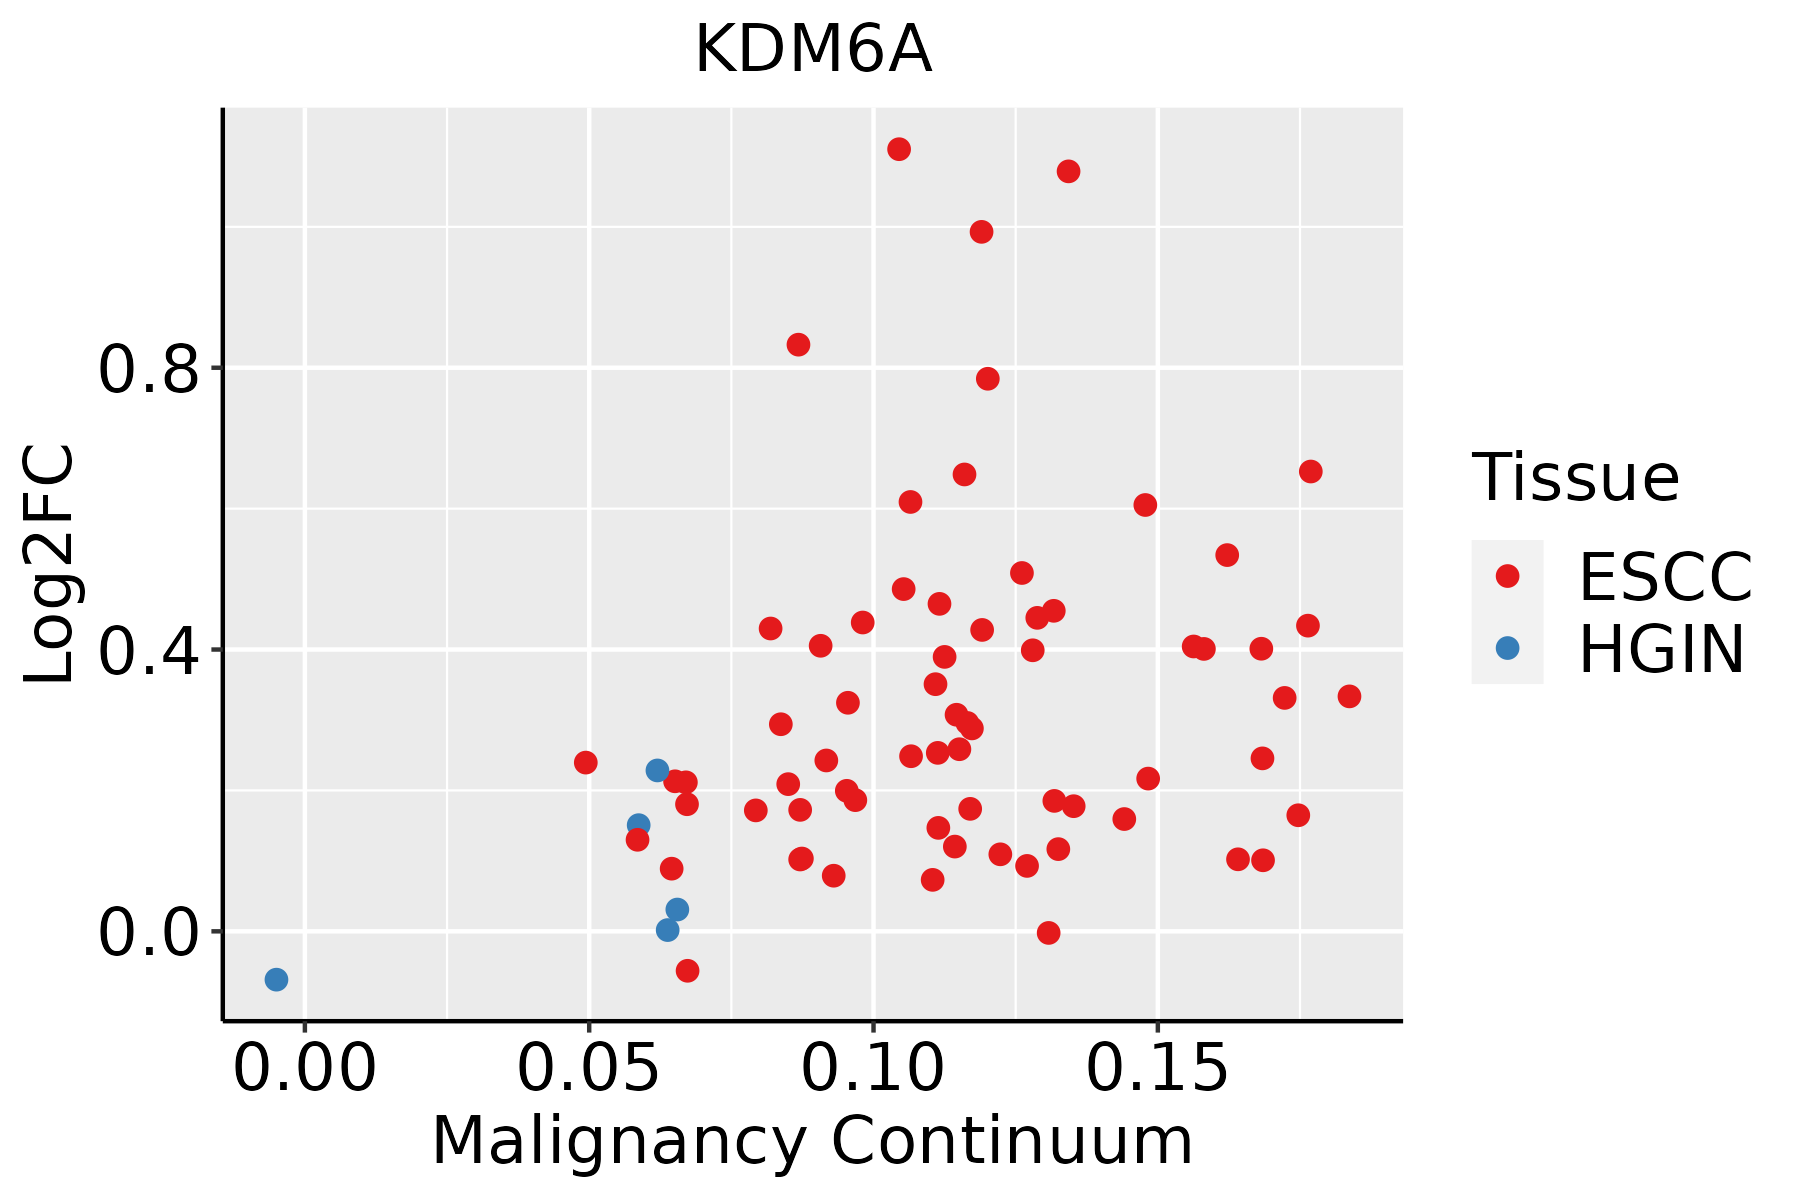 | ESCC: Esophageal squamous cell carcinoma |
| HGIN: High-grade intraepithelial neoplasias | ||
| LGIN: Low-grade intraepithelial neoplasias | ||
| Liver | 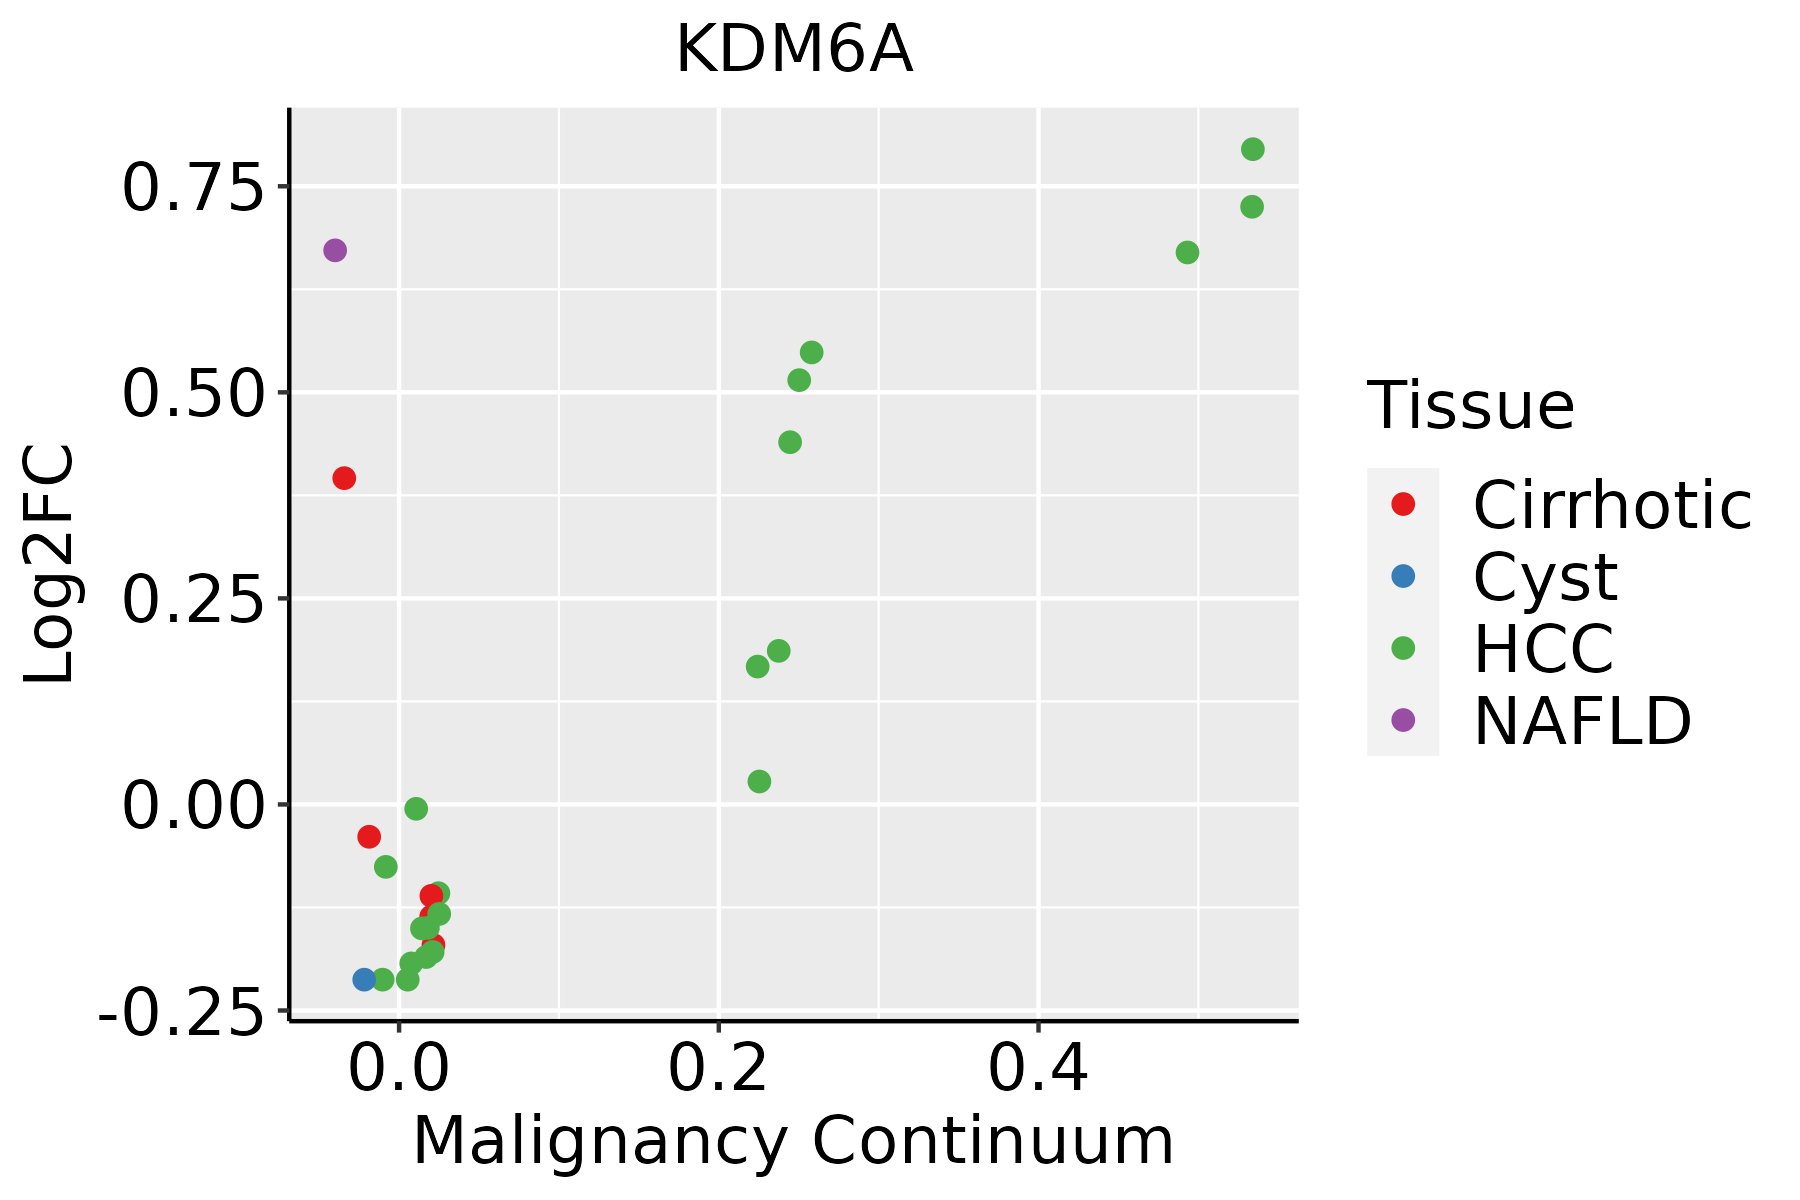 | HCC: Hepatocellular carcinoma |
| NAFLD: Non-alcoholic fatty liver disease | ||
| Lung |  | AAH: Atypical adenomatous hyperplasia |
| AIS: Adenocarcinoma in situ | ||
| IAC: Invasive lung adenocarcinoma | ||
| MIA: Minimally invasive adenocarcinoma | ||
| Oral Cavity |  | EOLP: Erosive Oral lichen planus |
| LP: leukoplakia | ||
| NEOLP: Non-erosive oral lichen planus | ||
| OSCC: Oral squamous cell carcinoma | ||
| Prostate | 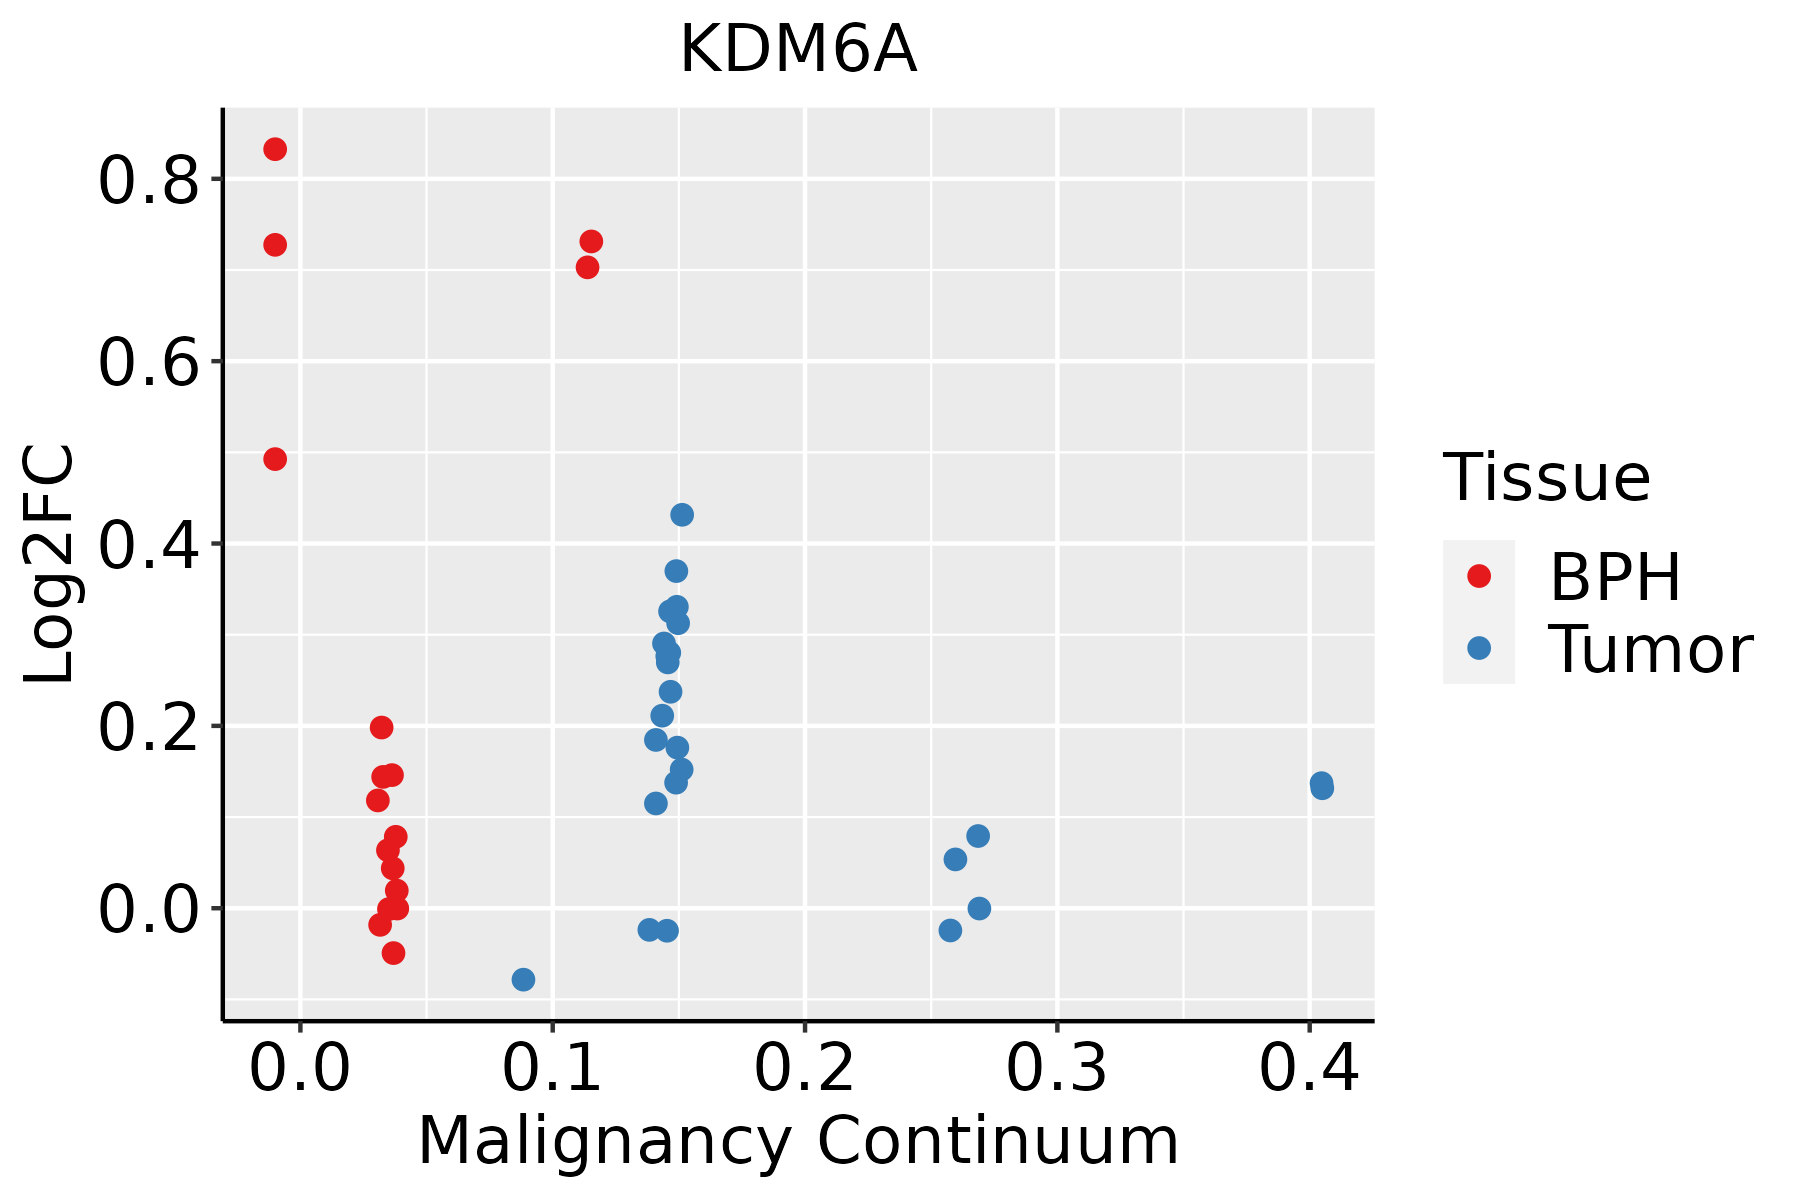 | BPH: Benign Prostatic Hyperplasia |
| Skin | 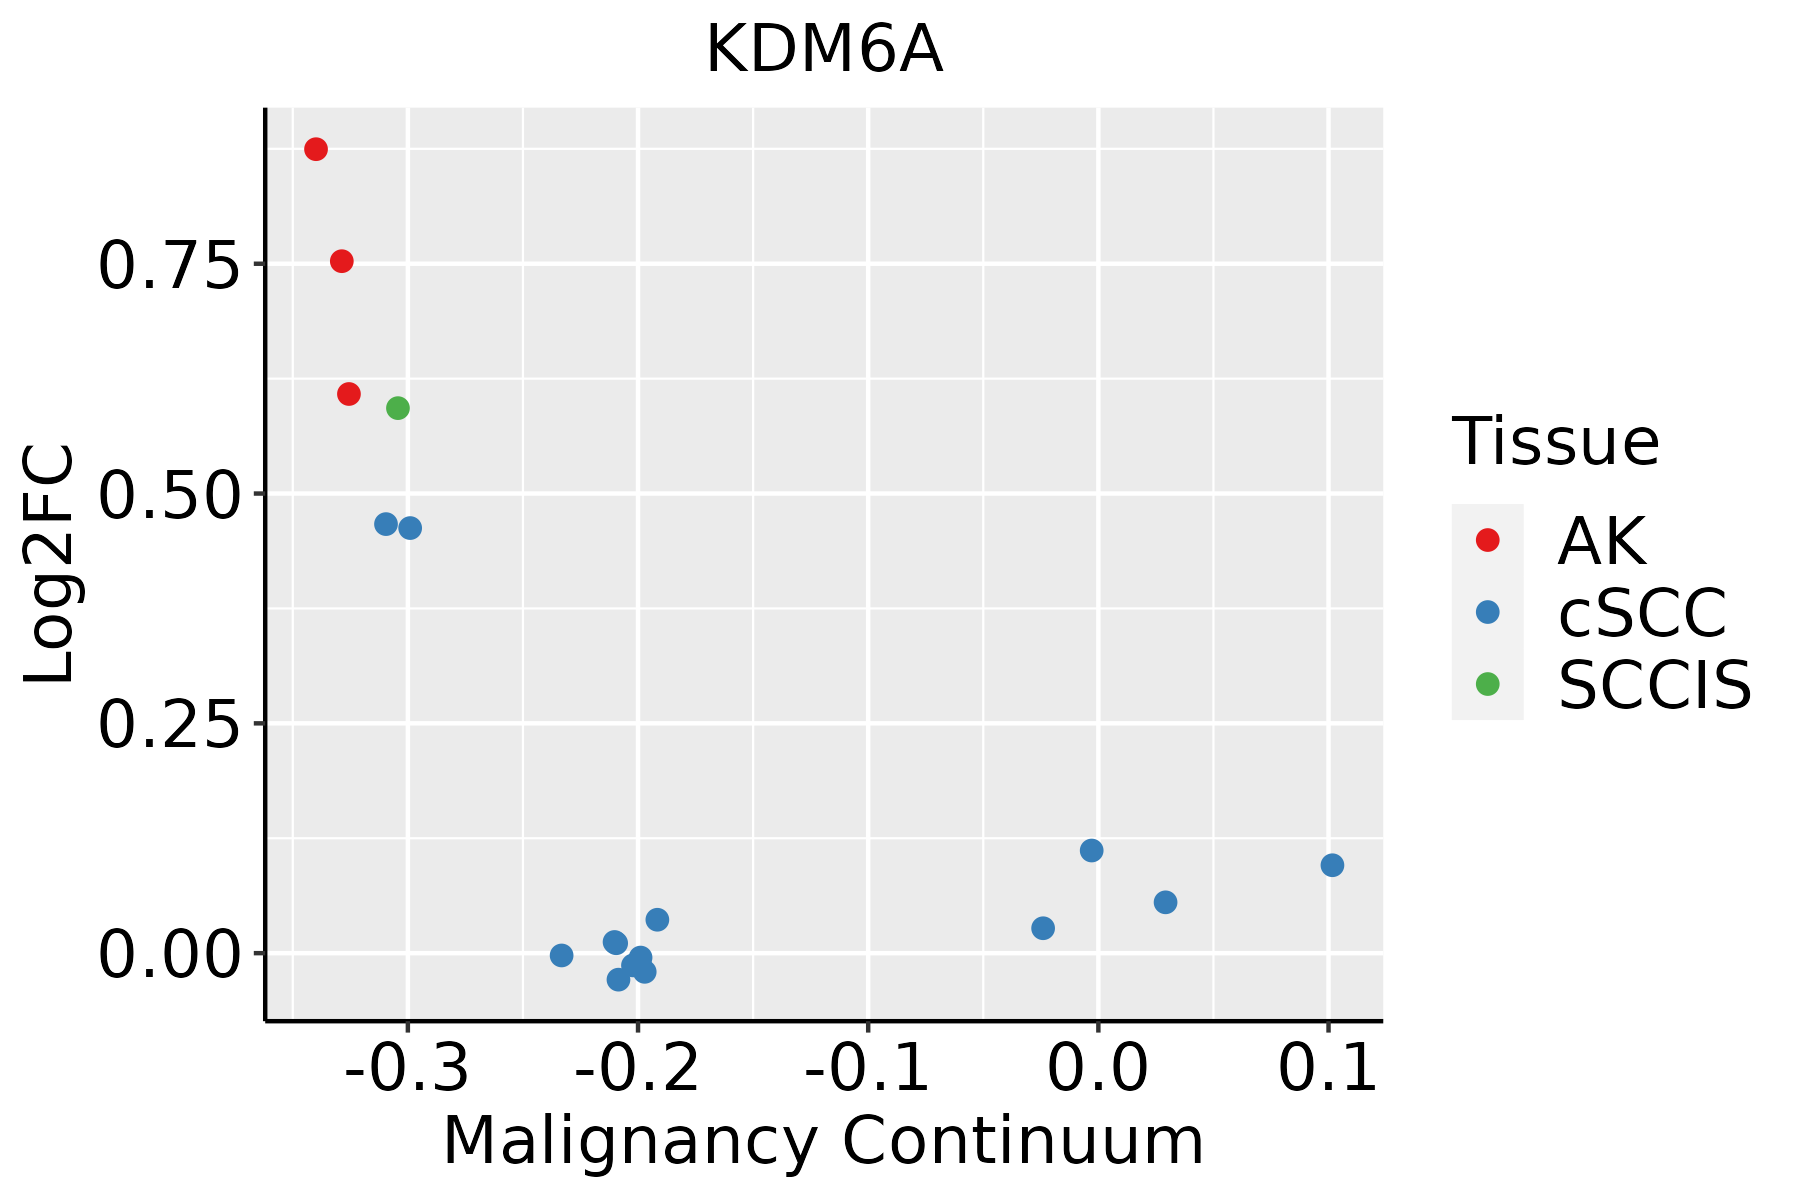 | AK: Actinic keratosis |
| cSCC: Cutaneous squamous cell carcinoma | ||
| SCCIS:squamous cell carcinoma in situ | ||
| Thyroid | 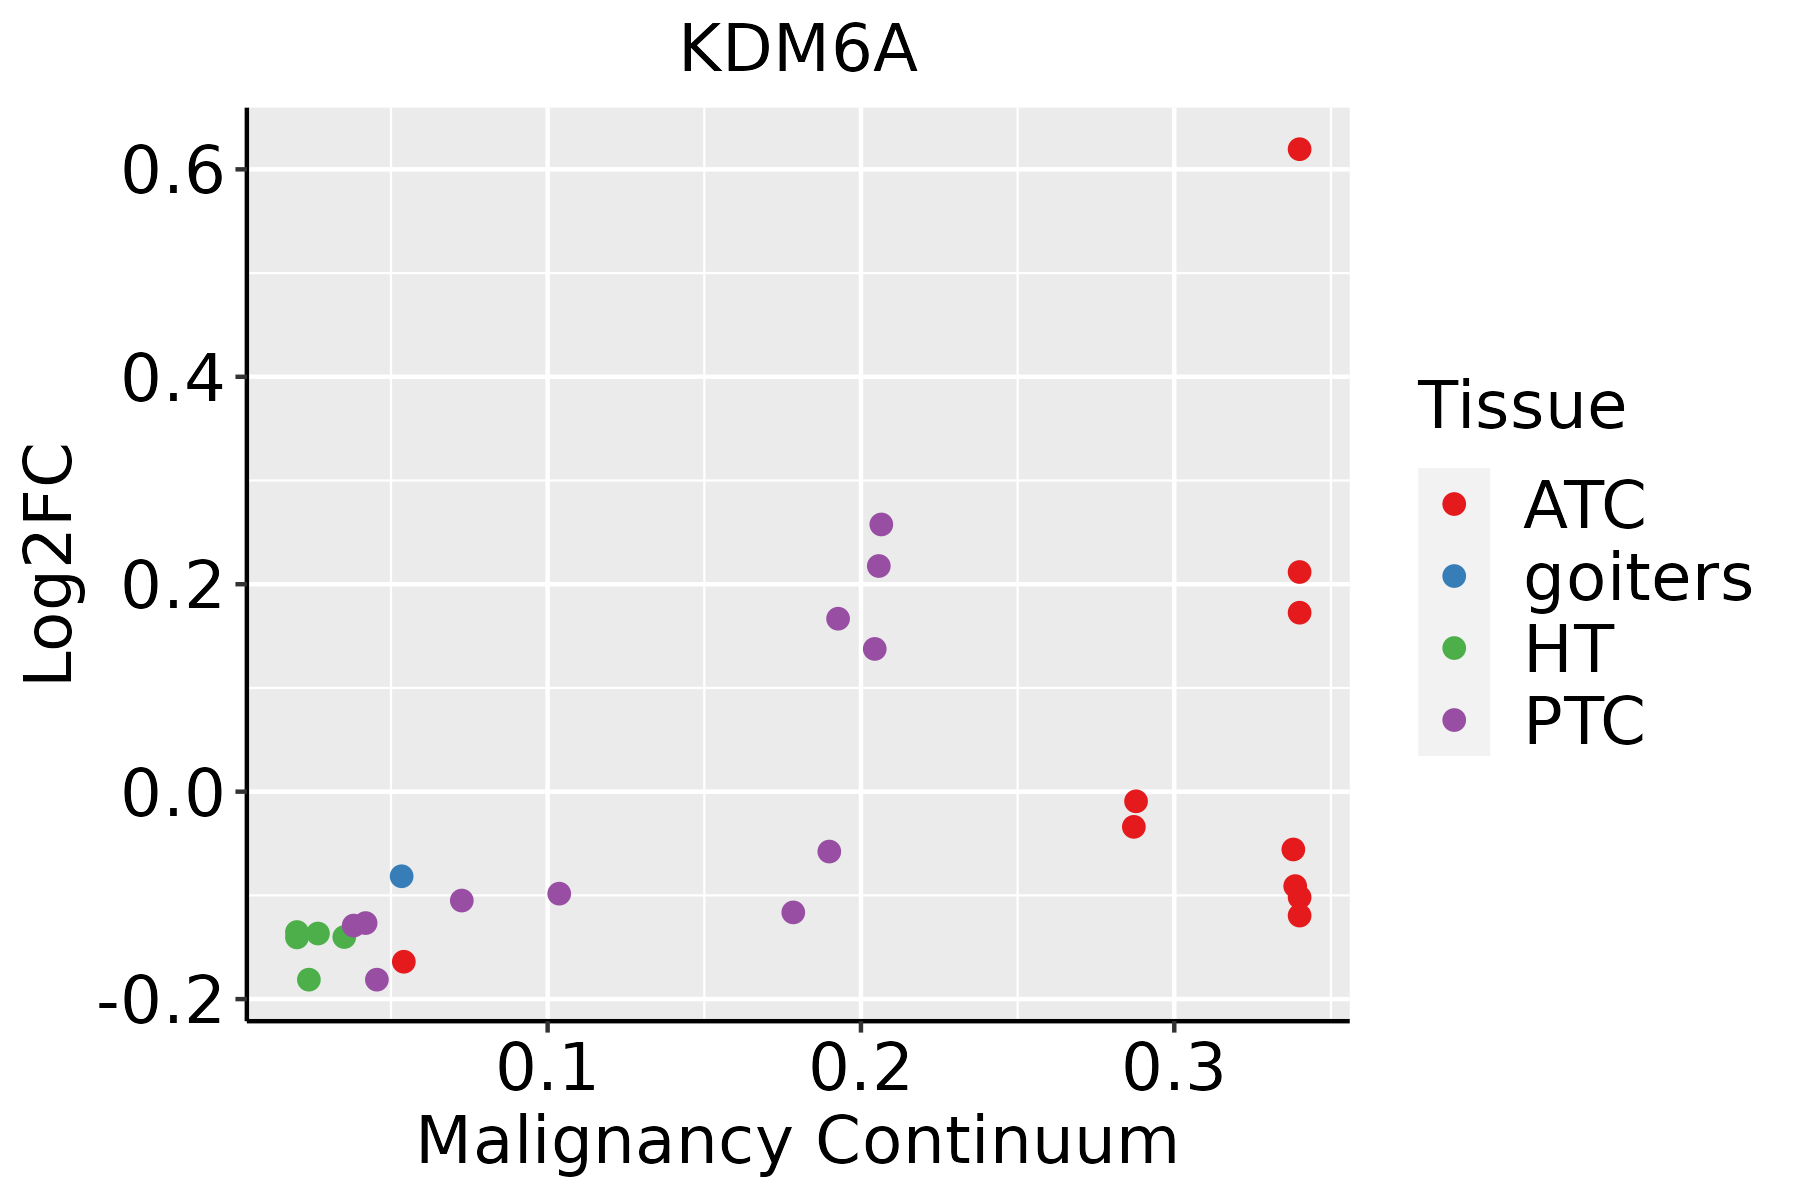 | ATC: Anaplastic thyroid cancer |
| HT: Hashimoto's thyroiditis | ||
| PTC: Papillary thyroid cancer |
| ∗log2FC in expression of this searched gene in stem-like cells from each diseased tissue sample relative to stem-like cells in normal samples in each tissue plotted against the malignancy continuum. Samples are colored based on if they are from different disease stage. |
Top |
Malignant transformation related pathway analysis |
| Find out the enriched GO biological processes and KEGG pathways involved in transition from healthy to precancer to cancer |
| Tissue | Disease Stage | Enriched GO biological Processes |
| Colorectum | AD |  |
| Colorectum | SER |  |
| Colorectum | MSS |  |
| Colorectum | MSI-H |  |
| Colorectum | FAP |  |
| ∗Top 15 enriched GO BP terms are showed in the bar plot of each disease state in each tissue. Each row represents a significant GO biological process which is colored according to the -log10(p.adjust). |
| Page: 1 2 3 4 5 6 7 8 9 |
| GO ID | Tissue | Disease Stage | Description | Gene Ratio | Bg Ratio | pvalue | p.adjust | Count |
| GO:00063257 | Cervix | CC | chromatin organization | 78/2311 | 409/18723 | 5.40e-05 | 8.02e-04 | 78 |
| GO:00165705 | Cervix | CC | histone modification | 84/2311 | 463/18723 | 1.70e-04 | 2.01e-03 | 84 |
| GO:00349685 | Cervix | CC | histone lysine methylation | 27/2311 | 115/18723 | 6.61e-04 | 6.09e-03 | 27 |
| GO:00165715 | Cervix | CC | histone methylation | 30/2311 | 141/18723 | 1.88e-03 | 1.39e-02 | 30 |
| GO:00180224 | Cervix | CC | peptidyl-lysine methylation | 28/2311 | 131/18723 | 2.43e-03 | 1.71e-02 | 28 |
| GO:00064795 | Cervix | CC | protein methylation | 36/2311 | 181/18723 | 2.46e-03 | 1.71e-02 | 36 |
| GO:00082135 | Cervix | CC | protein alkylation | 36/2311 | 181/18723 | 2.46e-03 | 1.71e-02 | 36 |
| GO:00063381 | Cervix | CC | chromatin remodeling | 45/2311 | 255/18723 | 8.33e-03 | 4.30e-02 | 45 |
| GO:00182054 | Cervix | CC | peptidyl-lysine modification | 62/2311 | 376/18723 | 1.04e-02 | 4.97e-02 | 62 |
| GO:0006325 | Colorectum | AD | chromatin organization | 119/3918 | 409/18723 | 4.85e-05 | 8.33e-04 | 119 |
| GO:0006338 | Colorectum | AD | chromatin remodeling | 70/3918 | 255/18723 | 7.44e-03 | 4.53e-02 | 70 |
| GO:00063251 | Colorectum | SER | chromatin organization | 89/2897 | 409/18723 | 4.15e-04 | 6.17e-03 | 89 |
| GO:00063252 | Colorectum | MSS | chromatin organization | 107/3467 | 409/18723 | 7.22e-05 | 1.21e-03 | 107 |
| GO:0016570 | Colorectum | MSS | histone modification | 113/3467 | 463/18723 | 8.37e-04 | 8.68e-03 | 113 |
| GO:00165701 | Colorectum | FAP | histone modification | 94/2622 | 463/18723 | 1.06e-04 | 1.76e-03 | 94 |
| GO:00063253 | Colorectum | FAP | chromatin organization | 84/2622 | 409/18723 | 1.62e-04 | 2.47e-03 | 84 |
| GO:0006479 | Colorectum | FAP | protein methylation | 39/2622 | 181/18723 | 3.60e-03 | 2.58e-02 | 39 |
| GO:0008213 | Colorectum | FAP | protein alkylation | 39/2622 | 181/18723 | 3.60e-03 | 2.58e-02 | 39 |
| GO:0034968 | Colorectum | FAP | histone lysine methylation | 27/2622 | 115/18723 | 4.23e-03 | 2.90e-02 | 27 |
| GO:0016571 | Colorectum | FAP | histone methylation | 31/2622 | 141/18723 | 6.47e-03 | 4.03e-02 | 31 |
| Page: 1 2 3 4 5 6 7 8 9 10 11 |
| Pathway ID | Tissue | Disease Stage | Description | Gene Ratio | Bg Ratio | pvalue | p.adjust | qvalue | Count |
| hsa05202 | Colorectum | FAP | Transcriptional misregulation in cancer | 45/1404 | 193/8465 | 9.19e-03 | 3.33e-02 | 2.03e-02 | 45 |
| hsa052021 | Colorectum | FAP | Transcriptional misregulation in cancer | 45/1404 | 193/8465 | 9.19e-03 | 3.33e-02 | 2.03e-02 | 45 |
| hsa052028 | Esophagus | ESCC | Transcriptional misregulation in cancer | 116/4205 | 193/8465 | 2.08e-03 | 5.95e-03 | 3.05e-03 | 116 |
| hsa0520213 | Esophagus | ESCC | Transcriptional misregulation in cancer | 116/4205 | 193/8465 | 2.08e-03 | 5.95e-03 | 3.05e-03 | 116 |
| hsa052026 | Lung | IAC | Transcriptional misregulation in cancer | 40/1053 | 193/8465 | 6.90e-04 | 5.90e-03 | 3.92e-03 | 40 |
| hsa0520211 | Lung | IAC | Transcriptional misregulation in cancer | 40/1053 | 193/8465 | 6.90e-04 | 5.90e-03 | 3.92e-03 | 40 |
| hsa052022 | Lung | AIS | Transcriptional misregulation in cancer | 39/961 | 193/8465 | 2.15e-04 | 2.41e-03 | 1.54e-03 | 39 |
| hsa052023 | Lung | AIS | Transcriptional misregulation in cancer | 39/961 | 193/8465 | 2.15e-04 | 2.41e-03 | 1.54e-03 | 39 |
| hsa052024 | Lung | MIAC | Transcriptional misregulation in cancer | 22/507 | 193/8465 | 2.64e-03 | 2.26e-02 | 1.64e-02 | 22 |
| hsa052025 | Lung | MIAC | Transcriptional misregulation in cancer | 22/507 | 193/8465 | 2.64e-03 | 2.26e-02 | 1.64e-02 | 22 |
| hsa052027 | Prostate | BPH | Transcriptional misregulation in cancer | 53/1718 | 193/8465 | 9.56e-03 | 2.92e-02 | 1.81e-02 | 53 |
| hsa0520212 | Prostate | BPH | Transcriptional misregulation in cancer | 53/1718 | 193/8465 | 9.56e-03 | 2.92e-02 | 1.81e-02 | 53 |
| hsa0520221 | Prostate | Tumor | Transcriptional misregulation in cancer | 59/1791 | 193/8465 | 1.22e-03 | 5.26e-03 | 3.26e-03 | 59 |
| hsa0520231 | Prostate | Tumor | Transcriptional misregulation in cancer | 59/1791 | 193/8465 | 1.22e-03 | 5.26e-03 | 3.26e-03 | 59 |
| Page: 1 |
Top |
Cell-cell communication analysis |
| Identification of potential cell-cell interactions between two cell types and their ligand-receptor pairs for different disease states |
| Ligand | Receptor | LRpair | Pathway | Tissue | Disease Stage |
| Page: 1 |
Top |
Single-cell gene regulatory network inference analysis |
| Find out the significant the regulons (TFs) and the target genes of each regulon across cell types for different disease states |
| TF | Cell Type | Tissue | Disease Stage | Target Gene | RSS | Regulon Activity |
| ∗The dot plots of a searched regulon are shown for all cell subpopulations in each disease state of each tissue based on the regulon specific score inferred using pySCENIC and by calculating the average expression. |
| Page: 1 |
Top |
Somatic mutation of malignant transformation related genes |
| Annotation of somatic variants for genes involved in malignant transformation |
| Hugo Symbol | Variant Class | Variant Classification | dbSNP RS | HGVSc | HGVSp | HGVSp Short | SWISSPROT | BIOTYPE | SIFT | PolyPhen | Tumor Sample Barcode | Tissue | Histology | Sex | Age | Stage | Therapy Types | Drugs | Outcome |
| KDM6A | SNV | Missense_Mutation | novel | c.3288N>T | p.Trp1096Cys | p.W1096C | O15550 | protein_coding | deleterious(0) | possibly_damaging(0.897) | TCGA-3C-AALI-01 | Breast | breast invasive carcinoma | Female | <65 | I/II | Unspecific | Poly E | Complete Response |
| KDM6A | SNV | Missense_Mutation | c.329N>G | p.Pro110Arg | p.P110R | O15550 | protein_coding | deleterious(0.04) | benign(0.424) | TCGA-AC-A23H-01 | Breast | breast invasive carcinoma | Female | >=65 | I/II | Unknown | Unknown | PD | |
| KDM6A | SNV | Missense_Mutation | c.3356T>C | p.Leu1119Pro | p.L1119P | O15550 | protein_coding | deleterious(0) | possibly_damaging(0.905) | TCGA-AO-A12A-01 | Breast | breast invasive carcinoma | Female | <65 | I/II | Chemotherapy | cyclophosphamide | SD | |
| KDM6A | SNV | Missense_Mutation | c.3452N>G | p.Asn1151Ser | p.N1151S | O15550 | protein_coding | deleterious(0) | possibly_damaging(0.734) | TCGA-BH-A0HA-01 | Breast | breast invasive carcinoma | Female | <65 | I/II | Unknown | Unknown | SD | |
| KDM6A | SNV | Missense_Mutation | c.3259N>G | p.Asn1087Asp | p.N1087D | O15550 | protein_coding | deleterious(0) | benign(0.234) | TCGA-BH-A18G-01 | Breast | breast invasive carcinoma | Female | >=65 | I/II | Unknown | Unknown | SD | |
| KDM6A | SNV | Missense_Mutation | c.3766N>C | p.Tyr1256His | p.Y1256H | O15550 | protein_coding | deleterious(0) | probably_damaging(0.998) | TCGA-BH-A18G-01 | Breast | breast invasive carcinoma | Female | >=65 | I/II | Unknown | Unknown | SD | |
| KDM6A | SNV | Missense_Mutation | c.1592N>T | p.Ser531Leu | p.S531L | O15550 | protein_coding | deleterious(0) | benign(0.036) | TCGA-C8-A26Y-01 | Breast | breast invasive carcinoma | Female | >=65 | I/II | Unknown | Unknown | SD | |
| KDM6A | SNV | Missense_Mutation | c.781N>C | p.Asp261His | p.D261H | O15550 | protein_coding | deleterious(0) | probably_damaging(0.957) | TCGA-E9-A1RF-01 | Breast | breast invasive carcinoma | Female | >=65 | III/IV | Hormone Therapy | tamoxiphen | SD | |
| KDM6A | SNV | Missense_Mutation | novel | c.616G>A | p.Glu206Lys | p.E206K | O15550 | protein_coding | deleterious(0) | probably_damaging(0.95) | TCGA-UU-A93S-01 | Breast | breast invasive carcinoma | Female | <65 | III/IV | Unknown | Unknown | PD |
| KDM6A | insertion | Frame_Shift_Ins | novel | c.3154_3155insA | p.Arg1054LysfsTer5 | p.R1054Kfs*5 | O15550 | protein_coding | TCGA-A2-A0CK-01 | Breast | breast invasive carcinoma | Female | <65 | III/IV | Chemotherapy | taxotere | CR |
| Page: 1 2 3 4 5 6 7 8 9 10 11 12 13 14 |
Top |
Related drugs of malignant transformation related genes |
| Identification of chemicals and drugs interact with genes involved in malignant transfromation |
| (DGIdb 4.0) |
| Entrez ID | Symbol | Category | Interaction Types | Drug Claim Name | Drug Name | PMIDs |
| 7403 | KDM6A | ENZYME, CLINICALLY ACTIONABLE | Tazemetostat | TAZEMETOSTAT | ||
| 7403 | KDM6A | ENZYME, CLINICALLY ACTIONABLE | inhibitor | 178103606 | ||
| 7403 | KDM6A | ENZYME, CLINICALLY ACTIONABLE | inhibitor | 381118851 | ||
| 7403 | KDM6A | ENZYME, CLINICALLY ACTIONABLE | inhibitor | 310264759 | ||
| 7403 | KDM6A | ENZYME, CLINICALLY ACTIONABLE | GSK343 | 28228601 |
| Page: 1 |

Copyright 2023-Present -The University of Texas Health Science Center at Houston |