| Tissue | Expression Dynamics | Abbreviation |
| Cervix | 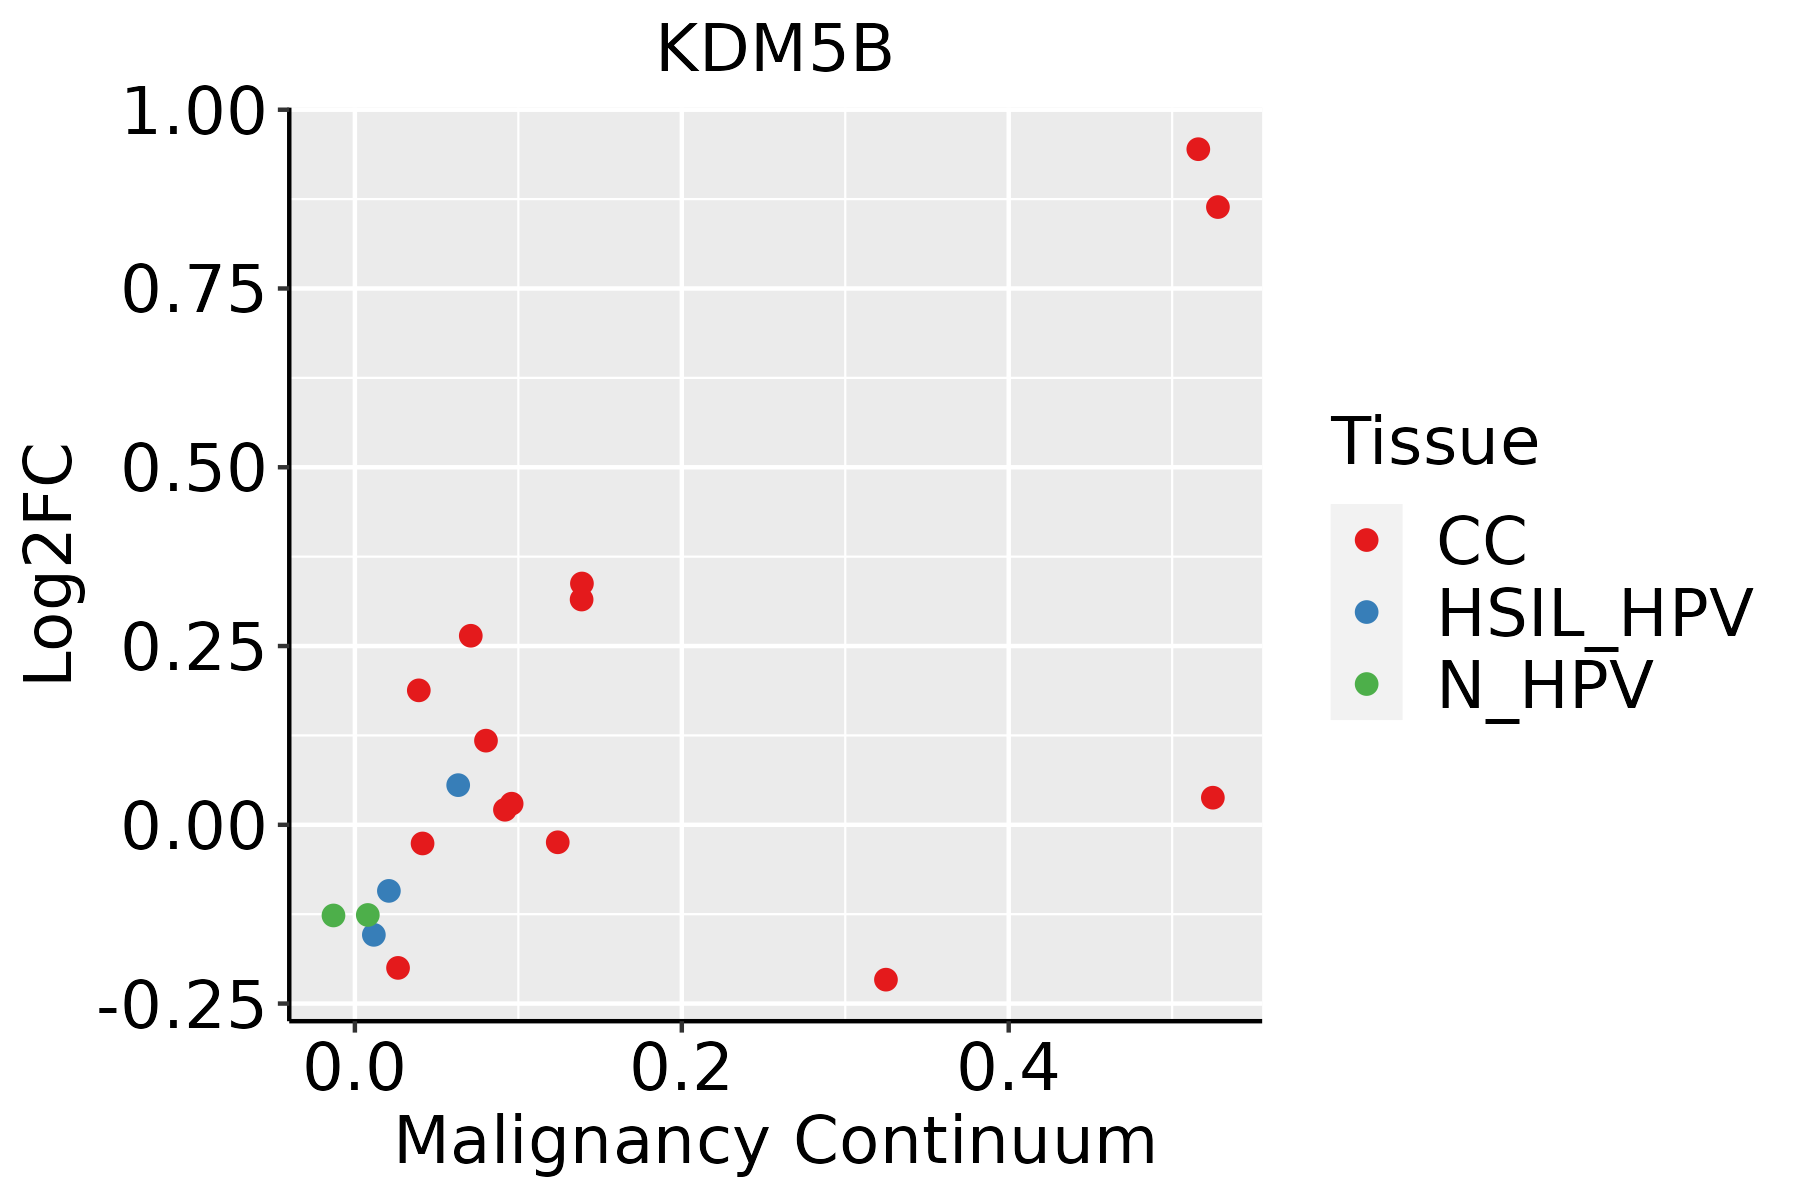 | CC: Cervix cancer |
| HSIL_HPV: HPV-infected high-grade squamous intraepithelial lesions |
| N_HPV: HPV-infected normal cervix |
| Colorectum (GSE201348) | 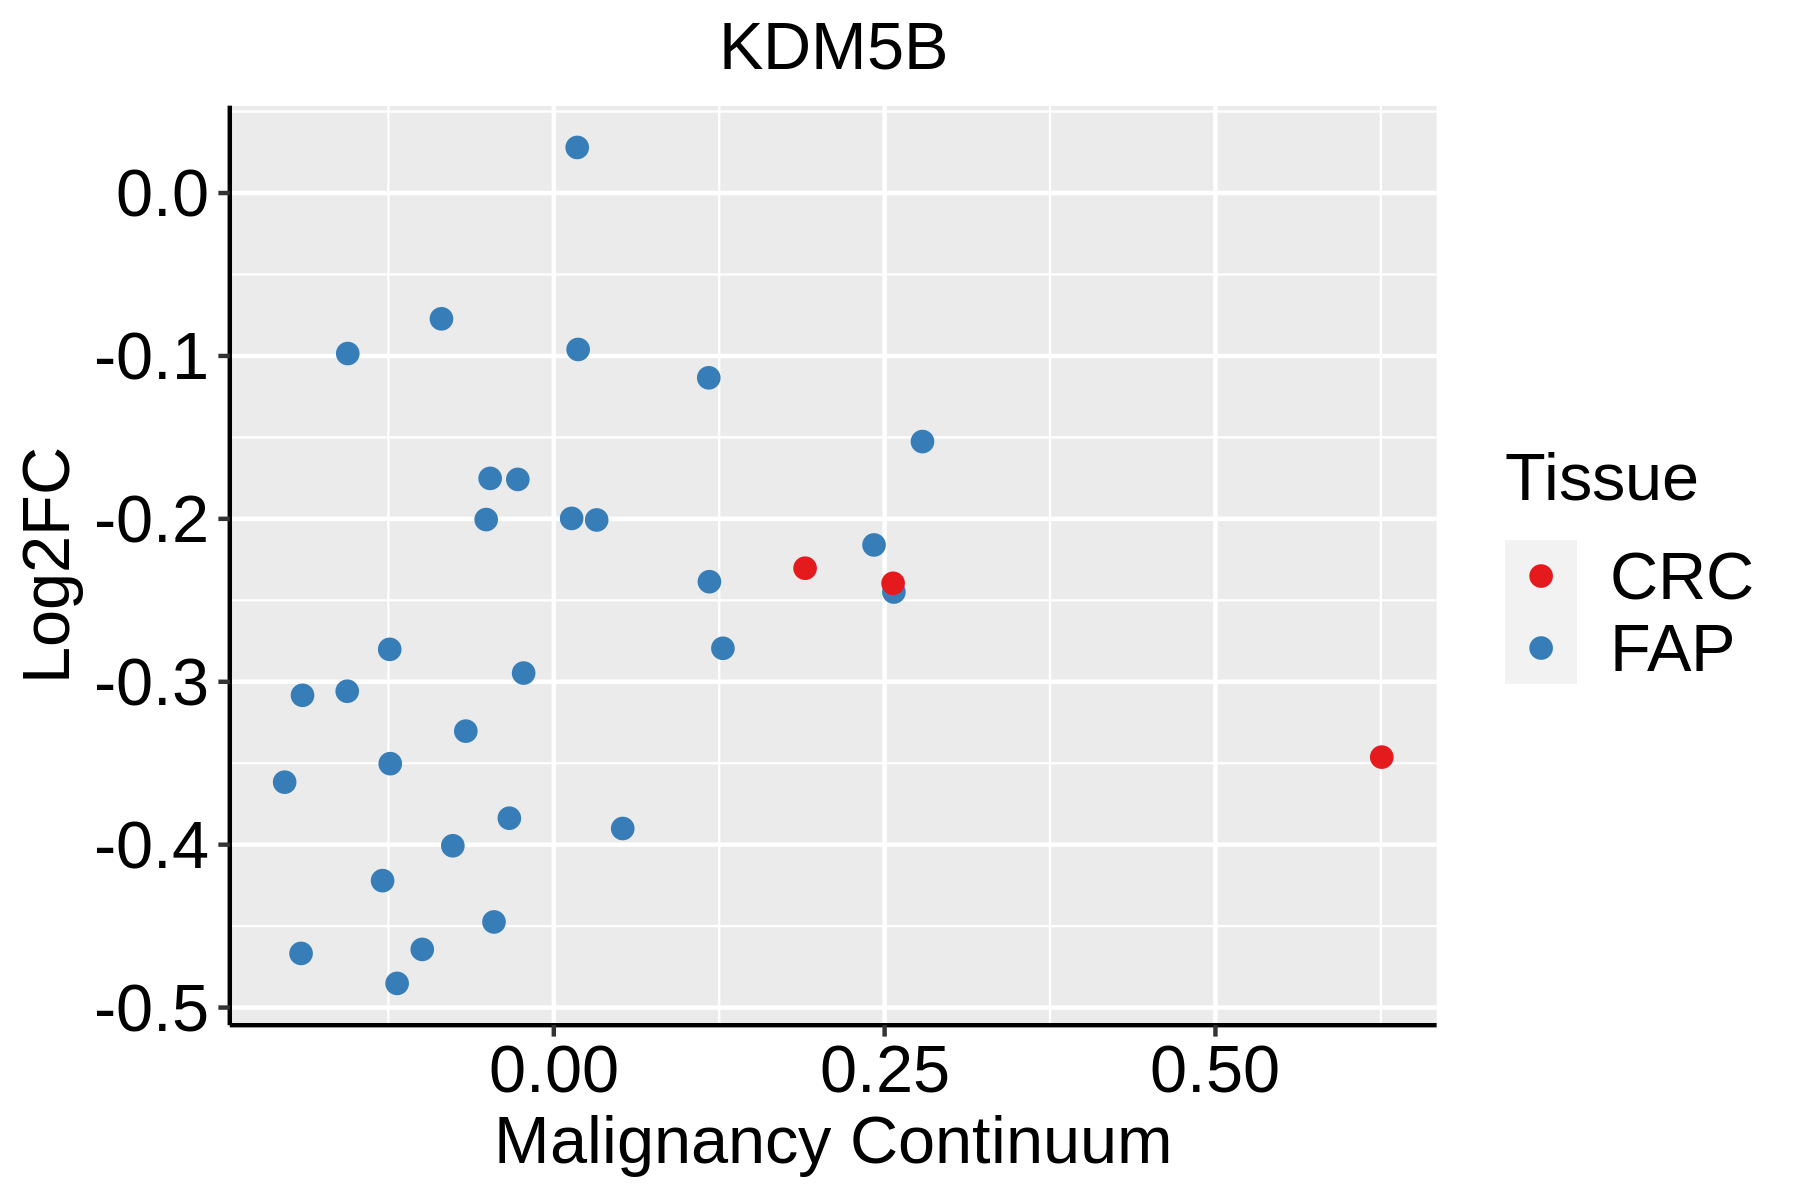 | FAP: Familial adenomatous polyposis |
| CRC: Colorectal cancer |
| Colorectum (HTA11) |  | AD: Adenomas |
| SER: Sessile serrated lesions |
| MSI-H: Microsatellite-high colorectal cancer |
| MSS: Microsatellite stable colorectal cancer |
| Endometrium |  | AEH: Atypical endometrial hyperplasia |
| EEC: Endometrioid Cancer |
| Esophagus |  | ESCC: Esophageal squamous cell carcinoma |
| HGIN: High-grade intraepithelial neoplasias |
| LGIN: Low-grade intraepithelial neoplasias |
| Liver |  | HCC: Hepatocellular carcinoma |
| NAFLD: Non-alcoholic fatty liver disease |
| Lung | 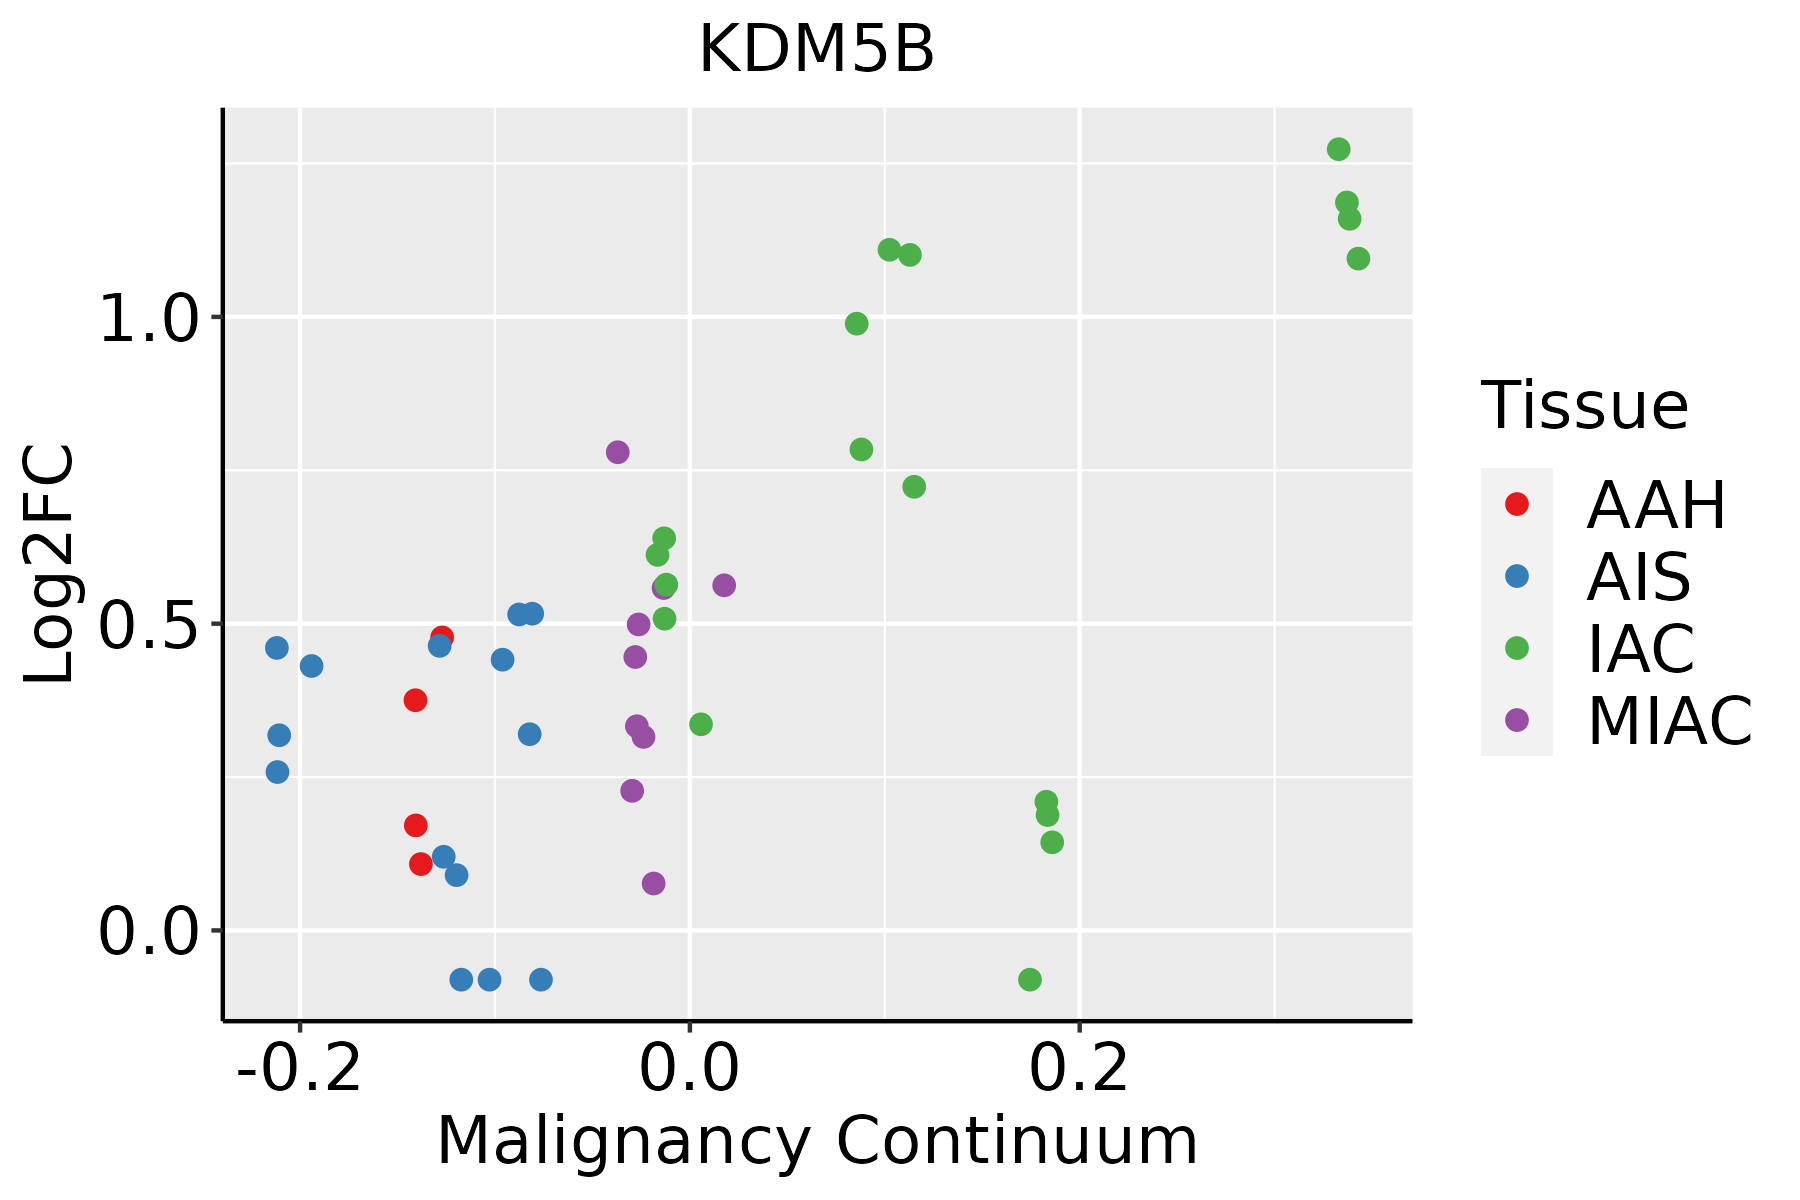 | AAH: Atypical adenomatous hyperplasia |
| AIS: Adenocarcinoma in situ |
| IAC: Invasive lung adenocarcinoma |
| MIA: Minimally invasive adenocarcinoma |
| Oral Cavity | 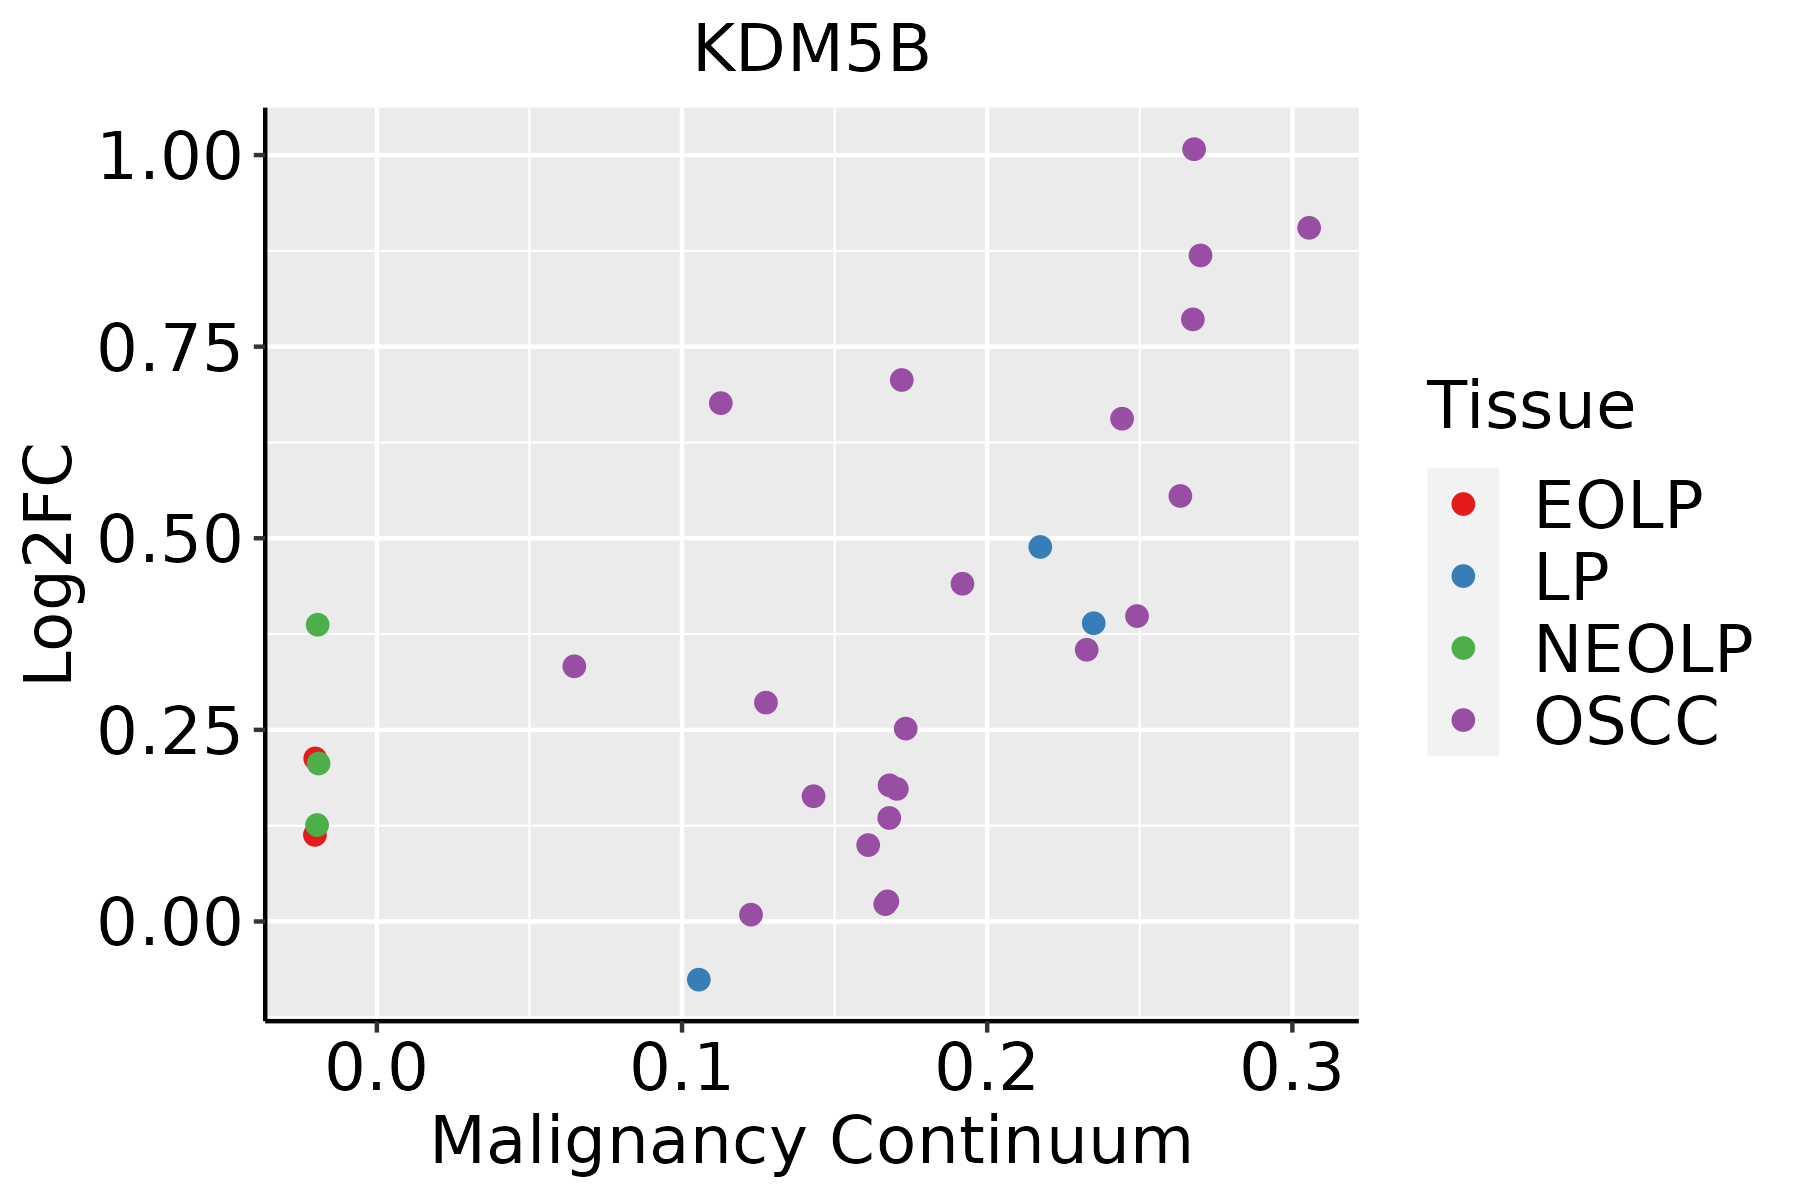 | EOLP: Erosive Oral lichen planus |
| LP: leukoplakia |
| NEOLP: Non-erosive oral lichen planus |
| OSCC: Oral squamous cell carcinoma |
| Prostate |  | BPH: Benign Prostatic Hyperplasia |
| Skin |  | AK: Actinic keratosis |
| cSCC: Cutaneous squamous cell carcinoma |
| SCCIS:squamous cell carcinoma in situ |
| Thyroid |  | ATC: Anaplastic thyroid cancer |
| HT: Hashimoto's thyroiditis |
| PTC: Papillary thyroid cancer |
| GO ID | Tissue | Disease Stage | Description | Gene Ratio | Bg Ratio | pvalue | p.adjust | Count |
| GO:00506737 | Cervix | CC | epithelial cell proliferation | 98/2311 | 437/18723 | 2.01e-09 | 2.15e-07 | 98 |
| GO:00506787 | Cervix | CC | regulation of epithelial cell proliferation | 83/2311 | 381/18723 | 1.31e-07 | 6.42e-06 | 83 |
| GO:00614588 | Cervix | CC | reproductive system development | 87/2311 | 427/18723 | 1.37e-06 | 4.55e-05 | 87 |
| GO:00486088 | Cervix | CC | reproductive structure development | 86/2311 | 424/18723 | 1.90e-06 | 5.97e-05 | 86 |
| GO:00485118 | Cervix | CC | rhythmic process | 65/2311 | 298/18723 | 2.79e-06 | 8.04e-05 | 65 |
| GO:004873210 | Cervix | CC | gland development | 84/2311 | 436/18723 | 1.93e-05 | 3.54e-04 | 84 |
| GO:00506794 | Cervix | CC | positive regulation of epithelial cell proliferation | 47/2311 | 207/18723 | 2.18e-05 | 3.90e-04 | 47 |
| GO:00063257 | Cervix | CC | chromatin organization | 78/2311 | 409/18723 | 5.40e-05 | 8.02e-04 | 78 |
| GO:00335984 | Cervix | CC | mammary gland epithelial cell proliferation | 11/2311 | 26/18723 | 1.29e-04 | 1.60e-03 | 11 |
| GO:00165705 | Cervix | CC | histone modification | 84/2311 | 463/18723 | 1.70e-04 | 2.01e-03 | 84 |
| GO:00096369 | Cervix | CC | response to toxic substance | 52/2311 | 262/18723 | 3.34e-04 | 3.52e-03 | 52 |
| GO:00605606 | Cervix | CC | developmental growth involved in morphogenesis | 46/2311 | 234/18723 | 8.82e-04 | 7.63e-03 | 46 |
| GO:00097915 | Cervix | CC | post-embryonic development | 20/2311 | 80/18723 | 1.40e-03 | 1.10e-02 | 20 |
| GO:19908234 | Cervix | CC | response to leukemia inhibitory factor | 22/2311 | 95/18723 | 2.40e-03 | 1.70e-02 | 22 |
| GO:00605626 | Cervix | CC | epithelial tube morphogenesis | 57/2311 | 325/18723 | 3.79e-03 | 2.41e-02 | 57 |
| GO:19908304 | Cervix | CC | cellular response to leukemia inhibitory factor | 21/2311 | 94/18723 | 4.68e-03 | 2.82e-02 | 21 |
| GO:00308797 | Cervix | CC | mammary gland development | 28/2311 | 137/18723 | 4.74e-03 | 2.83e-02 | 28 |
| GO:00017636 | Cervix | CC | morphogenesis of a branching structure | 37/2311 | 196/18723 | 5.36e-03 | 3.10e-02 | 37 |
| GO:0150063 | Cervix | CC | visual system development | 63/2311 | 375/18723 | 6.58e-03 | 3.65e-02 | 63 |
| GO:0001654 | Cervix | CC | eye development | 62/2311 | 371/18723 | 7.83e-03 | 4.13e-02 | 62 |
| TF | Cell Type | Tissue | Disease Stage | Target Gene | RSS | Regulon Activity |
| KDM5B | MES | Cervix | CC | AC016831.1,SNAPC1,ITPRID2, etc. | 7.14e-01 |  |
| KDM5B | CAF | Pancreas | ADJ | GPR137C,ZNF335,TCEAL5, etc. | 7.22e-03 |  |
| KDM5B | PSC | Pancreas | Healthy | GPR137C,ZNF335,TCEAL5, etc. | 2.33e-02 |  |
| KDM5B | INCAF | Pancreas | Healthy | GPR137C,ZNF335,TCEAL5, etc. | 1.70e-02 | |
| KDM5B | MSC | Pancreas | PanIN | GPR137C,ZNF335,TCEAL5, etc. | 3.96e-02 |  |
| Hugo Symbol | Variant Class | Variant Classification | dbSNP RS | HGVSc | HGVSp | HGVSp Short | SWISSPROT | BIOTYPE | SIFT | PolyPhen | Tumor Sample Barcode | Tissue | Histology | Sex | Age | Stage | Therapy Types | Drugs | Outcome |
| KDM5B | SNV | Missense_Mutation | rs777450660 | c.378N>C | p.Lys126Asn | p.K126N | Q9UGL1 | protein_coding | deleterious(0) | probably_damaging(0.999) | TCGA-3C-AALI-01 | Breast | breast invasive carcinoma | Female | <65 | I/II | Unspecific | Poly E | Complete Response |
| KDM5B | SNV | Missense_Mutation | | c.365A>G | p.His122Arg | p.H122R | Q9UGL1 | protein_coding | deleterious(0.05) | possibly_damaging(0.783) | TCGA-A1-A0SF-01 | Breast | breast invasive carcinoma | Female | <65 | I/II | Chemotherapy | tc | SD |
| KDM5B | SNV | Missense_Mutation | | c.3241N>G | p.Arg1081Gly | p.R1081G | Q9UGL1 | protein_coding | tolerated(0.07) | benign(0.081) | TCGA-A1-A0SO-01 | Breast | breast invasive carcinoma | Female | >=65 | I/II | Chemotherapy | | SD |
| KDM5B | SNV | Missense_Mutation | | c.2530N>C | p.Glu844Gln | p.E844Q | Q9UGL1 | protein_coding | deleterious(0.03) | possibly_damaging(0.698) | TCGA-A2-A0YH-01 | Breast | breast invasive carcinoma | Female | <65 | III/IV | Chemotherapy | adriamycin | SD |
| KDM5B | SNV | Missense_Mutation | | c.1762N>G | p.Leu588Val | p.L588V | Q9UGL1 | protein_coding | deleterious(0) | probably_damaging(0.997) | TCGA-A7-A0CE-01 | Breast | breast invasive carcinoma | Female | <65 | I/II | Chemotherapy | adriamycin | SD |
| KDM5B | SNV | Missense_Mutation | | c.257G>A | p.Arg86His | p.R86H | Q9UGL1 | protein_coding | deleterious(0.01) | probably_damaging(0.987) | TCGA-A8-A08S-01 | Breast | breast invasive carcinoma | Female | >=65 | I/II | Hormone Therapy | anastrozole | SD |
| KDM5B | SNV | Missense_Mutation | rs760532266 | c.2134N>A | p.Asp712Asn | p.D712N | Q9UGL1 | protein_coding | tolerated(0.18) | benign(0.311) | TCGA-AC-A5XS-01 | Breast | breast invasive carcinoma | Female | >=65 | I/II | Hormone Therapy | femara | SD |
| KDM5B | SNV | Missense_Mutation | rs757818490 | c.1817G>A | p.Arg606Gln | p.R606Q | Q9UGL1 | protein_coding | deleterious(0) | possibly_damaging(0.754) | TCGA-AN-A046-01 | Breast | breast invasive carcinoma | Female | >=65 | I/II | Unknown | Unknown | SD |
| KDM5B | SNV | Missense_Mutation | rs370972925 | c.881N>A | p.Arg294His | p.R294H | Q9UGL1 | protein_coding | deleterious(0.01) | probably_damaging(0.972) | TCGA-AR-A250-01 | Breast | breast invasive carcinoma | Female | <65 | I/II | Chemotherapy | doxorubicin | SD |
| KDM5B | SNV | Missense_Mutation | novel | c.1596N>G | p.Phe532Leu | p.F532L | Q9UGL1 | protein_coding | deleterious(0) | probably_damaging(0.997) | TCGA-AR-A2LE-01 | Breast | breast invasive carcinoma | Female | >=65 | I/II | Hormone Therapy | tamoxiphen | PD |


