Schematic overview of the cellular and molecular mechanisms involved in the cancer progression, including the proposed cellular and molecular mechanisms in cancer cells trajectory. AT1: alveolar type 1 cells; AT2: alveolar type 2 cells; AAH: atypical adenomatous hyperplasia; AIS: adenocarcinoma in situ; MIA: minimally invasive adenocarcinoma; IA: invasive adenocarcinoma; EMT: epithelial-mesenchymal transition

Home

Download

Statistics

Help

Contact

Center for Computational Systems Medicine
leaf

Gene summary

leaf

Malignant transformation analysis

leaf

Malignant transformation related pathway analysis

leaf

Cell-cell communication analysis

leaf

Single-cell gene regulatory network inference analysis

leaf

Somatic mutation of malignant transformation related genes

leaf

Related drugs of malignant transformation related genes

Gene: KDM5A

Gene summary for KDM5A

check button Gene summary.

Gene informationSpeciesHuman
Gene symbol

KDM5A

Gene ID

5927

Gene namelysine demethylase 5A
Gene AliasRBBP-2
Cytomap12p13.33
Gene Typeprotein-coding
GO ID

GO:0000003

UniProtAcc

P29375


Top

Malignant transformation analysis

check button Identification of the aberrant gene expression in precancerous and cancerous lesions by comparing the gene expression of stem-like cells in diseased tissues with normal stem cells
check button Malignant transformation involving gene list.
Entrez IDSymbolReplicatesSpeciesOrganTissueAdj P-valueLog2FCMalignancy
5927KDM5ACA_HPV_1HumanCervixCC6.57e-04-4.03e-020.0264
5927KDM5ACCI_2HumanCervixCC1.05e-027.11e-010.5249
5927KDM5ACCI_3HumanCervixCC7.68e-101.00e+000.516
5927KDM5AL1HumanCervixCC1.60e-05-3.24e-010.0802
5927KDM5ALZE2THumanEsophagusESCC2.35e-077.27e-010.082
5927KDM5ALZE4THumanEsophagusESCC3.15e-143.95e-010.0811
5927KDM5ALZE7THumanEsophagusESCC2.61e-077.25e-010.0667
5927KDM5ALZE8THumanEsophagusESCC3.38e-135.93e-010.067
5927KDM5ALZE20THumanEsophagusESCC1.00e-043.68e-010.0662
5927KDM5ALZE22THumanEsophagusESCC1.23e-022.99e-010.068
5927KDM5ALZE24THumanEsophagusESCC3.92e-094.73e-010.0596
5927KDM5ALZE21THumanEsophagusESCC3.23e-053.43e-010.0655
5927KDM5AP1T-EHumanEsophagusESCC7.68e-087.55e-010.0875
5927KDM5AP2T-EHumanEsophagusESCC1.53e-541.08e+000.1177
5927KDM5AP4T-EHumanEsophagusESCC3.96e-371.04e+000.1323
5927KDM5AP5T-EHumanEsophagusESCC1.70e-223.51e-010.1327
5927KDM5AP8T-EHumanEsophagusESCC5.30e-306.96e-010.0889
5927KDM5AP9T-EHumanEsophagusESCC2.44e-082.24e-010.1131
5927KDM5AP10T-EHumanEsophagusESCC6.36e-357.71e-010.116
5927KDM5AP11T-EHumanEsophagusESCC1.62e-125.50e-010.1426
Page: 1 2 3 4 5 6 7 8 

check button Transcriptomic changes along malignancy continuum.
TissueExpression DynamicsAbbreviation
CervixThe image shows the transcriptomic changes along malignancy continuum.log2FC in expression of this searched gene in stem-like cells from each diseased tissue sample relative to stem-like cells in normal samples in each tissue plotted against the malignancy continuum. Samples are colored based on if they are from different disease stage.CC: Cervix cancer
HSIL_HPV: HPV-infected high-grade squamous intraepithelial lesions
N_HPV: HPV-infected normal cervix
EsophagusThe image shows the transcriptomic changes along malignancy continuum.log2FC in expression of this searched gene in stem-like cells from each diseased tissue sample relative to stem-like cells in normal samples in each tissue plotted against the malignancy continuum. Samples are colored based on if they are from different disease stage.
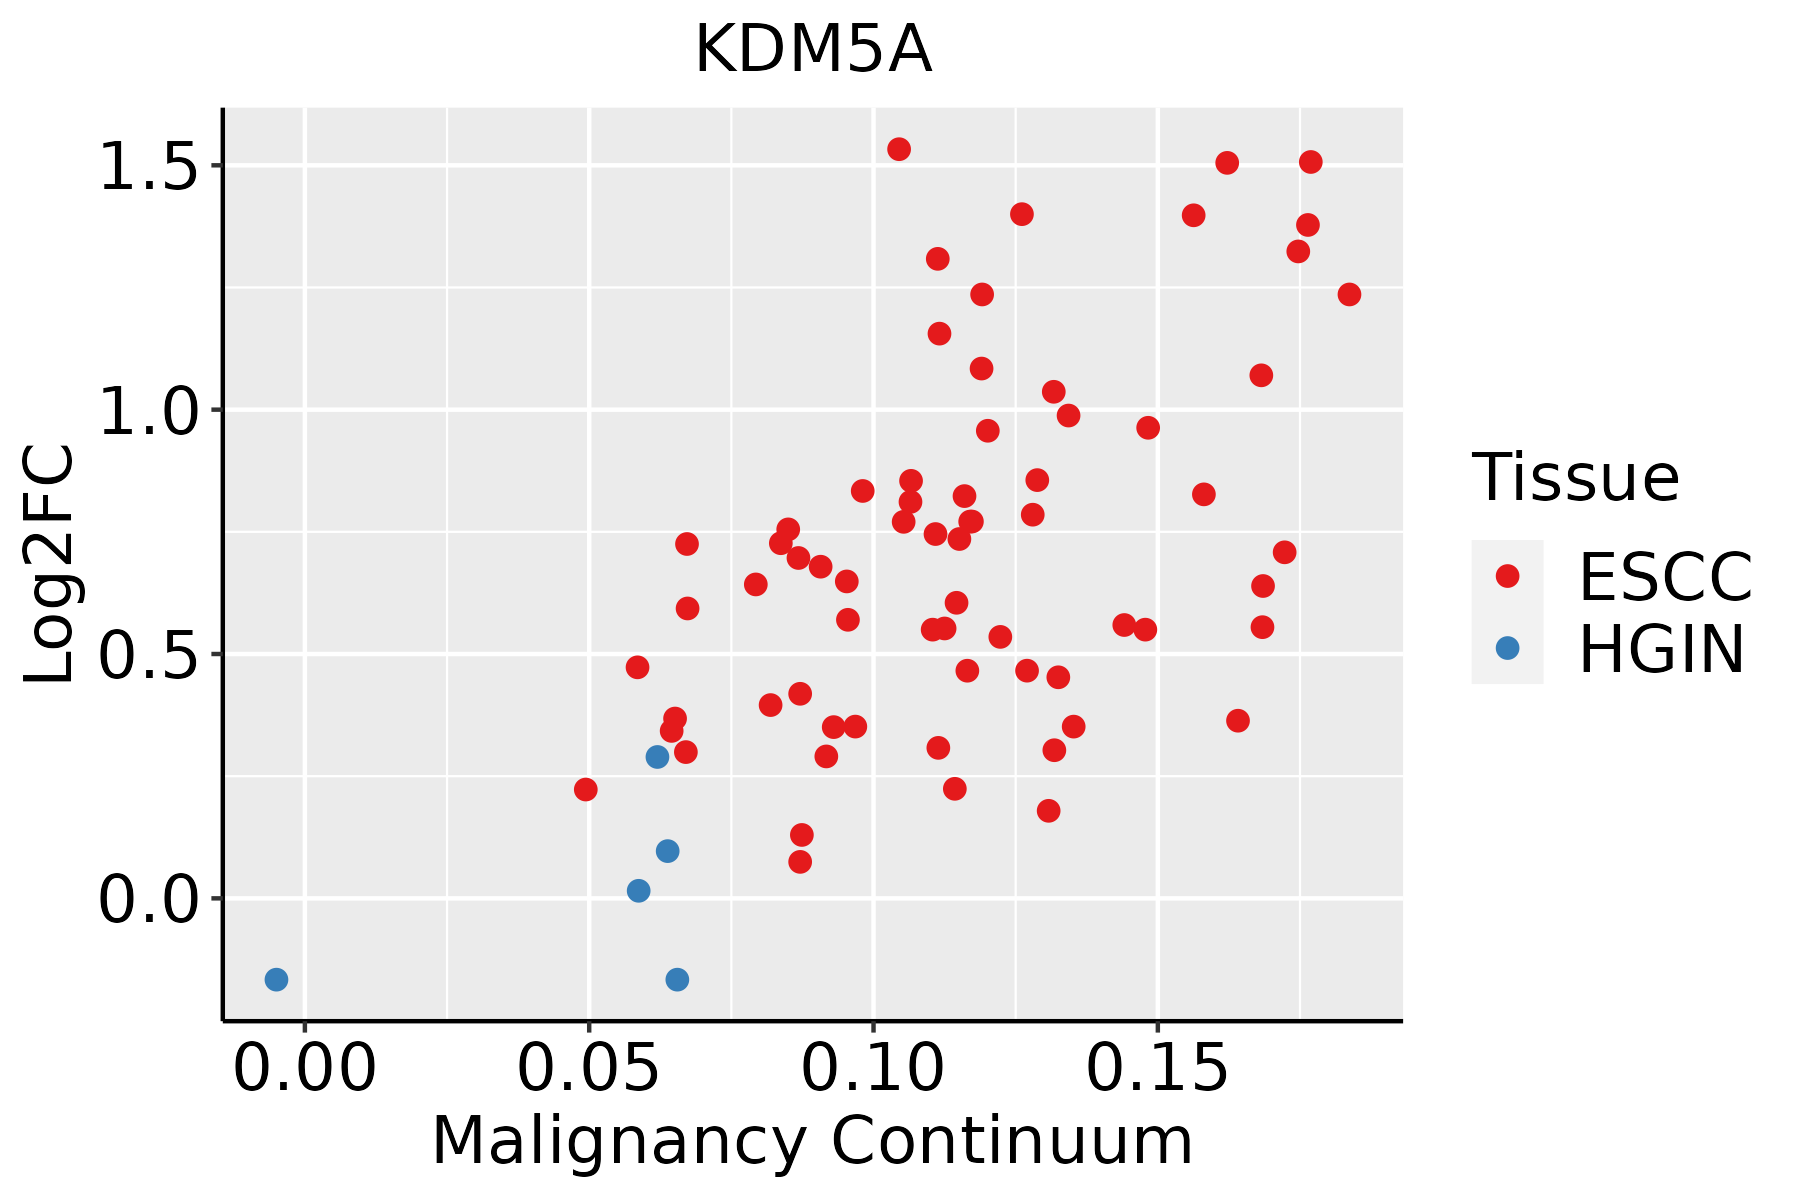
ESCC: Esophageal squamous cell carcinoma
HGIN: High-grade intraepithelial neoplasias
LGIN: Low-grade intraepithelial neoplasias
LiverThe image shows the transcriptomic changes along malignancy continuum.log2FC in expression of this searched gene in stem-like cells from each diseased tissue sample relative to stem-like cells in normal samples in each tissue plotted against the malignancy continuum. Samples are colored based on if they are from different disease stage.
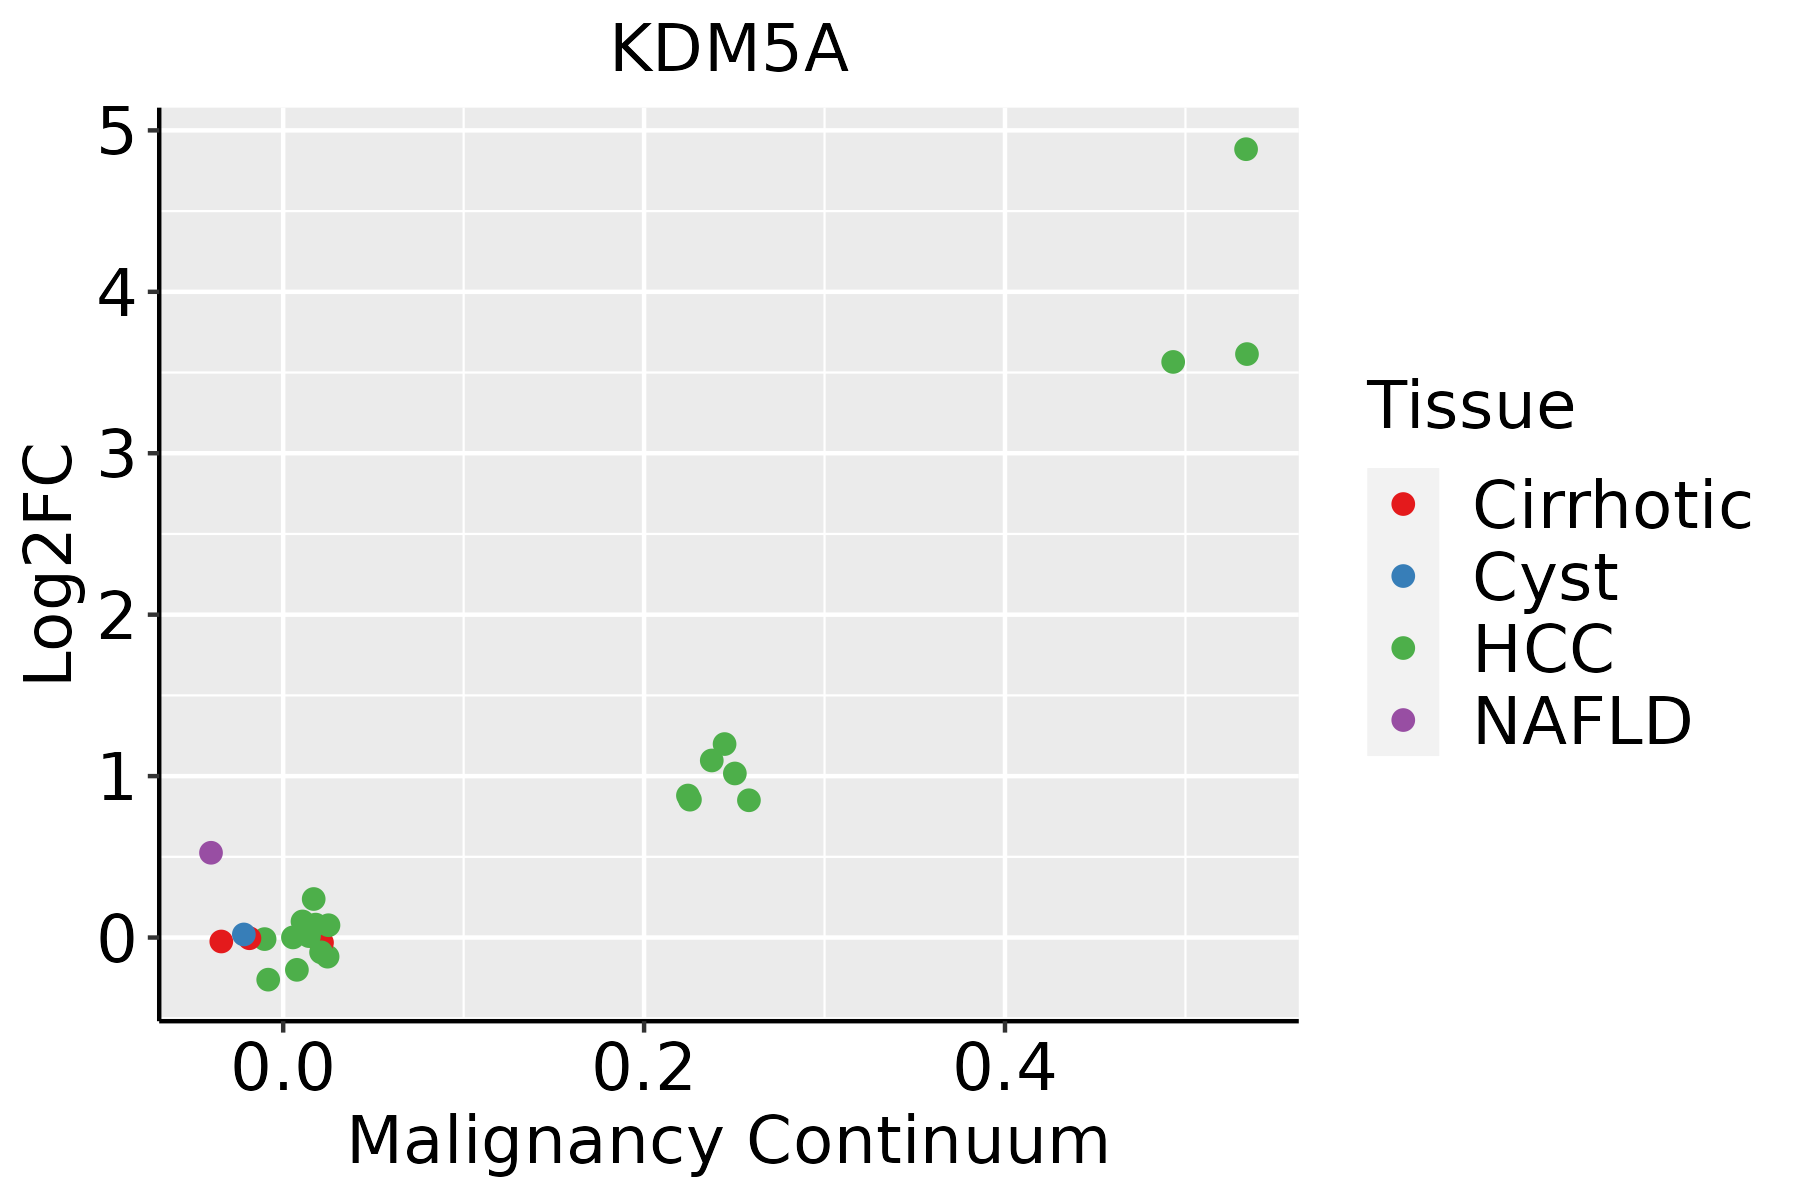
HCC: Hepatocellular carcinoma
NAFLD: Non-alcoholic fatty liver disease
Oral CavityThe image shows the transcriptomic changes along malignancy continuum.log2FC in expression of this searched gene in stem-like cells from each diseased tissue sample relative to stem-like cells in normal samples in each tissue plotted against the malignancy continuum. Samples are colored based on if they are from different disease stage.
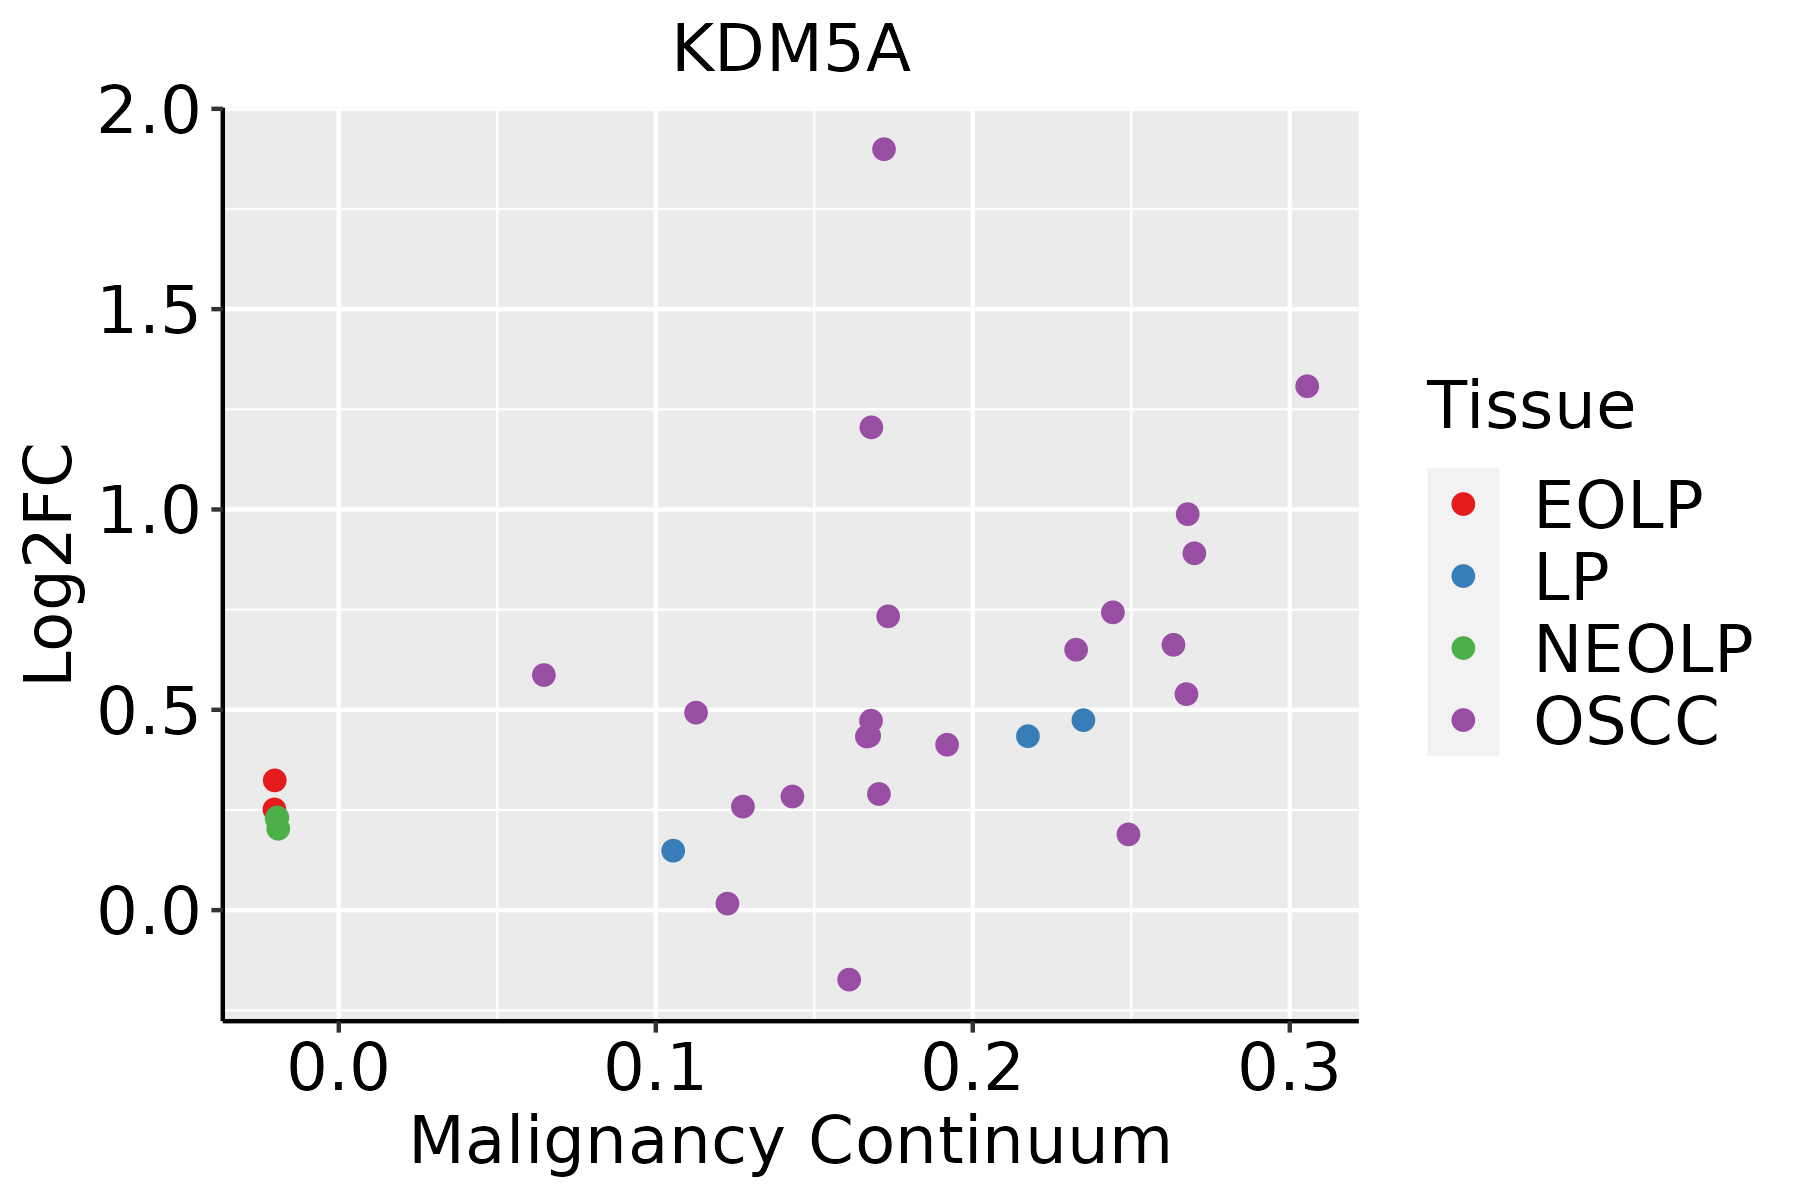
EOLP: Erosive Oral lichen planus
LP: leukoplakia
NEOLP: Non-erosive oral lichen planus
OSCC: Oral squamous cell carcinoma
ProstateThe image shows the transcriptomic changes along malignancy continuum.log2FC in expression of this searched gene in stem-like cells from each diseased tissue sample relative to stem-like cells in normal samples in each tissue plotted against the malignancy continuum. Samples are colored based on if they are from different disease stage.BPH: Benign Prostatic Hyperplasia
SkinThe image shows the transcriptomic changes along malignancy continuum.log2FC in expression of this searched gene in stem-like cells from each diseased tissue sample relative to stem-like cells in normal samples in each tissue plotted against the malignancy continuum. Samples are colored based on if they are from different disease stage.
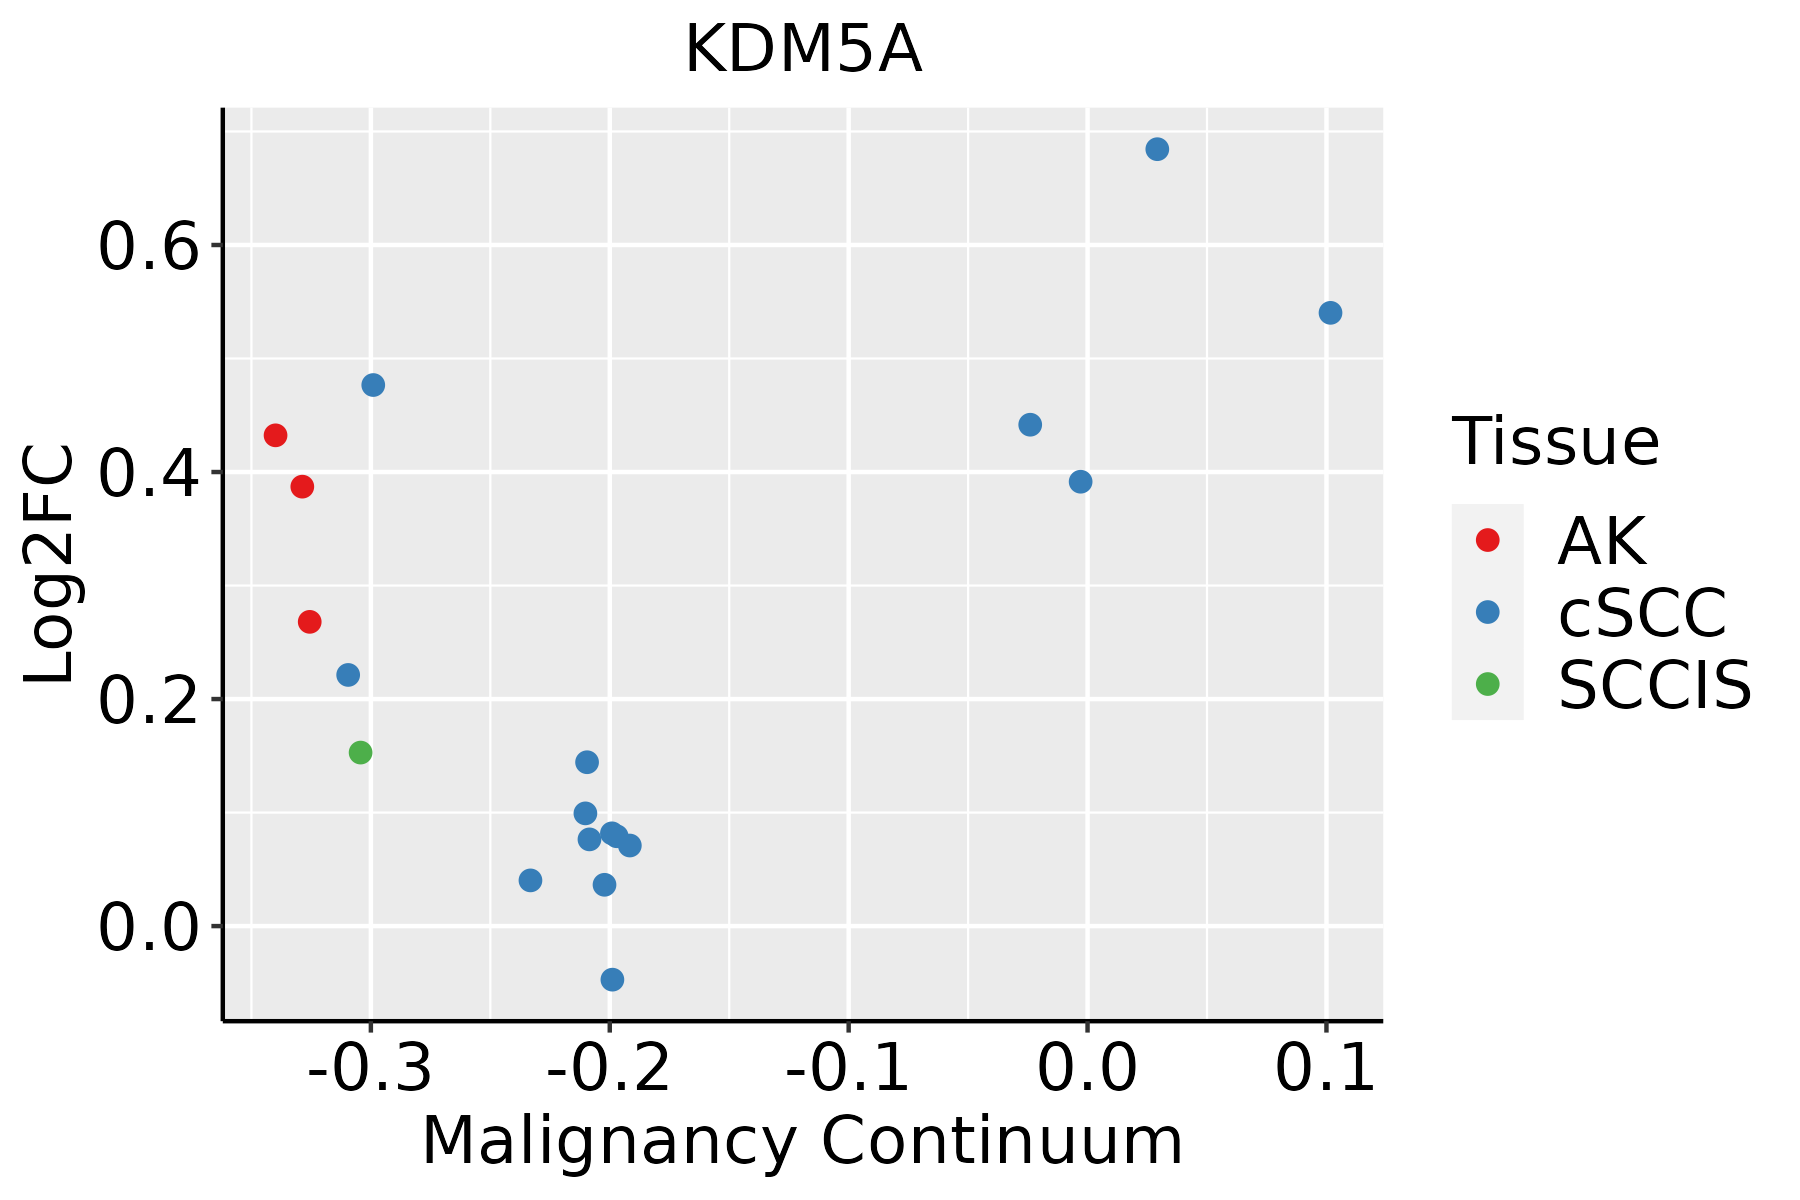
AK: Actinic keratosis
cSCC: Cutaneous squamous cell carcinoma
SCCIS:squamous cell carcinoma in situ
ThyroidThe image shows the transcriptomic changes along malignancy continuum.log2FC in expression of this searched gene in stem-like cells from each diseased tissue sample relative to stem-like cells in normal samples in each tissue plotted against the malignancy continuum. Samples are colored based on if they are from different disease stage.ATC: Anaplastic thyroid cancer
HT: Hashimoto's thyroiditis
PTC: Papillary thyroid cancer
∗log2FC in expression of this searched gene in stem-like cells from each diseased tissue sample relative to stem-like cells in normal samples in each tissue plotted against the malignancy continuum. Samples are colored based on if they are from different disease stage.

Top

Malignant transformation related pathway analysis

check buttonFind out the enriched GO biological processes and KEGG pathways involved in transition from healthy to precancer to cancer
check button Figure of enriched GO biological processes.
TissueDisease StageEnriched GO biological Processes
ColorectumADGO analysis - Figure of enriched GO biological processes: Top 15 enriched GO BP terms are showed in the bar plot of each disease state in each tissue. Each row represents a significant GO biological process which is colored according to the -log10(p.adjust).
ColorectumSERGO analysis - Figure of enriched GO biological processes: Top 15 enriched GO BP terms are showed in the bar plot of each disease state in each tissue. Each row represents a significant GO biological process which is colored according to the -log10(p.adjust).
ColorectumMSSGO analysis - Figure of enriched GO biological processes: Top 15 enriched GO BP terms are showed in the bar plot of each disease state in each tissue. Each row represents a significant GO biological process which is colored according to the -log10(p.adjust).
ColorectumMSI-HGO analysis - Figure of enriched GO biological processes: Top 15 enriched GO BP terms are showed in the bar plot of each disease state in each tissue. Each row represents a significant GO biological process which is colored according to the -log10(p.adjust).
ColorectumFAPGO analysis - Figure of enriched GO biological processes: Top 15 enriched GO BP terms are showed in the bar plot of each disease state in each tissue. Each row represents a significant GO biological process which is colored according to the -log10(p.adjust).
∗Top 15 enriched GO BP terms are showed in the bar plot of each disease state in each tissue. Each row represents a significant GO biological process which is colored according to the -log10(p.adjust).
Page: 1 2 3 4 5 6 7 8 9 

check button Enriched GO biological processes.
GO IDTissueDisease StageDescriptionGene RatioBg Ratiopvaluep.adjustCount
GO:00513469CervixCCnegative regulation of hydrolase activity81/2311379/187234.27e-071.67e-0581
GO:00614588CervixCCreproductive system development87/2311427/187231.37e-064.55e-0587
GO:00486088CervixCCreproductive structure development86/2311424/187231.90e-065.97e-0586
GO:00485118CervixCCrhythmic process65/2311298/187232.79e-068.04e-0565
GO:00510904CervixCCregulation of DNA-binding transcription factor activity87/2311440/187234.85e-061.22e-0487
GO:00063257CervixCCchromatin organization78/2311409/187235.40e-058.02e-0478
GO:00076238CervixCCcircadian rhythm46/2311210/187236.76e-059.60e-0446
GO:00165705CervixCChistone modification84/2311463/187231.70e-042.01e-0384
GO:00310565CervixCCregulation of histone modification33/2311152/187237.97e-047.00e-0333
GO:00329226CervixCCcircadian regulation of gene expression18/231168/187231.18e-039.56e-0318
GO:00063381CervixCCchromatin remodeling45/2311255/187238.33e-034.30e-0245
GO:001657015EsophagusESCChistone modification323/8552463/187232.61e-267.88e-24323
GO:003105614EsophagusESCCregulation of histone modification106/8552152/187231.52e-093.55e-08106
GO:000632517EsophagusESCCchromatin organization240/8552409/187236.52e-081.14e-06240
GO:00356015EsophagusESCCprotein deacylation79/8552112/187238.30e-081.42e-0679
GO:0061458110EsophagusESCCreproductive system development247/8552427/187232.24e-073.42e-06247
GO:004860818EsophagusESCCreproductive structure development245/8552424/187232.82e-074.14e-06245
GO:00987325EsophagusESCCmacromolecule deacylation80/8552116/187233.19e-074.50e-0680
GO:00165754EsophagusESCChistone deacetylation60/855282/187233.85e-075.32e-0660
GO:00510908EsophagusESCCregulation of DNA-binding transcription factor activity252/8552440/187235.22e-076.97e-06252
Page: 1 2 3 4 5 6 7 8 9 10 11 

check button Enriched KEGG pathways.
Pathway IDTissueDisease StageDescriptionGene RatioBg Ratiopvaluep.adjustqvalueCount
Page: 1 

Top

Cell-cell communication analysis

check buttonIdentification of potential cell-cell interactions between two cell types and their ligand-receptor pairs for different disease states
LigandReceptorLRpairPathwayTissueDisease Stage
Page: 1 

Top

Single-cell gene regulatory network inference analysis

check buttonFind out the significant the regulons (TFs) and the target genes of each regulon across cell types for different disease states
TFCell TypeTissueDisease StageTarget GeneRSSRegulon Activity
KDM5ATREGEsophagusESCCAURKA,BCHE,RP13-516M14.4, etc.1.66e-01The dot plots of a searched regulon are shown for all cell subpopulations in each disease state of each tissue based on the regulon specific score inferred using pySCENIC and by calculating the average expression.
KDM5ABASSkinSCCISSLC12A8,ANO9,TSNARE1, etc.1.84e-01The dot plots of a searched regulon are shown for all cell subpopulations in each disease state of each tissue based on the regulon specific score inferred using pySCENIC and by calculating the average expression.
KDM5ASTMThyroidHTFAM118A,GPATCH2L,TMEM87B, etc.6.93e-01The dot plots of a searched regulon are shown for all cell subpopulations in each disease state of each tissue based on the regulon specific score inferred using pySCENIC and by calculating the average expression.
∗The dot plots of a searched regulon are shown for all cell subpopulations in each disease state of each tissue based on the regulon specific score inferred using pySCENIC and by calculating the average expression.
Page: 1 

Top

Somatic mutation of malignant transformation related genes

check buttonAnnotation of somatic variants for genes involved in malignant transformation
Hugo SymbolVariant ClassVariant ClassificationdbSNP RSHGVScHGVSpHGVSp ShortSWISSPROTBIOTYPESIFTPolyPhenTumor Sample BarcodeTissueHistologySexAgeStageTherapy TypesDrugsOutcome
KDM5ASNVMissense_Mutationc.3908N>Tp.Ala1303Valp.A1303VP29375protein_codingdeleterious(0.04)possibly_damaging(0.604)TCGA-A8-A079-01Breastbreast invasive carcinomaFemale>=65III/IVChemotherapy5-fluorouracilSD
KDM5ASNVMissense_Mutationrs776901877c.3045N>Gp.Ser1015Argp.S1015RP29375protein_codingdeleterious(0.03)benign(0.189)TCGA-A8-A095-01Breastbreast invasive carcinomaFemale<65I/IIChemotherapy5-fluorouracilCR
KDM5ASNVMissense_Mutationc.5042N>Cp.Leu1681Prop.L1681PP29375protein_codingdeleterious_low_confidence(0.01)possibly_damaging(0.478)TCGA-A8-A09Z-01Breastbreast invasive carcinomaFemale>=65I/IIUnknownUnknownSD
KDM5ASNVMissense_Mutationc.4082C>Gp.Ala1361Glyp.A1361GP29375protein_codingtolerated(0.45)benign(0)TCGA-A8-A0AB-01Breastbreast invasive carcinomaFemale<65I/IIChemotherapy5-fluorouracilCR
KDM5ASNVMissense_Mutationnovelc.791N>Ap.Arg264Glnp.R264QP29375protein_codingtolerated(0.34)benign(0.03)TCGA-AN-A046-01Breastbreast invasive carcinomaFemale>=65I/IIUnknownUnknownSD
KDM5ASNVMissense_Mutationc.349C>Ap.Leu117Metp.L117MP29375protein_codingdeleterious(0)probably_damaging(0.999)TCGA-AN-A0AR-01Breastbreast invasive carcinomaFemale<65I/IIUnknownUnknownSD
KDM5ASNVMissense_Mutationrs748024384c.1570G>Ap.Glu524Lysp.E524KP29375protein_codingdeleterious(0)benign(0.327)TCGA-AN-A0FK-01Breastbreast invasive carcinomaFemale>=65III/IVUnknownUnknownSD
KDM5ASNVMissense_Mutationc.2815G>Cp.Glu939Glnp.E939QP29375protein_codingdeleterious(0)benign(0.217)TCGA-AN-A0FL-01Breastbreast invasive carcinomaFemale<65I/IIUnknownUnknownSD
KDM5ASNVMissense_Mutationc.769G>Cp.Asp257Hisp.D257HP29375protein_codingdeleterious(0.02)benign(0.011)TCGA-D8-A1JA-01Breastbreast invasive carcinomaFemale<65III/IVChemotherapyadriamycinPD
KDM5ASNVMissense_Mutationc.659N>Ap.Arg220Hisp.R220HP29375protein_codingdeleterious(0.02)possibly_damaging(0.886)TCGA-D8-A27W-01Breastbreast invasive carcinomaFemale<65III/IVChemotherapydoxorubicine+cyclophosphamideSD
Page: 1 2 3 4 5 6 7 8 9 10 11 12 13 14 15 16 17 18 

Top

Related drugs of malignant transformation related genes

check buttonIdentification of chemicals and drugs interact with genes involved in malignant transfromation
(DGIdb 4.0)
Entrez IDSymbolCategoryInteraction TypesDrug Claim NameDrug NamePMIDs
5927KDM5ACLINICALLY ACTIONABLE, ENZYME, NUCLEAR HORMONE RECEPTORBDBM50158803
5927KDM5ACLINICALLY ACTIONABLE, ENZYME, NUCLEAR HORMONE RECEPTORUS9714230, 46
5927KDM5ACLINICALLY ACTIONABLE, ENZYME, NUCLEAR HORMONE RECEPTOR1190312-92-5
5927KDM5ACLINICALLY ACTIONABLE, ENZYME, NUCLEAR HORMONE RECEPTORUS10022354, Example 152
5927KDM5ACLINICALLY ACTIONABLE, ENZYME, NUCLEAR HORMONE RECEPTORAKOS020330481
5927KDM5ACLINICALLY ACTIONABLE, ENZYME, NUCLEAR HORMONE RECEPTORBDBM50158794
5927KDM5ACLINICALLY ACTIONABLE, ENZYME, NUCLEAR HORMONE RECEPTORinhibitor178103606
5927KDM5ACLINICALLY ACTIONABLE, ENZYME, NUCLEAR HORMONE RECEPTORUS10174026, Example 2
5927KDM5ACLINICALLY ACTIONABLE, ENZYME, NUCLEAR HORMONE RECEPTORUS10022354, Example 151
5927KDM5ACLINICALLY ACTIONABLE, ENZYME, NUCLEAR HORMONE RECEPTORUS10174026, Example 99
Page: 1 2 3