
|
|||||
|
 | |
| |
| |
| |
| |
| |
|
Gene: KDM4A |
Gene summary for KDM4A |
| Gene information | Species | Human | Gene symbol | KDM4A | Gene ID | 9682 |
| Gene name | lysine demethylase 4A | |
| Gene Alias | JHDM3A | |
| Cytomap | 1p34.2-p34.1 | |
| Gene Type | protein-coding | GO ID | GO:0003008 | UniProtAcc | O75164 |
Top |
Malignant transformation analysis |
| Identification of the aberrant gene expression in precancerous and cancerous lesions by comparing the gene expression of stem-like cells in diseased tissues with normal stem cells |
| Entrez ID | Symbol | Replicates | Species | Organ | Tissue | Adj P-value | Log2FC | Malignancy |
| 9682 | KDM4A | HTA11_3410_2000001011 | Human | Colorectum | AD | 4.23e-12 | 2.41e-01 | 0.0155 |
| 9682 | KDM4A | HTA11_2487_2000001011 | Human | Colorectum | SER | 9.55e-18 | 4.69e-01 | -0.1808 |
| 9682 | KDM4A | HTA11_2951_2000001011 | Human | Colorectum | AD | 3.22e-05 | 4.66e-01 | 0.0216 |
| 9682 | KDM4A | HTA11_1938_2000001011 | Human | Colorectum | AD | 1.39e-17 | 4.61e-01 | -0.0811 |
| 9682 | KDM4A | HTA11_78_2000001011 | Human | Colorectum | AD | 8.35e-11 | 2.91e-01 | -0.1088 |
| 9682 | KDM4A | HTA11_347_2000001011 | Human | Colorectum | AD | 5.98e-43 | 6.71e-01 | -0.1954 |
| 9682 | KDM4A | HTA11_411_2000001011 | Human | Colorectum | SER | 4.42e-10 | 6.00e-01 | -0.2602 |
| 9682 | KDM4A | HTA11_2112_2000001011 | Human | Colorectum | SER | 1.08e-06 | 3.96e-01 | -0.2196 |
| 9682 | KDM4A | HTA11_3361_2000001011 | Human | Colorectum | AD | 3.86e-11 | 3.60e-01 | -0.1207 |
| 9682 | KDM4A | HTA11_83_2000001011 | Human | Colorectum | SER | 2.83e-15 | 4.54e-01 | -0.1526 |
| 9682 | KDM4A | HTA11_696_2000001011 | Human | Colorectum | AD | 7.40e-36 | 5.69e-01 | -0.1464 |
| 9682 | KDM4A | HTA11_866_2000001011 | Human | Colorectum | AD | 5.18e-24 | 4.12e-01 | -0.1001 |
| 9682 | KDM4A | HTA11_1391_2000001011 | Human | Colorectum | AD | 6.55e-21 | 5.63e-01 | -0.059 |
| 9682 | KDM4A | HTA11_2992_2000001011 | Human | Colorectum | SER | 2.31e-08 | 4.44e-01 | -0.1706 |
| 9682 | KDM4A | HTA11_5212_2000001011 | Human | Colorectum | AD | 1.44e-09 | 3.82e-01 | -0.2061 |
| 9682 | KDM4A | HTA11_5216_2000001011 | Human | Colorectum | SER | 2.79e-07 | 4.41e-01 | -0.1462 |
| 9682 | KDM4A | HTA11_546_2000001011 | Human | Colorectum | AD | 4.04e-11 | 4.68e-01 | -0.0842 |
| 9682 | KDM4A | HTA11_9341_2000001011 | Human | Colorectum | SER | 4.01e-04 | 4.03e-01 | -0.00410000000000005 |
| 9682 | KDM4A | HTA11_7862_2000001011 | Human | Colorectum | AD | 1.12e-06 | 3.05e-01 | -0.0179 |
| 9682 | KDM4A | HTA11_866_3004761011 | Human | Colorectum | AD | 1.85e-21 | 4.30e-01 | 0.096 |
| Page: 1 2 3 4 5 6 |
| Tissue | Expression Dynamics | Abbreviation |
| Colorectum (GSE201348) |  | FAP: Familial adenomatous polyposis |
| CRC: Colorectal cancer | ||
| Colorectum (HTA11) |  | AD: Adenomas |
| SER: Sessile serrated lesions | ||
| MSI-H: Microsatellite-high colorectal cancer | ||
| MSS: Microsatellite stable colorectal cancer | ||
| Esophagus | 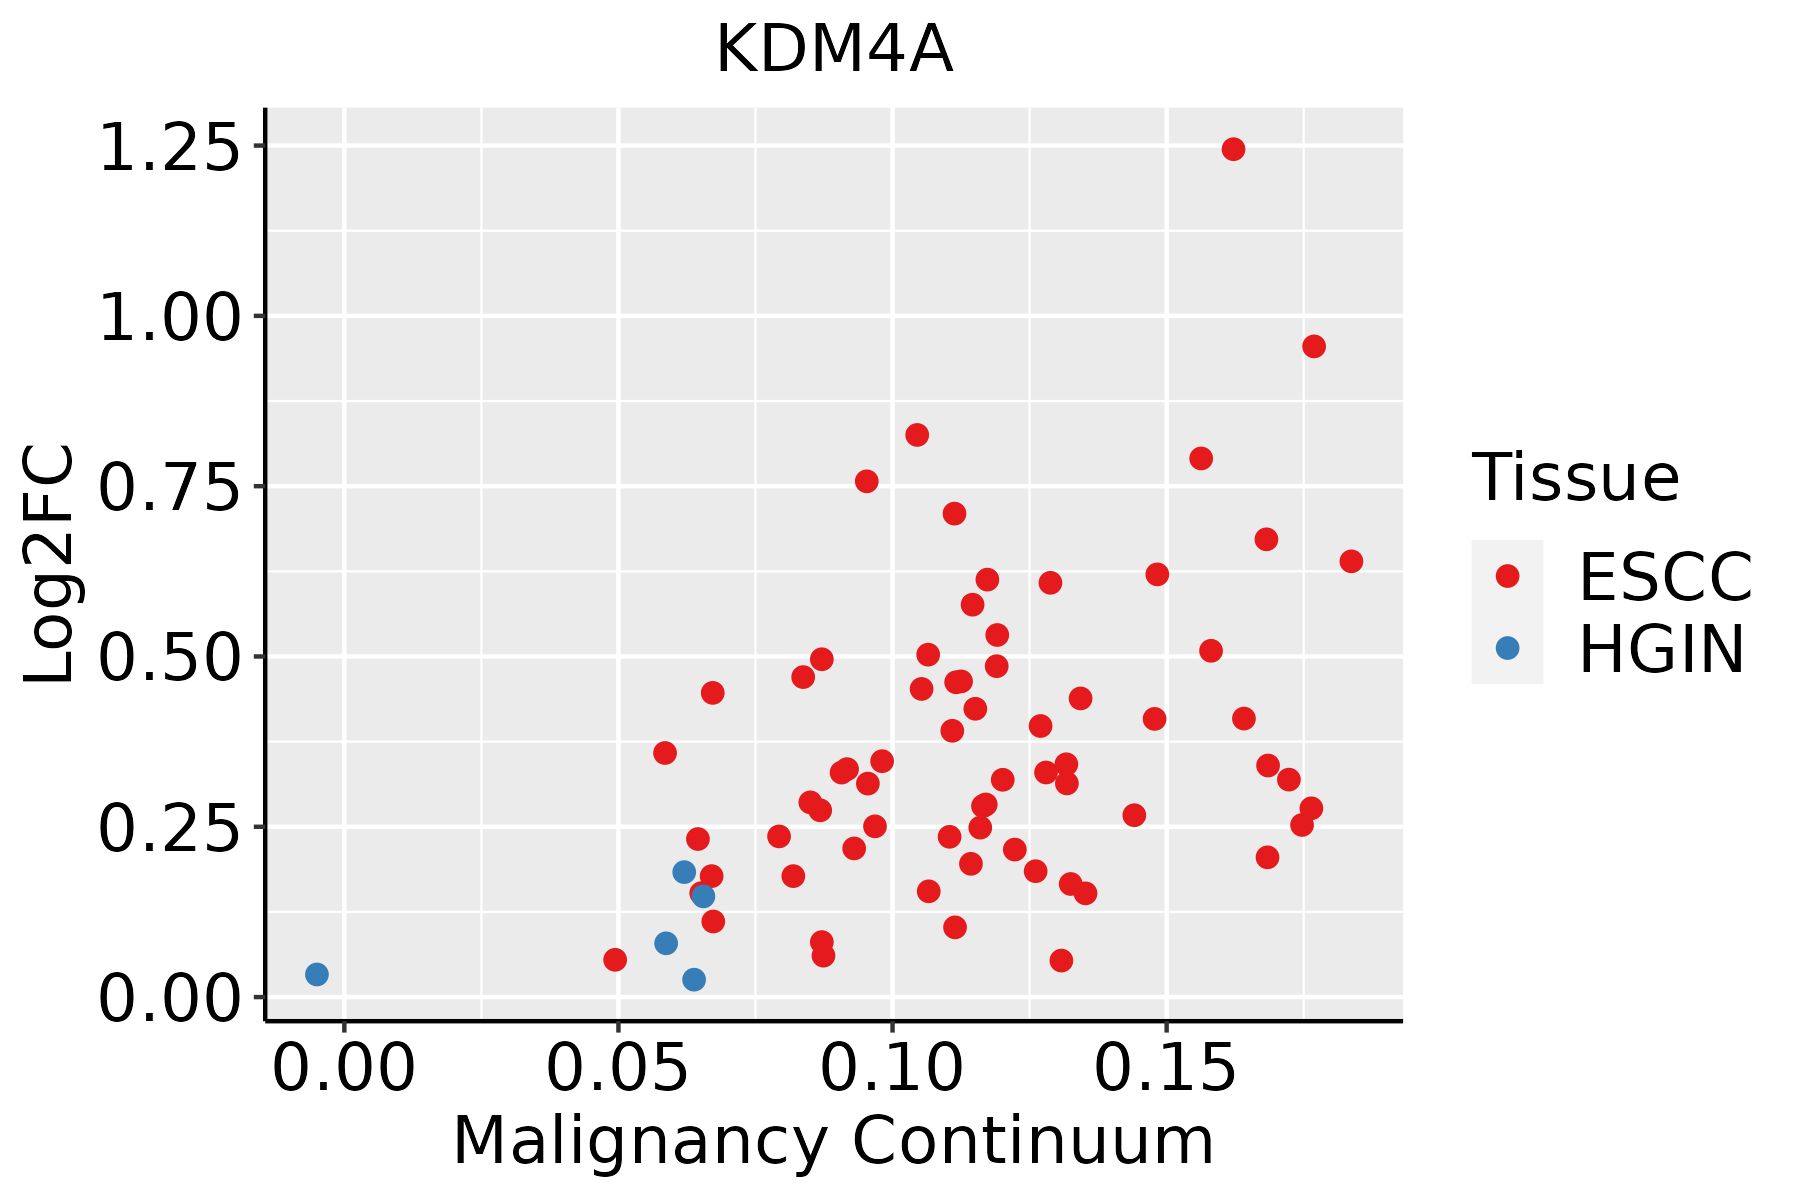 | ESCC: Esophageal squamous cell carcinoma |
| HGIN: High-grade intraepithelial neoplasias | ||
| LGIN: Low-grade intraepithelial neoplasias | ||
| Liver | 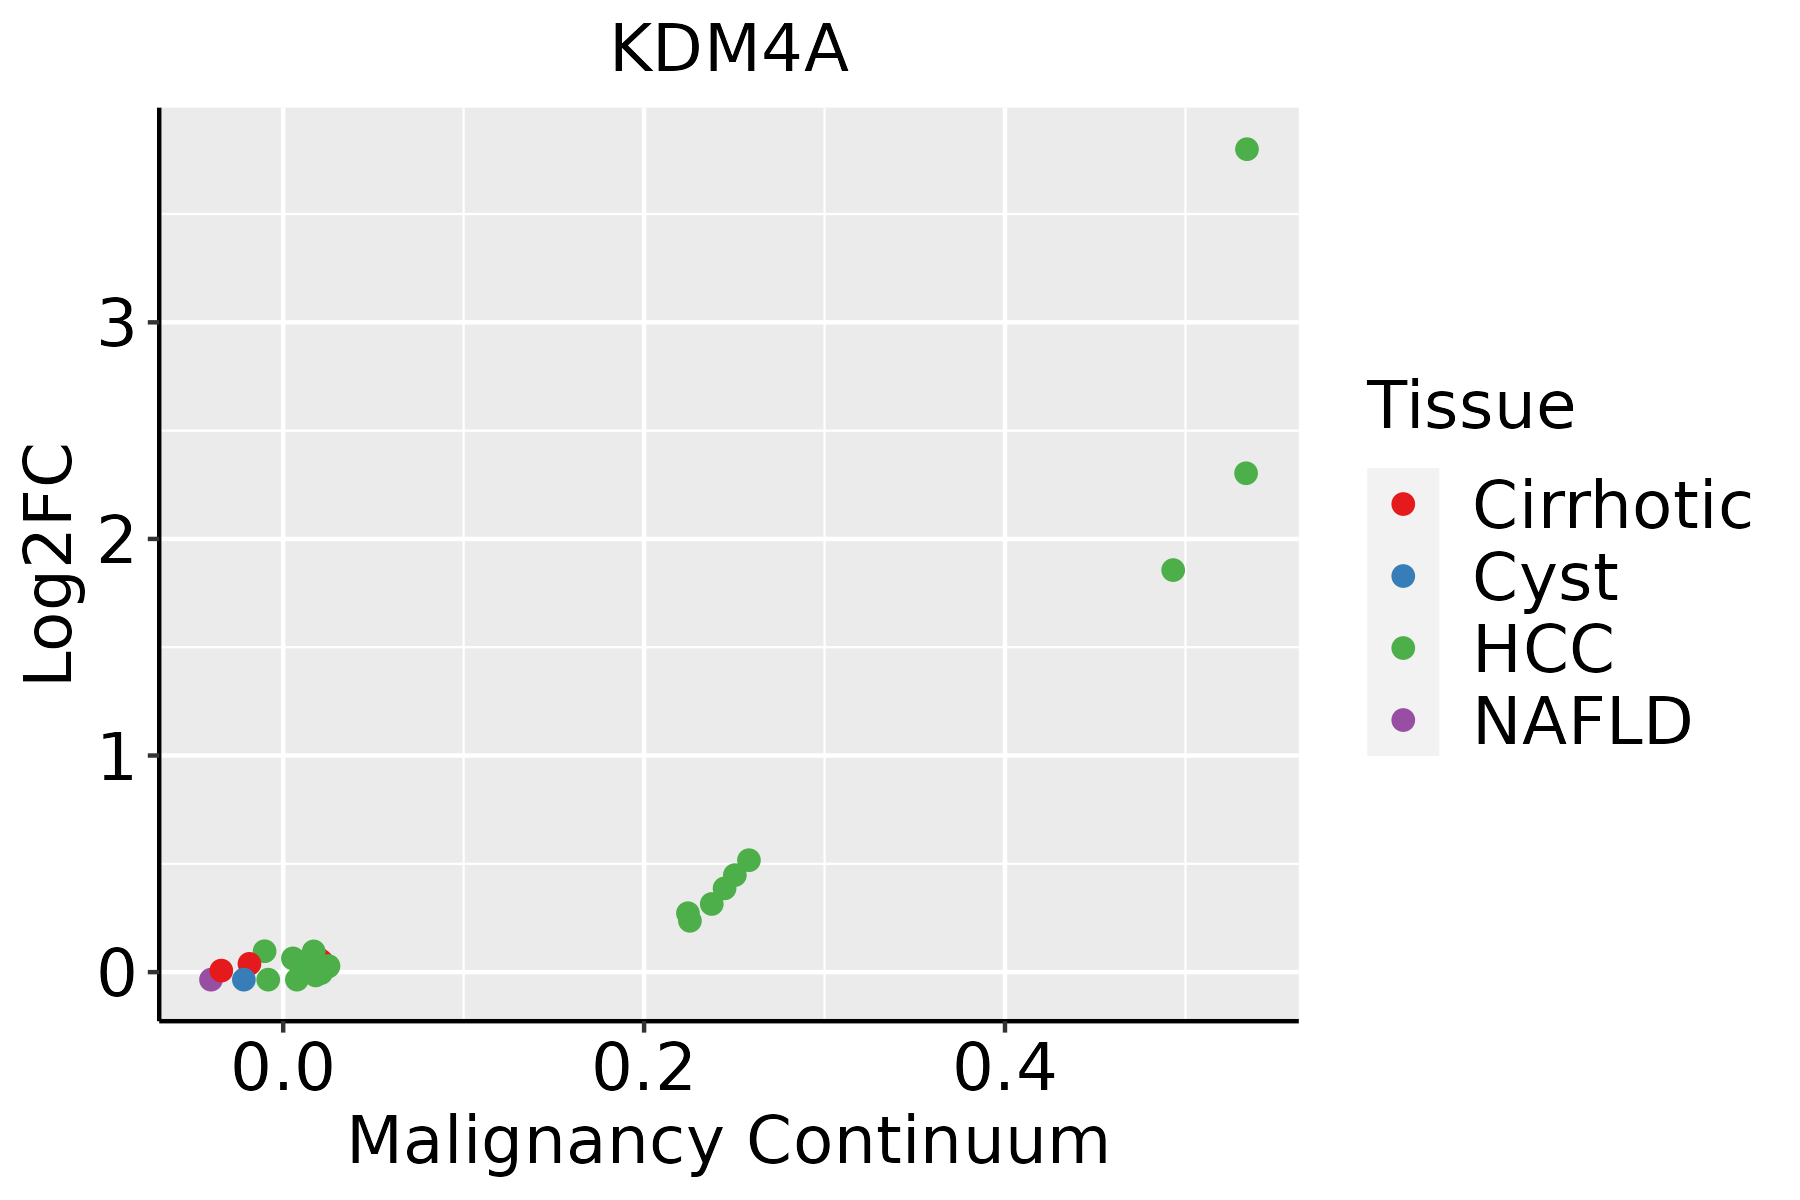 | HCC: Hepatocellular carcinoma |
| NAFLD: Non-alcoholic fatty liver disease |
| ∗log2FC in expression of this searched gene in stem-like cells from each diseased tissue sample relative to stem-like cells in normal samples in each tissue plotted against the malignancy continuum. Samples are colored based on if they are from different disease stage. |
Top |
Malignant transformation related pathway analysis |
| Find out the enriched GO biological processes and KEGG pathways involved in transition from healthy to precancer to cancer |
| Tissue | Disease Stage | Enriched GO biological Processes |
| Colorectum | AD |  |
| Colorectum | SER |  |
| Colorectum | MSS |  |
| Colorectum | MSI-H |  |
| Colorectum | FAP |  |
| ∗Top 15 enriched GO BP terms are showed in the bar plot of each disease state in each tissue. Each row represents a significant GO biological process which is colored according to the -log10(p.adjust). |
| Page: 1 2 3 4 5 6 7 8 9 |
| GO ID | Tissue | Disease Stage | Description | Gene Ratio | Bg Ratio | pvalue | p.adjust | Count |
| GO:0009895 | Colorectum | AD | negative regulation of catabolic process | 124/3918 | 320/18723 | 1.66e-13 | 3.35e-11 | 124 |
| GO:0031330 | Colorectum | AD | negative regulation of cellular catabolic process | 104/3918 | 262/18723 | 2.66e-12 | 3.96e-10 | 104 |
| GO:0010506 | Colorectum | AD | regulation of autophagy | 111/3918 | 317/18723 | 3.57e-09 | 2.35e-07 | 111 |
| GO:0031667 | Colorectum | AD | response to nutrient levels | 138/3918 | 474/18723 | 1.22e-05 | 2.68e-04 | 138 |
| GO:0006325 | Colorectum | AD | chromatin organization | 119/3918 | 409/18723 | 4.85e-05 | 8.33e-04 | 119 |
| GO:0010507 | Colorectum | AD | negative regulation of autophagy | 31/3918 | 85/18723 | 6.91e-04 | 7.05e-03 | 31 |
| GO:0050767 | Colorectum | AD | regulation of neurogenesis | 99/3918 | 364/18723 | 2.35e-03 | 1.82e-02 | 99 |
| GO:0031056 | Colorectum | AD | regulation of histone modification | 45/3918 | 152/18723 | 7.05e-03 | 4.31e-02 | 45 |
| GO:0006338 | Colorectum | AD | chromatin remodeling | 70/3918 | 255/18723 | 7.44e-03 | 4.53e-02 | 70 |
| GO:00098951 | Colorectum | SER | negative regulation of catabolic process | 84/2897 | 320/18723 | 3.93e-07 | 2.06e-05 | 84 |
| GO:00313301 | Colorectum | SER | negative regulation of cellular catabolic process | 70/2897 | 262/18723 | 1.79e-06 | 7.70e-05 | 70 |
| GO:00316671 | Colorectum | SER | response to nutrient levels | 106/2897 | 474/18723 | 3.94e-05 | 1.00e-03 | 106 |
| GO:00105061 | Colorectum | SER | regulation of autophagy | 74/2897 | 317/18723 | 1.39e-04 | 2.77e-03 | 74 |
| GO:00063251 | Colorectum | SER | chromatin organization | 89/2897 | 409/18723 | 4.15e-04 | 6.17e-03 | 89 |
| GO:0043500 | Colorectum | SER | muscle adaptation | 31/2897 | 121/18723 | 2.58e-03 | 2.38e-02 | 31 |
| GO:0051567 | Colorectum | SER | histone H3-K9 methylation | 13/2897 | 37/18723 | 2.60e-03 | 2.40e-02 | 13 |
| GO:00310561 | Colorectum | SER | regulation of histone modification | 37/2897 | 152/18723 | 2.80e-03 | 2.50e-02 | 37 |
| GO:0003012 | Colorectum | SER | muscle system process | 92/2897 | 452/18723 | 2.98e-03 | 2.63e-02 | 92 |
| GO:0051570 | Colorectum | SER | regulation of histone H3-K9 methylation | 9/2897 | 24/18723 | 7.19e-03 | 4.99e-02 | 9 |
| GO:00313302 | Colorectum | MSS | negative regulation of cellular catabolic process | 96/3467 | 262/18723 | 2.67e-12 | 4.63e-10 | 96 |
| Page: 1 2 3 4 5 |
| Pathway ID | Tissue | Disease Stage | Description | Gene Ratio | Bg Ratio | pvalue | p.adjust | qvalue | Count |
| Page: 1 |
Top |
Cell-cell communication analysis |
| Identification of potential cell-cell interactions between two cell types and their ligand-receptor pairs for different disease states |
| Ligand | Receptor | LRpair | Pathway | Tissue | Disease Stage |
| Page: 1 |
Top |
Single-cell gene regulatory network inference analysis |
| Find out the significant the regulons (TFs) and the target genes of each regulon across cell types for different disease states |
| TF | Cell Type | Tissue | Disease Stage | Target Gene | RSS | Regulon Activity |
| KDM4A | MSC.ADIPO | Breast | ADJ | SPP1,BMPER,C3orf17, etc. | 1.04e-01 |  |
| KDM4A | MVA | Breast | DCIS | SPP1,BMPER,C3orf17, etc. | 2.55e-02 |  |
| KDM4A | FIB | Breast | Precancer | SPP1,BMPER,C3orf17, etc. | 5.65e-03 |  |
| KDM4A | PVA | Oral cavity | OSCC | ANXA1,GABPB1-AS1,RBM43, etc. | 9.48e-02 |  |
| ∗The dot plots of a searched regulon are shown for all cell subpopulations in each disease state of each tissue based on the regulon specific score inferred using pySCENIC and by calculating the average expression. |
| Page: 1 |
Top |
Somatic mutation of malignant transformation related genes |
| Annotation of somatic variants for genes involved in malignant transformation |
| Hugo Symbol | Variant Class | Variant Classification | dbSNP RS | HGVSc | HGVSp | HGVSp Short | SWISSPROT | BIOTYPE | SIFT | PolyPhen | Tumor Sample Barcode | Tissue | Histology | Sex | Age | Stage | Therapy Types | Drugs | Outcome |
| KDM4A | SNV | Missense_Mutation | c.1043C>T | p.Pro348Leu | p.P348L | O75164 | protein_coding | deleterious(0) | probably_damaging(0.998) | TCGA-A8-A06O-01 | Breast | breast invasive carcinoma | Female | <65 | I/II | Hormone Therapy | letrozole | SD | |
| KDM4A | SNV | Missense_Mutation | c.1276N>A | p.Glu426Lys | p.E426K | O75164 | protein_coding | tolerated(0.94) | benign(0.031) | TCGA-A8-A09I-01 | Breast | breast invasive carcinoma | Female | >=65 | I/II | Hormone Therapy | anastrozole | SD | |
| KDM4A | SNV | Missense_Mutation | novel | c.2006N>T | p.Ala669Val | p.A669V | O75164 | protein_coding | deleterious(0) | benign(0.045) | TCGA-AN-A0AK-01 | Breast | breast invasive carcinoma | Female | >=65 | I/II | Unknown | Unknown | SD |
| KDM4A | SNV | Missense_Mutation | novel | c.2377N>G | p.Trp793Gly | p.W793G | O75164 | protein_coding | deleterious(0) | probably_damaging(0.998) | TCGA-AQ-A04H-01 | Breast | breast invasive carcinoma | Female | <65 | III/IV | Chemotherapy | taxotere | SD |
| KDM4A | SNV | Missense_Mutation | c.1495N>T | p.Leu499Phe | p.L499F | O75164 | protein_coding | tolerated(0.73) | benign(0.348) | TCGA-AR-A1AX-01 | Breast | breast invasive carcinoma | Female | <65 | I/II | Chemotherapy | cytoxan | SD | |
| KDM4A | SNV | Missense_Mutation | rs570986178 | c.383N>G | p.Asn128Ser | p.N128S | O75164 | protein_coding | tolerated(0.44) | benign(0.012) | TCGA-BH-A0DG-01 | Breast | breast invasive carcinoma | Female | <65 | I/II | Chemotherapy | taxotere | CR |
| KDM4A | SNV | Missense_Mutation | c.2182G>C | p.Glu728Gln | p.E728Q | O75164 | protein_coding | tolerated(0.18) | probably_damaging(0.915) | TCGA-C8-A26Y-01 | Breast | breast invasive carcinoma | Female | >=65 | I/II | Unknown | Unknown | SD | |
| KDM4A | SNV | Missense_Mutation | c.1276N>C | p.Glu426Gln | p.E426Q | O75164 | protein_coding | tolerated(0.18) | benign(0.444) | TCGA-D8-A27G-01 | Breast | breast invasive carcinoma | Female | >=65 | I/II | Unknown | Unknown | SD | |
| KDM4A | SNV | Missense_Mutation | novel | c.1376N>T | p.Ser459Phe | p.S459F | O75164 | protein_coding | deleterious(0.02) | benign(0.174) | TCGA-GM-A2DI-01 | Breast | breast invasive carcinoma | Female | <65 | I/II | Chemotherapy | taxotere | CR |
| KDM4A | SNV | Missense_Mutation | novel | c.3035N>G | p.Lys1012Arg | p.K1012R | O75164 | protein_coding | deleterious(0.03) | probably_damaging(0.985) | TCGA-OL-A5D6-01 | Breast | breast invasive carcinoma | Female | >=65 | I/II | Unknown | Unknown | SD |
| Page: 1 2 3 4 5 6 7 8 9 10 11 12 |
Top |
Related drugs of malignant transformation related genes |
| Identification of chemicals and drugs interact with genes involved in malignant transfromation |
| (DGIdb 4.0) |
| Entrez ID | Symbol | Category | Interaction Types | Drug Claim Name | Drug Name | PMIDs |
| 9682 | KDM4A | DRUGGABLE GENOME, ENZYME | CLOFAZIMINE | CLOFAZIMINE | ||
| 9682 | KDM4A | DRUGGABLE GENOME, ENZYME | MONTELUKAST SODIUM | MONTELUKAST SODIUM | ||
| 9682 | KDM4A | DRUGGABLE GENOME, ENZYME | CHLOROGENIC ACID | CHLOROGENIC ACID | ||
| 9682 | KDM4A | DRUGGABLE GENOME, ENZYME | ERGOCRYPTINE | ERGOCRYPTINE | ||
| 9682 | KDM4A | DRUGGABLE GENOME, ENZYME | 4-HYDROXYESTRADIOL | CHEMBL1412489 | ||
| 9682 | KDM4A | DRUGGABLE GENOME, ENZYME | INDAZOLE-3-CARBOXYLICACID | CHEMBL502057 | ||
| 9682 | KDM4A | DRUGGABLE GENOME, ENZYME | ALTENUSIN | ALTENUSIN | ||
| 9682 | KDM4A | DRUGGABLE GENOME, ENZYME | GNF-PF-840 | CHEMBL601605 | ||
| 9682 | KDM4A | DRUGGABLE GENOME, ENZYME | EUPAFOLIN | EUPAFOLIN | ||
| 9682 | KDM4A | DRUGGABLE GENOME, ENZYME | PYRIDINE-2,4-DICARBOXYLIC ACID | CHEMBL316034 |
| Page: 1 2 3 4 5 6 7 8 9 10 11 12 13 14 15 16 17 18 19 20 21 22 23 24 25 26 27 28 29 30 31 32 33 34 35 36 37 38 39 40 41 42 43 44 45 46 |

Copyright 2023-Present -The University of Texas Health Science Center at Houston |