
|
|||||
|
 | |
| |
| |
| |
| |
| |
|
Gene: KDM3B |
Gene summary for KDM3B |
| Gene information | Species | Human | Gene symbol | KDM3B | Gene ID | 51780 |
| Gene name | lysine demethylase 3B | |
| Gene Alias | 5qNCA | |
| Cytomap | 5q31.2 | |
| Gene Type | protein-coding | GO ID | GO:0006139 | UniProtAcc | Q7LBC6 |
Top |
Malignant transformation analysis |
| Identification of the aberrant gene expression in precancerous and cancerous lesions by comparing the gene expression of stem-like cells in diseased tissues with normal stem cells |
| Entrez ID | Symbol | Replicates | Species | Organ | Tissue | Adj P-value | Log2FC | Malignancy |
| 51780 | KDM3B | LZE7T | Human | Esophagus | ESCC | 4.62e-03 | 2.28e-01 | 0.0667 |
| 51780 | KDM3B | LZE8T | Human | Esophagus | ESCC | 4.93e-05 | 1.22e-01 | 0.067 |
| 51780 | KDM3B | LZE24T | Human | Esophagus | ESCC | 1.85e-08 | 2.52e-01 | 0.0596 |
| 51780 | KDM3B | P2T-E | Human | Esophagus | ESCC | 2.43e-19 | 3.69e-01 | 0.1177 |
| 51780 | KDM3B | P4T-E | Human | Esophagus | ESCC | 8.25e-05 | 1.13e-01 | 0.1323 |
| 51780 | KDM3B | P5T-E | Human | Esophagus | ESCC | 3.88e-03 | 2.03e-02 | 0.1327 |
| 51780 | KDM3B | P8T-E | Human | Esophagus | ESCC | 2.95e-15 | 2.41e-01 | 0.0889 |
| 51780 | KDM3B | P9T-E | Human | Esophagus | ESCC | 1.29e-03 | 5.90e-02 | 0.1131 |
| 51780 | KDM3B | P10T-E | Human | Esophagus | ESCC | 1.15e-13 | 1.16e-01 | 0.116 |
| 51780 | KDM3B | P11T-E | Human | Esophagus | ESCC | 3.04e-07 | 3.12e-01 | 0.1426 |
| 51780 | KDM3B | P12T-E | Human | Esophagus | ESCC | 7.01e-22 | 3.44e-01 | 0.1122 |
| 51780 | KDM3B | P15T-E | Human | Esophagus | ESCC | 9.59e-11 | 2.26e-01 | 0.1149 |
| 51780 | KDM3B | P16T-E | Human | Esophagus | ESCC | 3.93e-12 | 8.65e-02 | 0.1153 |
| 51780 | KDM3B | P20T-E | Human | Esophagus | ESCC | 1.51e-14 | 3.73e-01 | 0.1124 |
| 51780 | KDM3B | P21T-E | Human | Esophagus | ESCC | 2.92e-13 | 1.12e-01 | 0.1617 |
| 51780 | KDM3B | P22T-E | Human | Esophagus | ESCC | 2.00e-13 | 6.71e-02 | 0.1236 |
| 51780 | KDM3B | P23T-E | Human | Esophagus | ESCC | 2.31e-11 | 1.94e-01 | 0.108 |
| 51780 | KDM3B | P24T-E | Human | Esophagus | ESCC | 1.04e-09 | 5.61e-02 | 0.1287 |
| 51780 | KDM3B | P26T-E | Human | Esophagus | ESCC | 1.09e-11 | 1.15e-01 | 0.1276 |
| 51780 | KDM3B | P27T-E | Human | Esophagus | ESCC | 1.70e-13 | 1.12e-01 | 0.1055 |
| Page: 1 2 3 4 5 6 |
| Tissue | Expression Dynamics | Abbreviation |
| Esophagus | 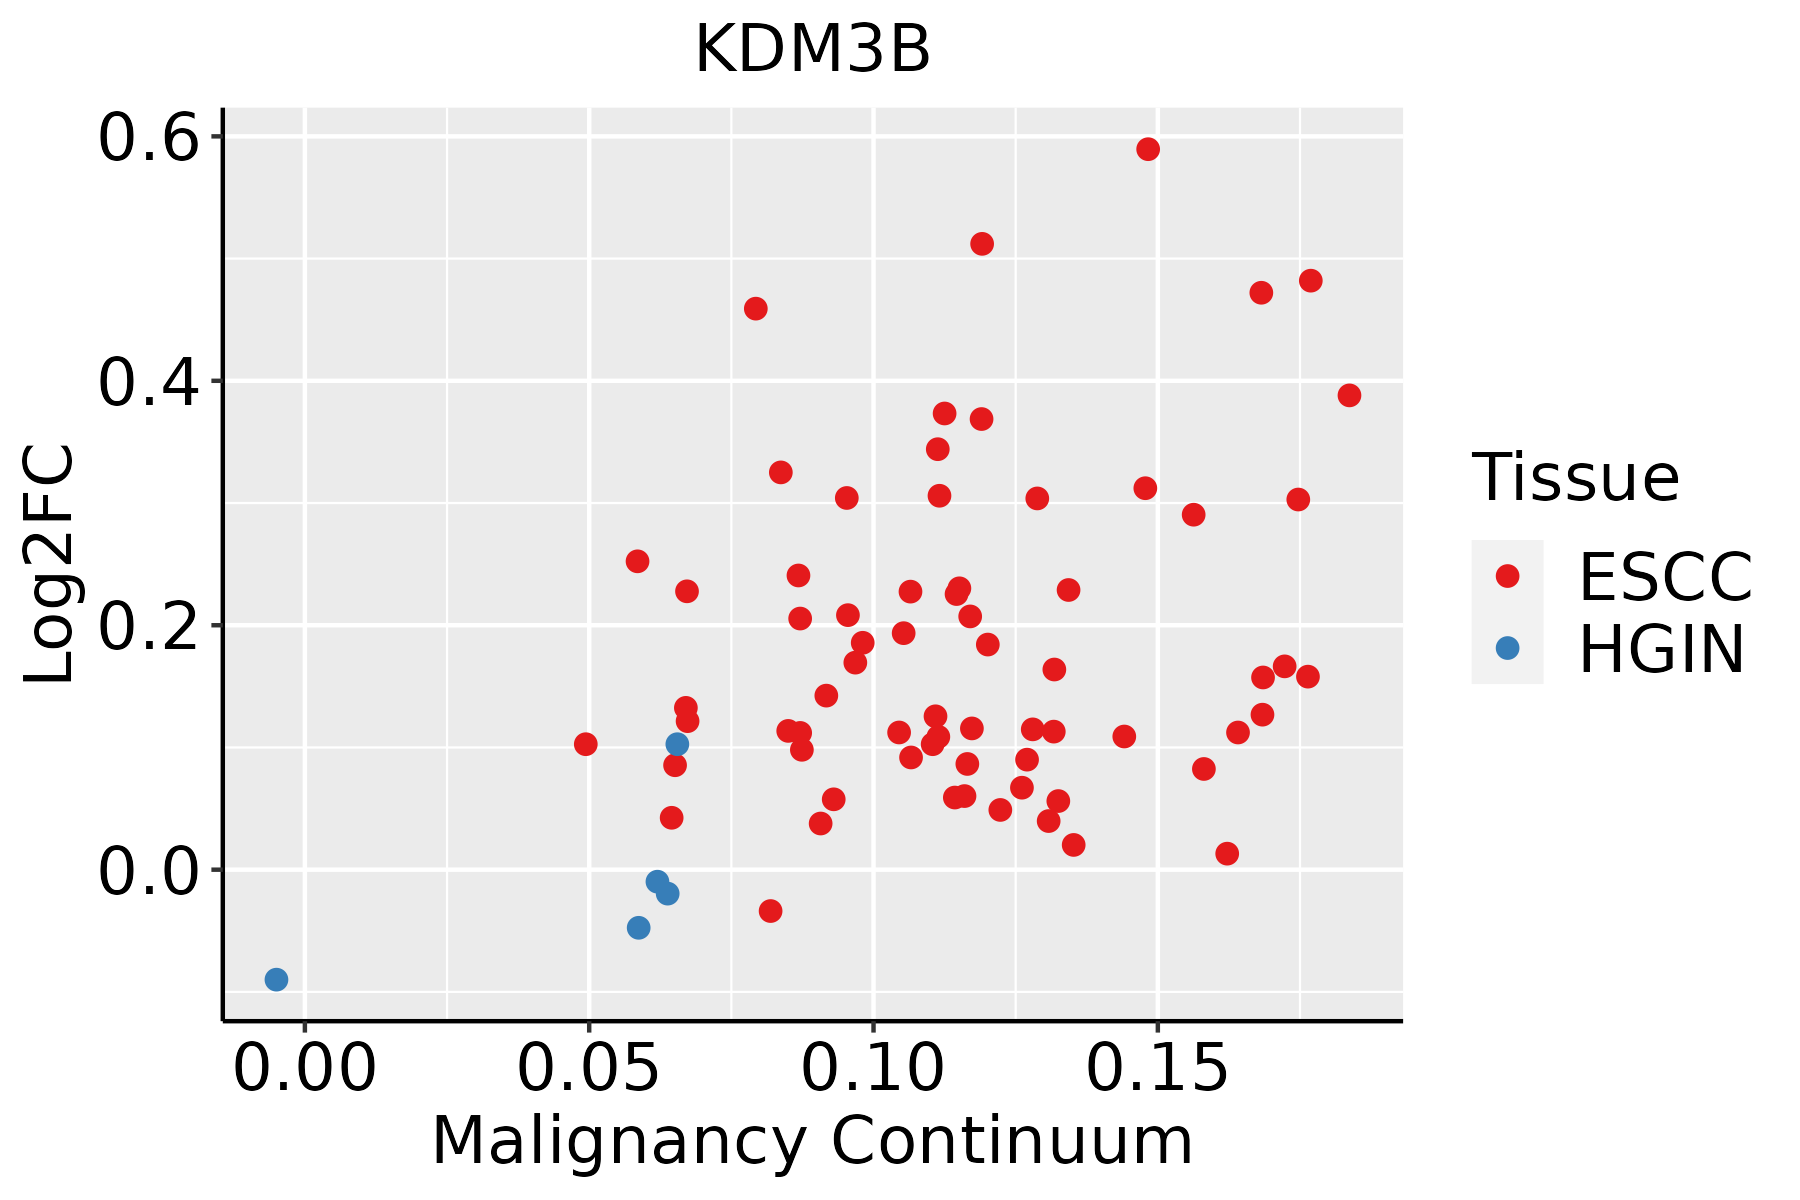 | ESCC: Esophageal squamous cell carcinoma |
| HGIN: High-grade intraepithelial neoplasias | ||
| LGIN: Low-grade intraepithelial neoplasias | ||
| Liver |  | HCC: Hepatocellular carcinoma |
| NAFLD: Non-alcoholic fatty liver disease | ||
| Lung | 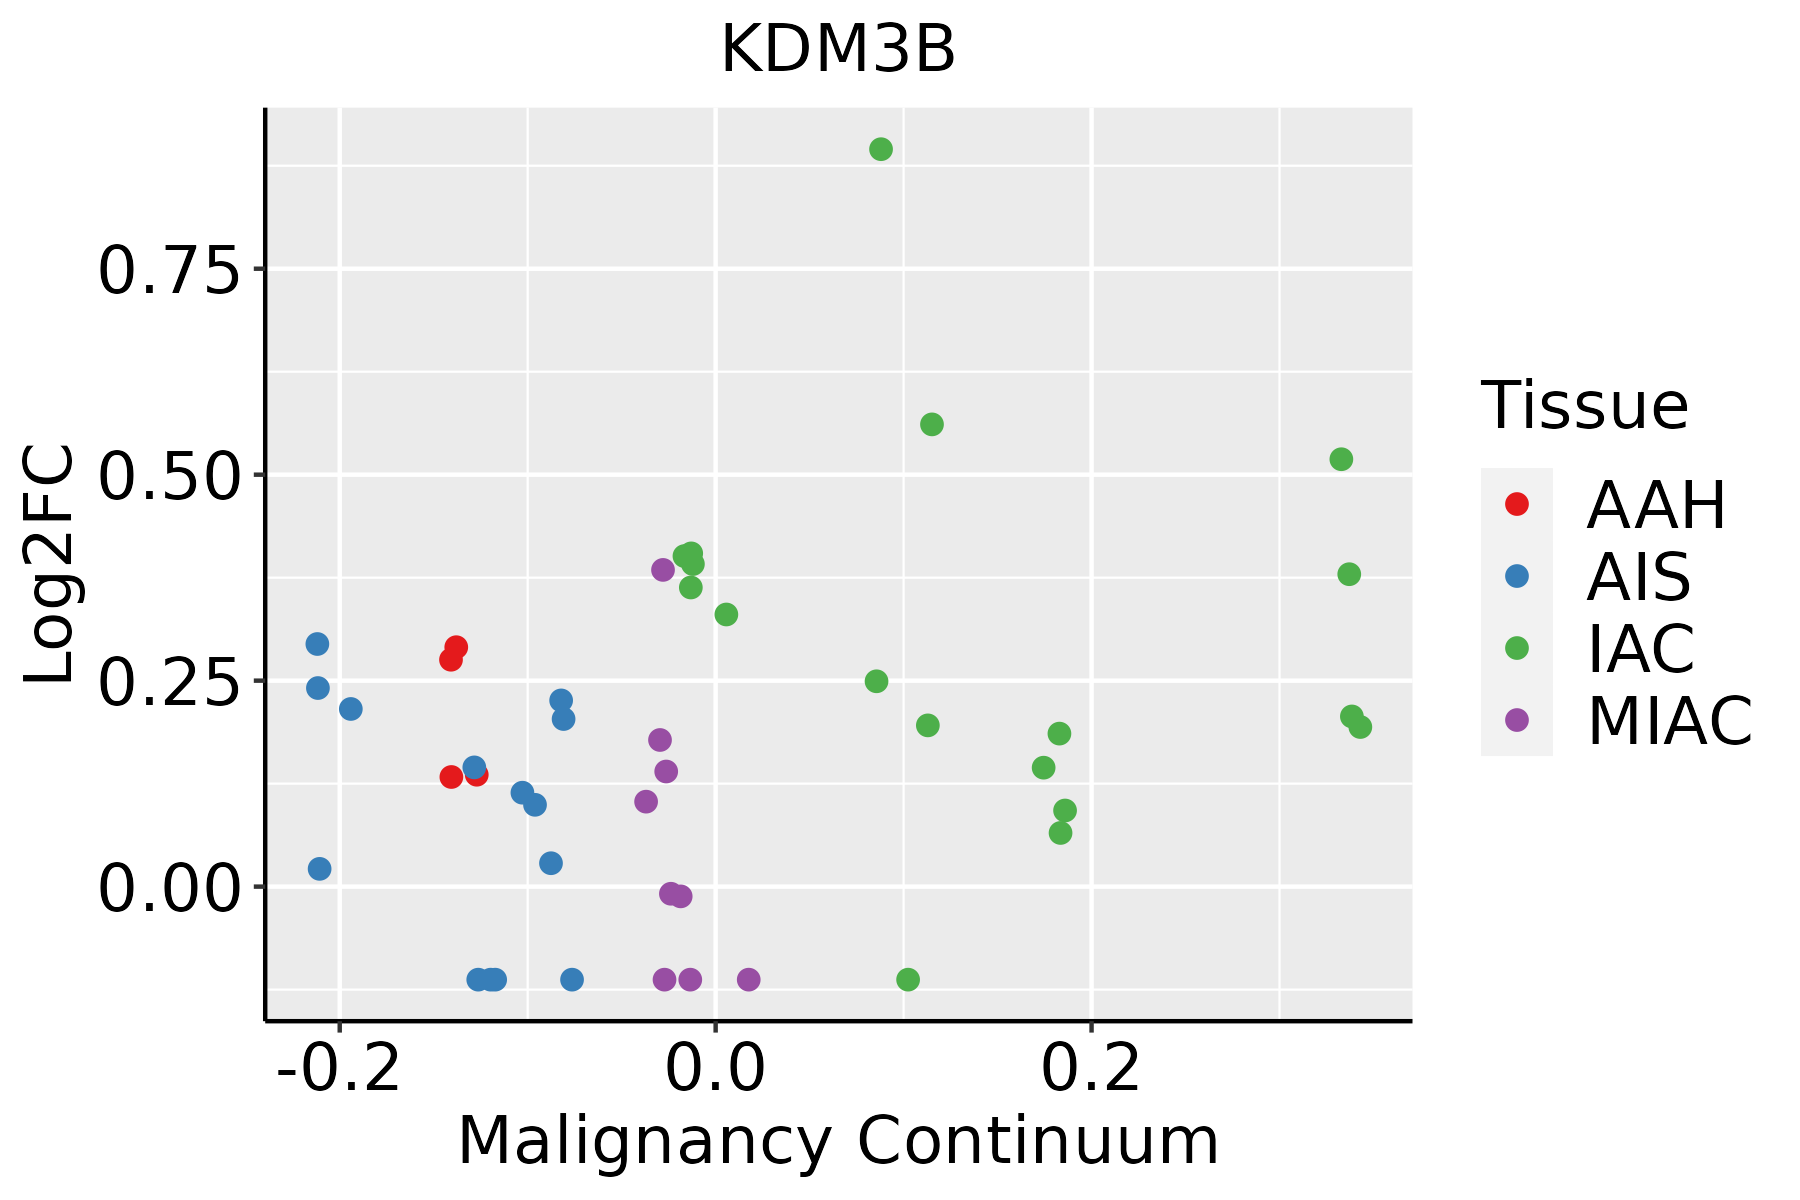 | AAH: Atypical adenomatous hyperplasia |
| AIS: Adenocarcinoma in situ | ||
| IAC: Invasive lung adenocarcinoma | ||
| MIA: Minimally invasive adenocarcinoma | ||
| Oral Cavity | 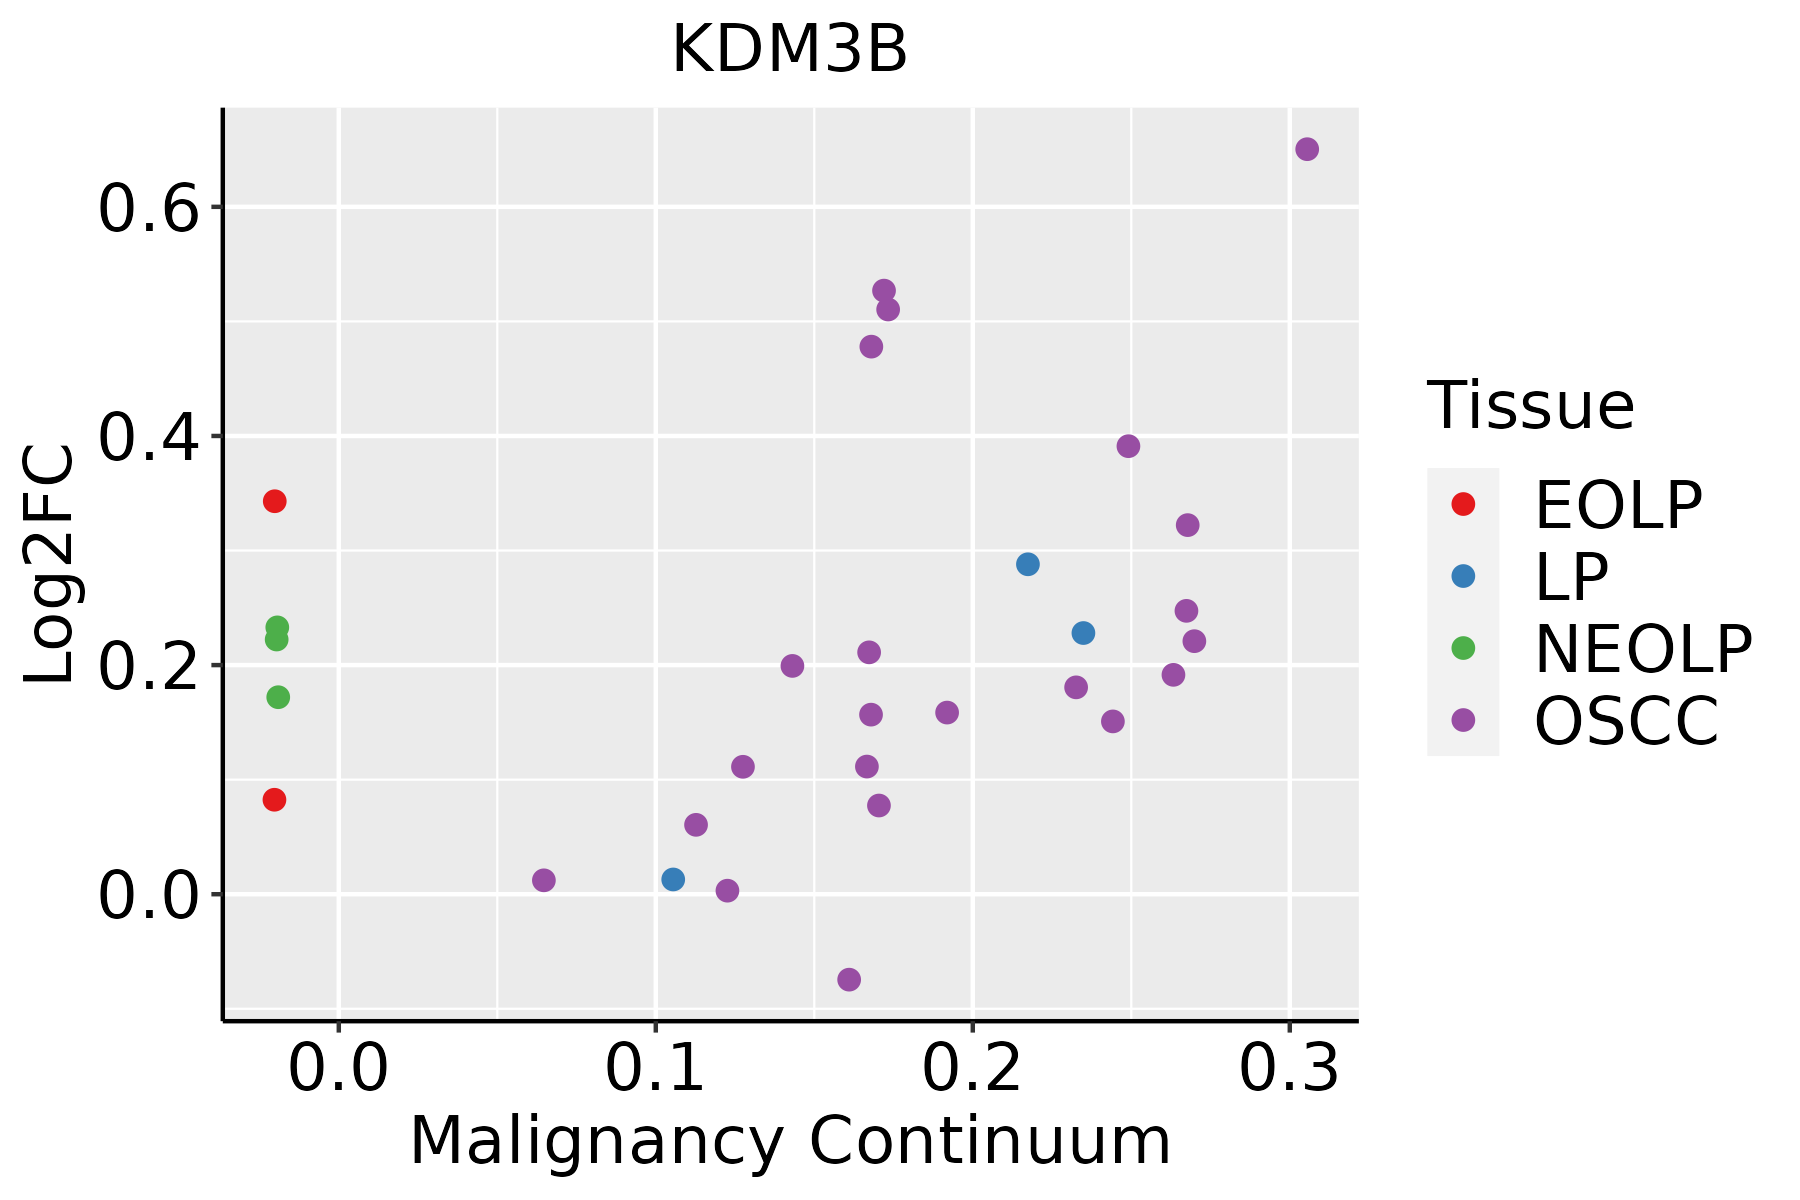 | EOLP: Erosive Oral lichen planus |
| LP: leukoplakia | ||
| NEOLP: Non-erosive oral lichen planus | ||
| OSCC: Oral squamous cell carcinoma | ||
| Prostate |  | BPH: Benign Prostatic Hyperplasia |
| Thyroid |  | ATC: Anaplastic thyroid cancer |
| HT: Hashimoto's thyroiditis | ||
| PTC: Papillary thyroid cancer |
| ∗log2FC in expression of this searched gene in stem-like cells from each diseased tissue sample relative to stem-like cells in normal samples in each tissue plotted against the malignancy continuum. Samples are colored based on if they are from different disease stage. |
Top |
Malignant transformation related pathway analysis |
| Find out the enriched GO biological processes and KEGG pathways involved in transition from healthy to precancer to cancer |
| Tissue | Disease Stage | Enriched GO biological Processes |
| Colorectum | AD |  |
| Colorectum | SER |  |
| Colorectum | MSS |  |
| Colorectum | MSI-H |  |
| Colorectum | FAP |  |
| ∗Top 15 enriched GO BP terms are showed in the bar plot of each disease state in each tissue. Each row represents a significant GO biological process which is colored according to the -log10(p.adjust). |
| Page: 1 2 3 4 5 6 7 8 9 |
| GO ID | Tissue | Disease Stage | Description | Gene Ratio | Bg Ratio | pvalue | p.adjust | Count |
| GO:001657015 | Esophagus | ESCC | histone modification | 323/8552 | 463/18723 | 2.61e-26 | 7.88e-24 | 323 |
| GO:000963620 | Esophagus | ESCC | response to toxic substance | 150/8552 | 262/18723 | 1.00e-04 | 7.12e-04 | 150 |
| GO:1990748110 | Esophagus | ESCC | cellular detoxification | 70/8552 | 116/18723 | 1.02e-03 | 5.17e-03 | 70 |
| GO:00064824 | Esophagus | ESCC | protein demethylation | 24/8552 | 33/18723 | 1.50e-03 | 7.06e-03 | 24 |
| GO:00082144 | Esophagus | ESCC | protein dealkylation | 24/8552 | 33/18723 | 1.50e-03 | 7.06e-03 | 24 |
| GO:0097237110 | Esophagus | ESCC | cellular response to toxic substance | 72/8552 | 124/18723 | 3.65e-03 | 1.49e-02 | 72 |
| GO:0098869110 | Esophagus | ESCC | cellular oxidant detoxification | 60/8552 | 101/18723 | 3.76e-03 | 1.53e-02 | 60 |
| GO:00165773 | Esophagus | ESCC | histone demethylation | 22/8552 | 31/18723 | 3.90e-03 | 1.58e-02 | 22 |
| GO:00700763 | Esophagus | ESCC | histone lysine demethylation | 20/8552 | 28/18723 | 5.23e-03 | 1.97e-02 | 20 |
| GO:00165703 | Liver | NAFLD | histone modification | 90/1882 | 463/18723 | 5.74e-10 | 1.28e-07 | 90 |
| GO:0070076 | Liver | NAFLD | histone lysine demethylation | 10/1882 | 28/18723 | 2.46e-04 | 4.09e-03 | 10 |
| GO:0016577 | Liver | NAFLD | histone demethylation | 10/1882 | 31/18723 | 6.28e-04 | 8.21e-03 | 10 |
| GO:0006482 | Liver | NAFLD | protein demethylation | 10/1882 | 33/18723 | 1.09e-03 | 1.27e-02 | 10 |
| GO:0008214 | Liver | NAFLD | protein dealkylation | 10/1882 | 33/18723 | 1.09e-03 | 1.27e-02 | 10 |
| GO:0070988 | Liver | NAFLD | demethylation | 16/1882 | 73/18723 | 2.09e-03 | 2.06e-02 | 16 |
| GO:00096367 | Liver | NAFLD | response to toxic substance | 41/1882 | 262/18723 | 2.83e-03 | 2.57e-02 | 41 |
| GO:001657021 | Liver | HCC | histone modification | 283/7958 | 463/18723 | 2.68e-16 | 2.33e-14 | 283 |
| GO:000963622 | Liver | HCC | response to toxic substance | 153/7958 | 262/18723 | 1.37e-07 | 2.58e-06 | 153 |
| GO:199074812 | Liver | HCC | cellular detoxification | 70/7958 | 116/18723 | 7.87e-05 | 7.02e-04 | 70 |
| GO:009723712 | Liver | HCC | cellular response to toxic substance | 74/7958 | 124/18723 | 8.36e-05 | 7.36e-04 | 74 |
| Page: 1 2 3 4 |
| Pathway ID | Tissue | Disease Stage | Description | Gene Ratio | Bg Ratio | pvalue | p.adjust | qvalue | Count |
| hsa04714211 | Esophagus | ESCC | Thermogenesis | 163/4205 | 232/8465 | 9.22e-11 | 1.14e-09 | 5.86e-10 | 163 |
| hsa04714310 | Esophagus | ESCC | Thermogenesis | 163/4205 | 232/8465 | 9.22e-11 | 1.14e-09 | 5.86e-10 | 163 |
| hsa0471422 | Liver | HCC | Thermogenesis | 170/4020 | 232/8465 | 5.36e-16 | 2.25e-14 | 1.25e-14 | 170 |
| hsa0471432 | Liver | HCC | Thermogenesis | 170/4020 | 232/8465 | 5.36e-16 | 2.25e-14 | 1.25e-14 | 170 |
| hsa0471416 | Lung | IAC | Thermogenesis | 46/1053 | 232/8465 | 7.85e-04 | 6.38e-03 | 4.23e-03 | 46 |
| hsa0471417 | Lung | IAC | Thermogenesis | 46/1053 | 232/8465 | 7.85e-04 | 6.38e-03 | 4.23e-03 | 46 |
| hsa0471430 | Oral cavity | OSCC | Thermogenesis | 138/3704 | 232/8465 | 7.67e-07 | 4.35e-06 | 2.22e-06 | 138 |
| hsa04714113 | Oral cavity | OSCC | Thermogenesis | 138/3704 | 232/8465 | 7.67e-07 | 4.35e-06 | 2.22e-06 | 138 |
| hsa0471445 | Oral cavity | EOLP | Thermogenesis | 54/1218 | 232/8465 | 1.66e-04 | 7.16e-04 | 4.22e-04 | 54 |
| hsa0471455 | Oral cavity | EOLP | Thermogenesis | 54/1218 | 232/8465 | 1.66e-04 | 7.16e-04 | 4.22e-04 | 54 |
| hsa0471428 | Prostate | BPH | Thermogenesis | 110/1718 | 232/8465 | 5.16e-21 | 1.42e-19 | 8.78e-20 | 110 |
| hsa04714112 | Prostate | BPH | Thermogenesis | 110/1718 | 232/8465 | 5.16e-21 | 1.42e-19 | 8.78e-20 | 110 |
| hsa0471429 | Prostate | Tumor | Thermogenesis | 110/1791 | 232/8465 | 1.56e-19 | 3.96e-18 | 2.46e-18 | 110 |
| hsa0471437 | Prostate | Tumor | Thermogenesis | 110/1791 | 232/8465 | 1.56e-19 | 3.96e-18 | 2.46e-18 | 110 |
| Page: 1 |
Top |
Cell-cell communication analysis |
| Identification of potential cell-cell interactions between two cell types and their ligand-receptor pairs for different disease states |
| Ligand | Receptor | LRpair | Pathway | Tissue | Disease Stage |
| Page: 1 |
Top |
Single-cell gene regulatory network inference analysis |
| Find out the significant the regulons (TFs) and the target genes of each regulon across cell types for different disease states |
| TF | Cell Type | Tissue | Disease Stage | Target Gene | RSS | Regulon Activity |
| ∗The dot plots of a searched regulon are shown for all cell subpopulations in each disease state of each tissue based on the regulon specific score inferred using pySCENIC and by calculating the average expression. |
| Page: 1 |
Top |
Somatic mutation of malignant transformation related genes |
| Annotation of somatic variants for genes involved in malignant transformation |
| Hugo Symbol | Variant Class | Variant Classification | dbSNP RS | HGVSc | HGVSp | HGVSp Short | SWISSPROT | BIOTYPE | SIFT | PolyPhen | Tumor Sample Barcode | Tissue | Histology | Sex | Age | Stage | Therapy Types | Drugs | Outcome |
| KDM3B | SNV | Missense_Mutation | novel | c.4732N>T | p.Gly1578Trp | p.G1578W | Q7LBC6 | protein_coding | deleterious(0) | probably_damaging(0.99) | TCGA-A7-A0DB-01 | Breast | breast invasive carcinoma | Female | <65 | I/II | Hormone Therapy | arimidex | SD |
| KDM3B | SNV | Missense_Mutation | c.1013N>C | p.Arg338Thr | p.R338T | Q7LBC6 | protein_coding | tolerated(0.14) | benign(0.056) | TCGA-AC-A23H-01 | Breast | breast invasive carcinoma | Female | >=65 | I/II | Unknown | Unknown | PD | |
| KDM3B | SNV | Missense_Mutation | novel | c.1189N>C | p.Glu397Gln | p.E397Q | Q7LBC6 | protein_coding | tolerated_low_confidence(0.4) | benign(0.081) | TCGA-BH-A0B6-01 | Breast | breast invasive carcinoma | Female | <65 | I/II | Unknown | Unknown | SD |
| KDM3B | SNV | Missense_Mutation | c.952N>A | p.Glu318Lys | p.E318K | Q7LBC6 | protein_coding | tolerated(0.1) | benign(0.257) | TCGA-BH-A0HP-01 | Breast | breast invasive carcinoma | Female | >=65 | III/IV | Chemotherapy | doxorubicin | SD | |
| KDM3B | SNV | Missense_Mutation | c.3981N>C | p.Lys1327Asn | p.K1327N | Q7LBC6 | protein_coding | deleterious(0.02) | benign(0.106) | TCGA-D8-A1JA-01 | Breast | breast invasive carcinoma | Female | <65 | III/IV | Chemotherapy | adriamycin | PD | |
| KDM3B | SNV | Missense_Mutation | c.4976G>A | p.Arg1659His | p.R1659H | Q7LBC6 | protein_coding | deleterious(0) | probably_damaging(1) | TCGA-D8-A1Y2-01 | Breast | breast invasive carcinoma | Female | >=65 | I/II | Hormone Therapy | tamoxiphen | SD | |
| KDM3B | SNV | Missense_Mutation | rs760813802 | c.5257N>A | p.Ala1753Thr | p.A1753T | Q7LBC6 | protein_coding | deleterious(0.03) | benign(0.118) | TCGA-E2-A14N-01 | Breast | breast invasive carcinoma | Female | <65 | I/II | Chemotherapy | cyclophosphamide | SD |
| KDM3B | SNV | Missense_Mutation | c.2030N>G | p.Ser677Cys | p.S677C | Q7LBC6 | protein_coding | deleterious_low_confidence(0.04) | benign(0.436) | TCGA-EW-A1J5-01 | Breast | breast invasive carcinoma | Female | <65 | I/II | Chemotherapy | adriamycin | SD | |
| KDM3B | SNV | Missense_Mutation | rs745528581 | c.4366N>A | p.Asp1456Asn | p.D1456N | Q7LBC6 | protein_coding | tolerated(0.45) | benign(0.059) | TCGA-PE-A5DE-01 | Breast | breast invasive carcinoma | Female | <65 | I/II | Chemotherapy | taxotere | CR |
| KDM3B | SNV | Missense_Mutation | novel | c.4148C>A | p.Ser1383Tyr | p.S1383Y | Q7LBC6 | protein_coding | tolerated(0.2) | benign(0.167) | TCGA-XX-A89A-01 | Breast | breast invasive carcinoma | Female | >=65 | I/II | Unknown | Unknown | SD |
| Page: 1 2 3 4 5 6 7 8 9 10 11 12 13 14 15 16 17 18 |
Top |
Related drugs of malignant transformation related genes |
| Identification of chemicals and drugs interact with genes involved in malignant transfromation |
| (DGIdb 4.0) |
| Entrez ID | Symbol | Category | Interaction Types | Drug Claim Name | Drug Name | PMIDs |
| Page: 1 |

Copyright 2023-Present -The University of Texas Health Science Center at Houston |