
|
|||||
|
 | |
| |
| |
| |
| |
| |
|
Gene: KDM3A |
Gene summary for KDM3A |
| Gene information | Species | Human | Gene symbol | KDM3A | Gene ID | 55818 |
| Gene name | lysine demethylase 3A | |
| Gene Alias | JHDM2A | |
| Cytomap | 2p11.2 | |
| Gene Type | protein-coding | GO ID | GO:0000003 | UniProtAcc | Q9Y4C1 |
Top |
Malignant transformation analysis |
| Identification of the aberrant gene expression in precancerous and cancerous lesions by comparing the gene expression of stem-like cells in diseased tissues with normal stem cells |
| Entrez ID | Symbol | Replicates | Species | Organ | Tissue | Adj P-value | Log2FC | Malignancy |
| 55818 | KDM3A | CCI_1 | Human | Cervix | CC | 1.87e-05 | 7.07e-01 | 0.528 |
| 55818 | KDM3A | CCI_2 | Human | Cervix | CC | 1.90e-02 | 4.66e-01 | 0.5249 |
| 55818 | KDM3A | CCI_3 | Human | Cervix | CC | 1.13e-06 | 5.99e-01 | 0.516 |
| 55818 | KDM3A | LZE4T | Human | Esophagus | ESCC | 9.12e-13 | 5.10e-01 | 0.0811 |
| 55818 | KDM3A | LZE7T | Human | Esophagus | ESCC | 1.89e-03 | 3.65e-01 | 0.0667 |
| 55818 | KDM3A | LZE8T | Human | Esophagus | ESCC | 4.23e-09 | 1.66e-01 | 0.067 |
| 55818 | KDM3A | LZE22T | Human | Esophagus | ESCC | 1.43e-03 | 1.92e-01 | 0.068 |
| 55818 | KDM3A | LZE24T | Human | Esophagus | ESCC | 1.77e-15 | 3.08e-01 | 0.0596 |
| 55818 | KDM3A | LZE6T | Human | Esophagus | ESCC | 1.52e-02 | 1.73e-02 | 0.0845 |
| 55818 | KDM3A | P1T-E | Human | Esophagus | ESCC | 1.92e-06 | 2.93e-01 | 0.0875 |
| 55818 | KDM3A | P2T-E | Human | Esophagus | ESCC | 8.51e-19 | 3.77e-01 | 0.1177 |
| 55818 | KDM3A | P4T-E | Human | Esophagus | ESCC | 2.34e-10 | 3.05e-01 | 0.1323 |
| 55818 | KDM3A | P5T-E | Human | Esophagus | ESCC | 1.51e-13 | 1.97e-01 | 0.1327 |
| 55818 | KDM3A | P8T-E | Human | Esophagus | ESCC | 8.67e-16 | 1.02e-01 | 0.0889 |
| 55818 | KDM3A | P9T-E | Human | Esophagus | ESCC | 6.97e-11 | 9.47e-02 | 0.1131 |
| 55818 | KDM3A | P10T-E | Human | Esophagus | ESCC | 4.30e-21 | 5.07e-01 | 0.116 |
| 55818 | KDM3A | P11T-E | Human | Esophagus | ESCC | 2.69e-07 | 4.03e-01 | 0.1426 |
| 55818 | KDM3A | P12T-E | Human | Esophagus | ESCC | 2.70e-22 | 4.47e-01 | 0.1122 |
| 55818 | KDM3A | P15T-E | Human | Esophagus | ESCC | 3.49e-23 | 6.34e-01 | 0.1149 |
| 55818 | KDM3A | P16T-E | Human | Esophagus | ESCC | 2.29e-14 | 3.02e-01 | 0.1153 |
| Page: 1 2 3 4 |
| Tissue | Expression Dynamics | Abbreviation |
| Cervix | 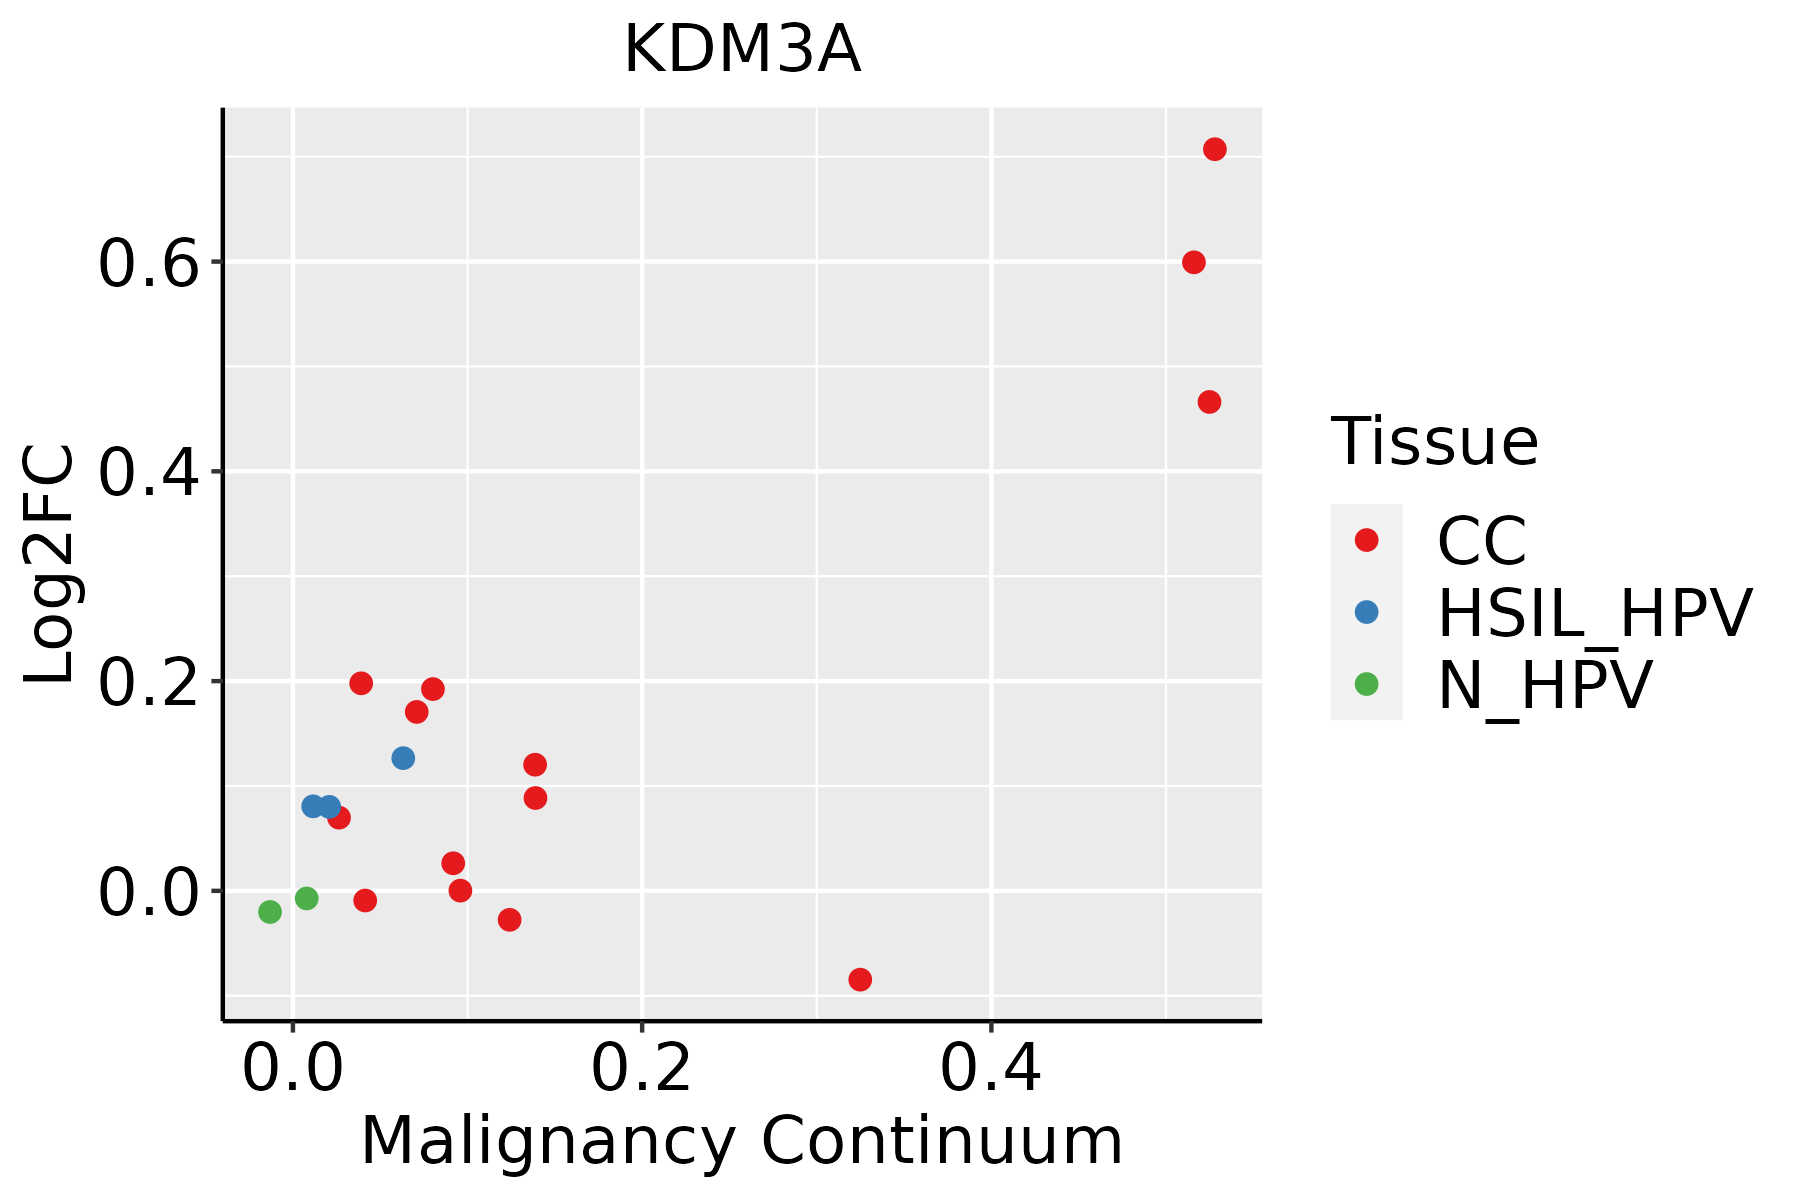 | CC: Cervix cancer |
| HSIL_HPV: HPV-infected high-grade squamous intraepithelial lesions | ||
| N_HPV: HPV-infected normal cervix | ||
| Esophagus | 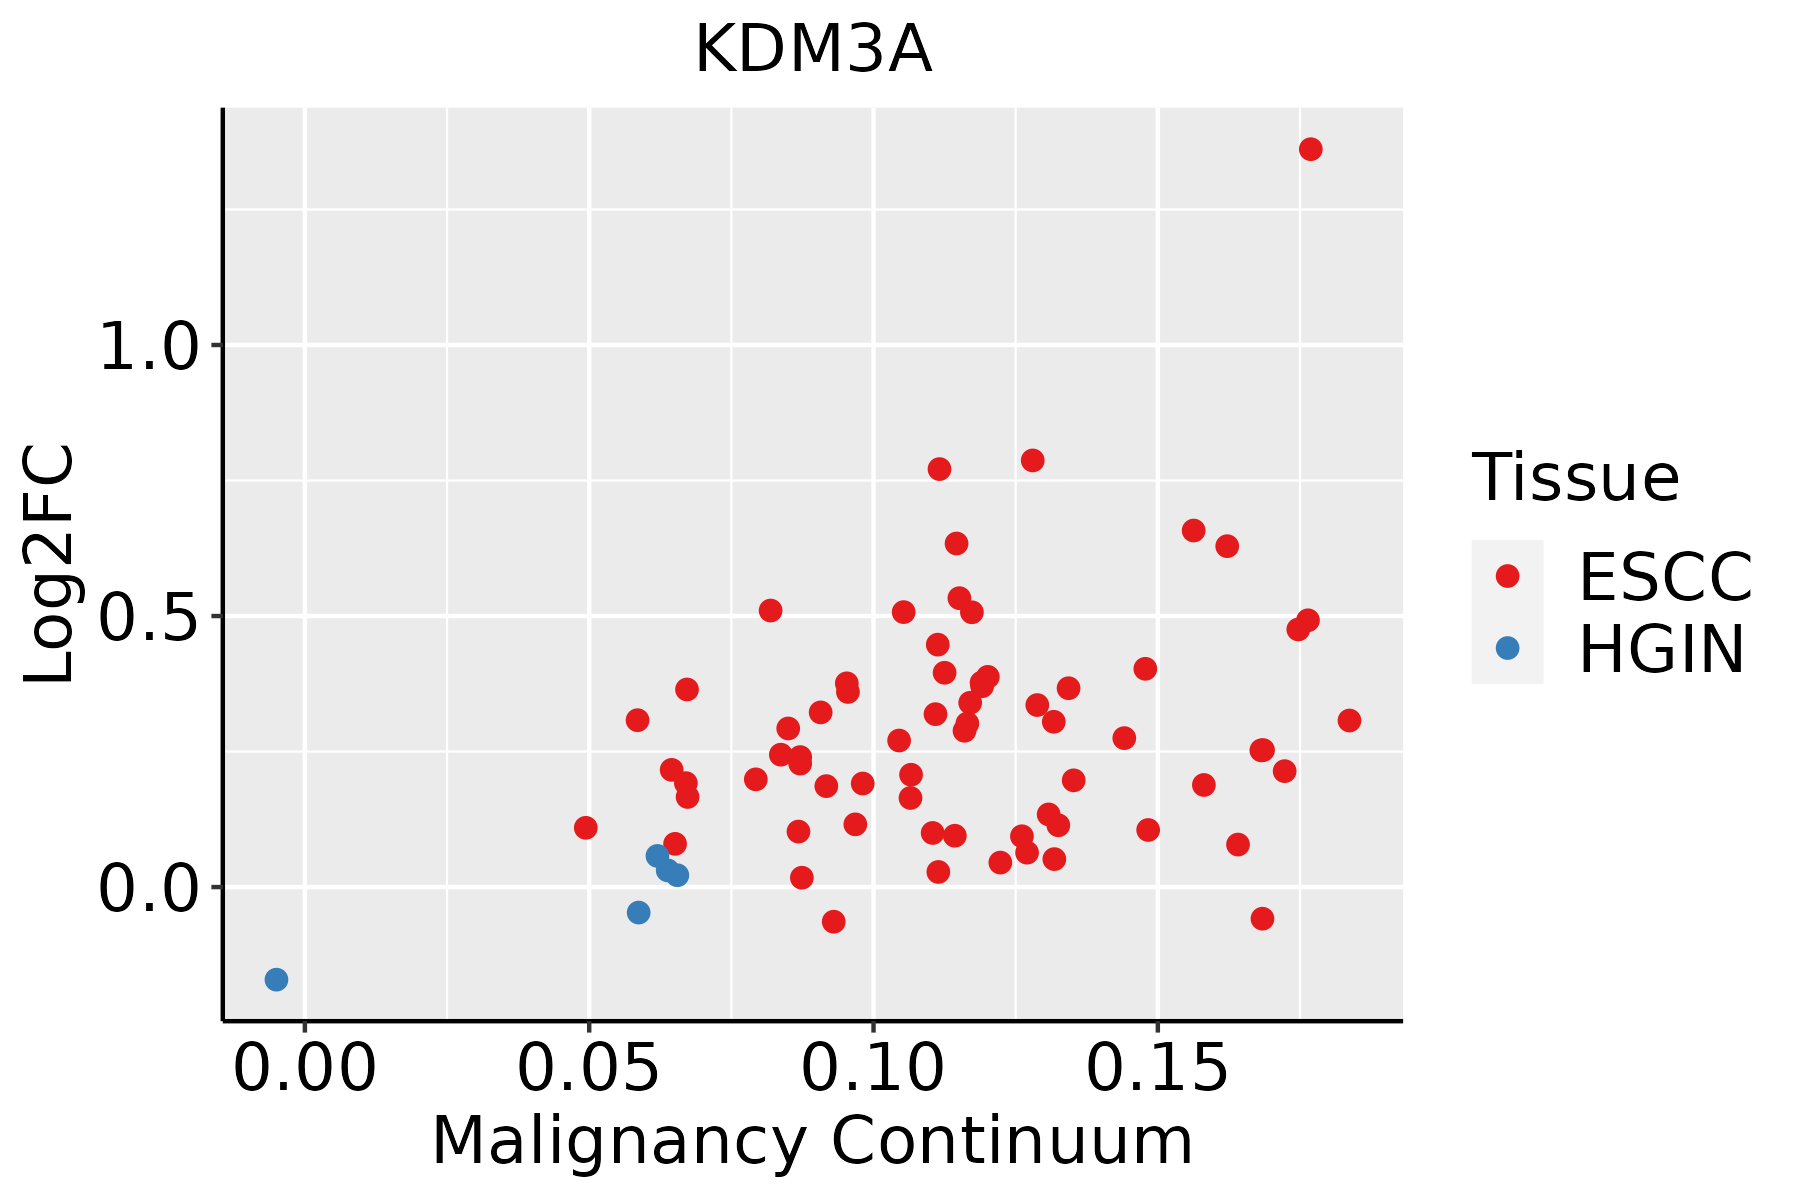 | ESCC: Esophageal squamous cell carcinoma |
| HGIN: High-grade intraepithelial neoplasias | ||
| LGIN: Low-grade intraepithelial neoplasias | ||
| Liver | 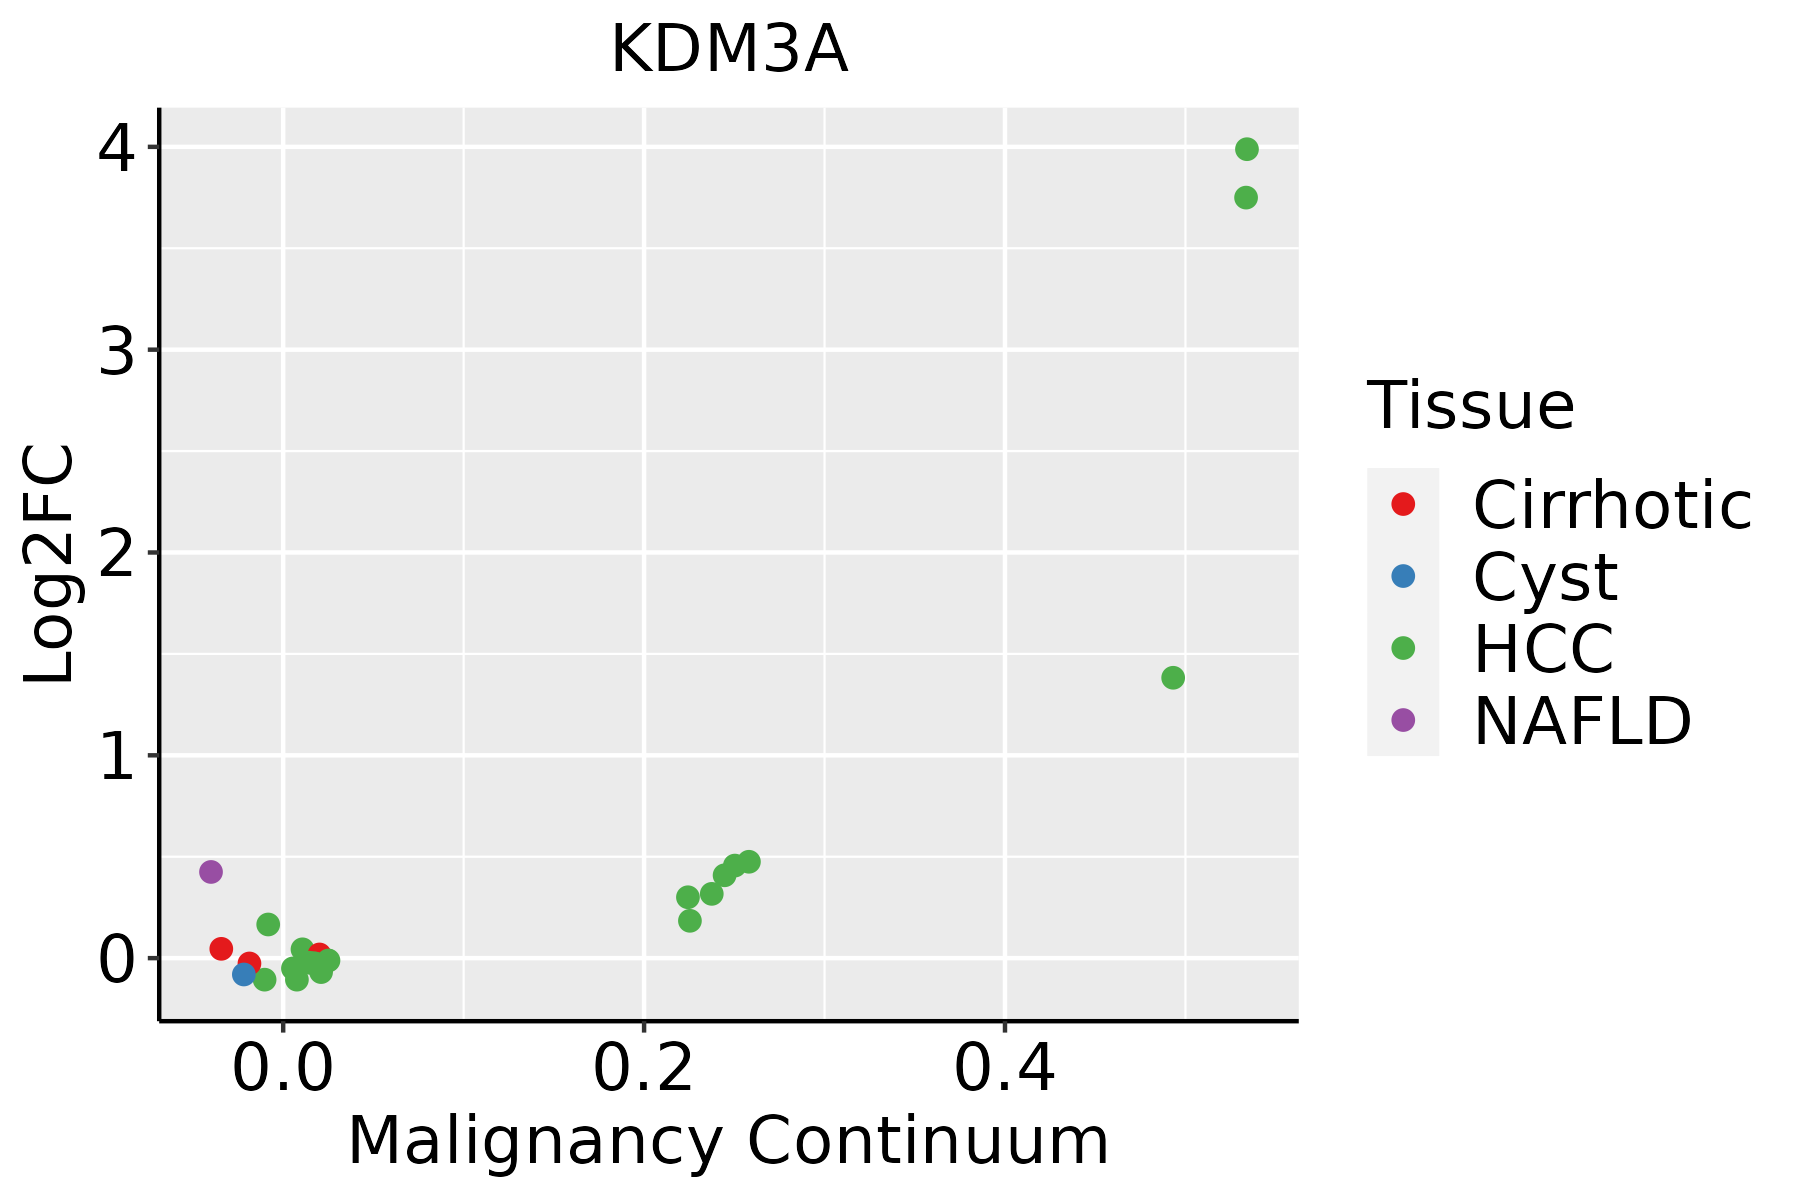 | HCC: Hepatocellular carcinoma |
| NAFLD: Non-alcoholic fatty liver disease |
| ∗log2FC in expression of this searched gene in stem-like cells from each diseased tissue sample relative to stem-like cells in normal samples in each tissue plotted against the malignancy continuum. Samples are colored based on if they are from different disease stage. |
Top |
Malignant transformation related pathway analysis |
| Find out the enriched GO biological processes and KEGG pathways involved in transition from healthy to precancer to cancer |
| Tissue | Disease Stage | Enriched GO biological Processes |
| Colorectum | AD |  |
| Colorectum | SER |  |
| Colorectum | MSS |  |
| Colorectum | MSI-H |  |
| Colorectum | FAP |  |
| ∗Top 15 enriched GO BP terms are showed in the bar plot of each disease state in each tissue. Each row represents a significant GO biological process which is colored according to the -log10(p.adjust). |
| Page: 1 2 3 4 5 6 7 8 9 |
| GO ID | Tissue | Disease Stage | Description | Gene Ratio | Bg Ratio | pvalue | p.adjust | Count |
| GO:004854510 | Cervix | CC | response to steroid hormone | 74/2311 | 339/18723 | 5.71e-07 | 2.09e-05 | 74 |
| GO:00305229 | Cervix | CC | intracellular receptor signaling pathway | 60/2311 | 265/18723 | 1.89e-06 | 5.97e-05 | 60 |
| GO:20007362 | Cervix | CC | regulation of stem cell differentiation | 19/2311 | 58/18723 | 4.01e-05 | 6.21e-04 | 19 |
| GO:00488634 | Cervix | CC | stem cell differentiation | 46/2311 | 206/18723 | 4.11e-05 | 6.36e-04 | 46 |
| GO:00165705 | Cervix | CC | histone modification | 84/2311 | 463/18723 | 1.70e-04 | 2.01e-03 | 84 |
| GO:00349685 | Cervix | CC | histone lysine methylation | 27/2311 | 115/18723 | 6.61e-04 | 6.09e-03 | 27 |
| GO:00310565 | Cervix | CC | regulation of histone modification | 33/2311 | 152/18723 | 7.97e-04 | 7.00e-03 | 33 |
| GO:00987275 | Cervix | CC | maintenance of cell number | 30/2311 | 134/18723 | 7.98e-04 | 7.00e-03 | 30 |
| GO:00198274 | Cervix | CC | stem cell population maintenance | 29/2311 | 131/18723 | 1.17e-03 | 9.47e-03 | 29 |
| GO:00165715 | Cervix | CC | histone methylation | 30/2311 | 141/18723 | 1.88e-03 | 1.39e-02 | 30 |
| GO:00713839 | Cervix | CC | cellular response to steroid hormone stimulus | 40/2311 | 204/18723 | 1.93e-03 | 1.42e-02 | 40 |
| GO:19908234 | Cervix | CC | response to leukemia inhibitory factor | 22/2311 | 95/18723 | 2.40e-03 | 1.70e-02 | 22 |
| GO:00180224 | Cervix | CC | peptidyl-lysine methylation | 28/2311 | 131/18723 | 2.43e-03 | 1.71e-02 | 28 |
| GO:00064795 | Cervix | CC | protein methylation | 36/2311 | 181/18723 | 2.46e-03 | 1.71e-02 | 36 |
| GO:00082135 | Cervix | CC | protein alkylation | 36/2311 | 181/18723 | 2.46e-03 | 1.71e-02 | 36 |
| GO:00305188 | Cervix | CC | intracellular steroid hormone receptor signaling pathway | 25/2311 | 116/18723 | 3.59e-03 | 2.30e-02 | 25 |
| GO:19908304 | Cervix | CC | cellular response to leukemia inhibitory factor | 21/2311 | 94/18723 | 4.68e-03 | 2.82e-02 | 21 |
| GO:00305218 | Cervix | CC | androgen receptor signaling pathway | 12/2311 | 44/18723 | 5.76e-03 | 3.30e-02 | 12 |
| GO:00182054 | Cervix | CC | peptidyl-lysine modification | 62/2311 | 376/18723 | 1.04e-02 | 4.97e-02 | 62 |
| GO:001657015 | Esophagus | ESCC | histone modification | 323/8552 | 463/18723 | 2.61e-26 | 7.88e-24 | 323 |
| Page: 1 2 3 4 5 |
| Pathway ID | Tissue | Disease Stage | Description | Gene Ratio | Bg Ratio | pvalue | p.adjust | qvalue | Count |
| hsa0471420 | Cervix | CC | Thermogenesis | 76/1267 | 232/8465 | 4.29e-12 | 1.16e-10 | 6.85e-11 | 76 |
| hsa04714110 | Cervix | CC | Thermogenesis | 76/1267 | 232/8465 | 4.29e-12 | 1.16e-10 | 6.85e-11 | 76 |
| hsa04714211 | Esophagus | ESCC | Thermogenesis | 163/4205 | 232/8465 | 9.22e-11 | 1.14e-09 | 5.86e-10 | 163 |
| hsa04714310 | Esophagus | ESCC | Thermogenesis | 163/4205 | 232/8465 | 9.22e-11 | 1.14e-09 | 5.86e-10 | 163 |
| hsa0471422 | Liver | HCC | Thermogenesis | 170/4020 | 232/8465 | 5.36e-16 | 2.25e-14 | 1.25e-14 | 170 |
| hsa0471432 | Liver | HCC | Thermogenesis | 170/4020 | 232/8465 | 5.36e-16 | 2.25e-14 | 1.25e-14 | 170 |
| Page: 1 |
Top |
Cell-cell communication analysis |
| Identification of potential cell-cell interactions between two cell types and their ligand-receptor pairs for different disease states |
| Ligand | Receptor | LRpair | Pathway | Tissue | Disease Stage |
| Page: 1 |
Top |
Single-cell gene regulatory network inference analysis |
| Find out the significant the regulons (TFs) and the target genes of each regulon across cell types for different disease states |
| TF | Cell Type | Tissue | Disease Stage | Target Gene | RSS | Regulon Activity |
| ∗The dot plots of a searched regulon are shown for all cell subpopulations in each disease state of each tissue based on the regulon specific score inferred using pySCENIC and by calculating the average expression. |
| Page: 1 |
Top |
Somatic mutation of malignant transformation related genes |
| Annotation of somatic variants for genes involved in malignant transformation |
| Hugo Symbol | Variant Class | Variant Classification | dbSNP RS | HGVSc | HGVSp | HGVSp Short | SWISSPROT | BIOTYPE | SIFT | PolyPhen | Tumor Sample Barcode | Tissue | Histology | Sex | Age | Stage | Therapy Types | Drugs | Outcome |
| KDM3A | SNV | Missense_Mutation | c.3430G>C | p.Glu1144Gln | p.E1144Q | Q9Y4C1 | protein_coding | tolerated(0.35) | benign(0.015) | TCGA-A8-A08R-01 | Breast | breast invasive carcinoma | Female | <65 | I/II | Unknown | Unknown | SD | |
| KDM3A | SNV | Missense_Mutation | novel | c.1073N>T | p.Arg358Ile | p.R358I | Q9Y4C1 | protein_coding | tolerated_low_confidence(0.1) | benign(0.107) | TCGA-AN-A046-01 | Breast | breast invasive carcinoma | Female | >=65 | I/II | Unknown | Unknown | SD |
| KDM3A | SNV | Missense_Mutation | c.2486N>A | p.Ser829Asn | p.S829N | Q9Y4C1 | protein_coding | tolerated(0.07) | possibly_damaging(0.468) | TCGA-AO-A03V-01 | Breast | breast invasive carcinoma | Female | <65 | I/II | Chemotherapy | fluorouracil | SD | |
| KDM3A | SNV | Missense_Mutation | c.2007N>G | p.Ile669Met | p.I669M | Q9Y4C1 | protein_coding | deleterious(0) | probably_damaging(0.943) | TCGA-D8-A1JA-01 | Breast | breast invasive carcinoma | Female | <65 | III/IV | Chemotherapy | adriamycin | PD | |
| KDM3A | SNV | Missense_Mutation | c.3685C>G | p.Gln1229Glu | p.Q1229E | Q9Y4C1 | protein_coding | deleterious(0) | benign(0.351) | TCGA-D8-A1JL-01 | Breast | breast invasive carcinoma | Female | >=65 | I/II | Unknown | Unknown | SD | |
| KDM3A | SNV | Missense_Mutation | novel | c.2647N>A | p.Gly883Ser | p.G883S | Q9Y4C1 | protein_coding | tolerated(1) | benign(0.349) | TCGA-D8-A27L-01 | Breast | breast invasive carcinoma | Female | <65 | III/IV | Chemotherapy | adriamycin+cuclophosphamide | SD |
| KDM3A | SNV | Missense_Mutation | c.2279N>G | p.Leu760Arg | p.L760R | Q9Y4C1 | protein_coding | tolerated(0.39) | benign(0.391) | TCGA-E2-A150-01 | Breast | breast invasive carcinoma | Female | <65 | I/II | Chemotherapy | doxorubicin | SD | |
| KDM3A | SNV | Missense_Mutation | c.2778N>T | p.Arg926Ser | p.R926S | Q9Y4C1 | protein_coding | deleterious(0) | benign(0.012) | TCGA-GM-A2DB-01 | Breast | breast invasive carcinoma | Female | <65 | I/II | Chemotherapy | taxol | CR | |
| KDM3A | insertion | Frame_Shift_Ins | novel | c.3961_3962insATGAAATTATGTTACATAATTCATTA | p.Pro1321HisfsTer18 | p.P1321Hfs*18 | Q9Y4C1 | protein_coding | TCGA-AR-A0U0-01 | Breast | breast invasive carcinoma | Female | >=65 | I/II | Unknown | Unknown | SD | ||
| KDM3A | insertion | Nonsense_Mutation | novel | c.3838_3839insATTTTGAAGGAAGTATGTATTGTTGAATGCAGTTCTAGTTGTTTGAATA | p.Phe1280TyrfsTer9 | p.F1280Yfs*9 | Q9Y4C1 | protein_coding | TCGA-BH-A0B8-01 | Breast | breast invasive carcinoma | Female | <65 | I/II | Hormone Therapy | arimidex | SD |
| Page: 1 2 3 4 5 6 7 8 9 10 11 12 |
Top |
Related drugs of malignant transformation related genes |
| Identification of chemicals and drugs interact with genes involved in malignant transfromation |
| (DGIdb 4.0) |
| Entrez ID | Symbol | Category | Interaction Types | Drug Claim Name | Drug Name | PMIDs |
| 55818 | KDM3A | ENZYME | inhibitor | 249565910 |
| Page: 1 |

Copyright 2023-Present -The University of Texas Health Science Center at Houston |