
|
|||||
|
 | |
| |
| |
| |
| |
| |
|
Gene: KDM2B |
Gene summary for KDM2B |
| Gene information | Species | Human | Gene symbol | KDM2B | Gene ID | 84678 |
| Gene name | lysine demethylase 2B | |
| Gene Alias | CXXC2 | |
| Cytomap | 12q24.31 | |
| Gene Type | protein-coding | GO ID | GO:0000003 | UniProtAcc | Q8NHM5 |
Top |
Malignant transformation analysis |
| Identification of the aberrant gene expression in precancerous and cancerous lesions by comparing the gene expression of stem-like cells in diseased tissues with normal stem cells |
| Entrez ID | Symbol | Replicates | Species | Organ | Tissue | Adj P-value | Log2FC | Malignancy |
| 84678 | KDM2B | LZE7T | Human | Esophagus | ESCC | 4.52e-03 | 1.57e-01 | 0.0667 |
| 84678 | KDM2B | LZE24T | Human | Esophagus | ESCC | 2.93e-03 | 1.56e-01 | 0.0596 |
| 84678 | KDM2B | P2T-E | Human | Esophagus | ESCC | 1.48e-41 | 7.82e-01 | 0.1177 |
| 84678 | KDM2B | P4T-E | Human | Esophagus | ESCC | 1.09e-07 | 2.23e-01 | 0.1323 |
| 84678 | KDM2B | P5T-E | Human | Esophagus | ESCC | 2.67e-09 | 1.16e-01 | 0.1327 |
| 84678 | KDM2B | P8T-E | Human | Esophagus | ESCC | 3.20e-18 | 2.35e-01 | 0.0889 |
| 84678 | KDM2B | P9T-E | Human | Esophagus | ESCC | 1.92e-03 | 7.94e-02 | 0.1131 |
| 84678 | KDM2B | P10T-E | Human | Esophagus | ESCC | 4.99e-16 | 1.93e-01 | 0.116 |
| 84678 | KDM2B | P11T-E | Human | Esophagus | ESCC | 2.03e-04 | 2.66e-01 | 0.1426 |
| 84678 | KDM2B | P12T-E | Human | Esophagus | ESCC | 2.27e-21 | 2.29e-01 | 0.1122 |
| 84678 | KDM2B | P15T-E | Human | Esophagus | ESCC | 1.89e-08 | 1.85e-01 | 0.1149 |
| 84678 | KDM2B | P16T-E | Human | Esophagus | ESCC | 7.33e-11 | 2.93e-01 | 0.1153 |
| 84678 | KDM2B | P20T-E | Human | Esophagus | ESCC | 3.88e-07 | 1.82e-01 | 0.1124 |
| 84678 | KDM2B | P21T-E | Human | Esophagus | ESCC | 8.32e-21 | 3.51e-01 | 0.1617 |
| 84678 | KDM2B | P22T-E | Human | Esophagus | ESCC | 9.53e-12 | 1.34e-01 | 0.1236 |
| 84678 | KDM2B | P23T-E | Human | Esophagus | ESCC | 1.37e-11 | 2.07e-01 | 0.108 |
| 84678 | KDM2B | P24T-E | Human | Esophagus | ESCC | 2.64e-13 | 7.68e-02 | 0.1287 |
| 84678 | KDM2B | P26T-E | Human | Esophagus | ESCC | 2.43e-14 | 2.58e-01 | 0.1276 |
| 84678 | KDM2B | P27T-E | Human | Esophagus | ESCC | 1.02e-21 | 3.20e-01 | 0.1055 |
| 84678 | KDM2B | P28T-E | Human | Esophagus | ESCC | 1.15e-18 | 2.98e-01 | 0.1149 |
| Page: 1 2 3 |
| Tissue | Expression Dynamics | Abbreviation |
| Esophagus | 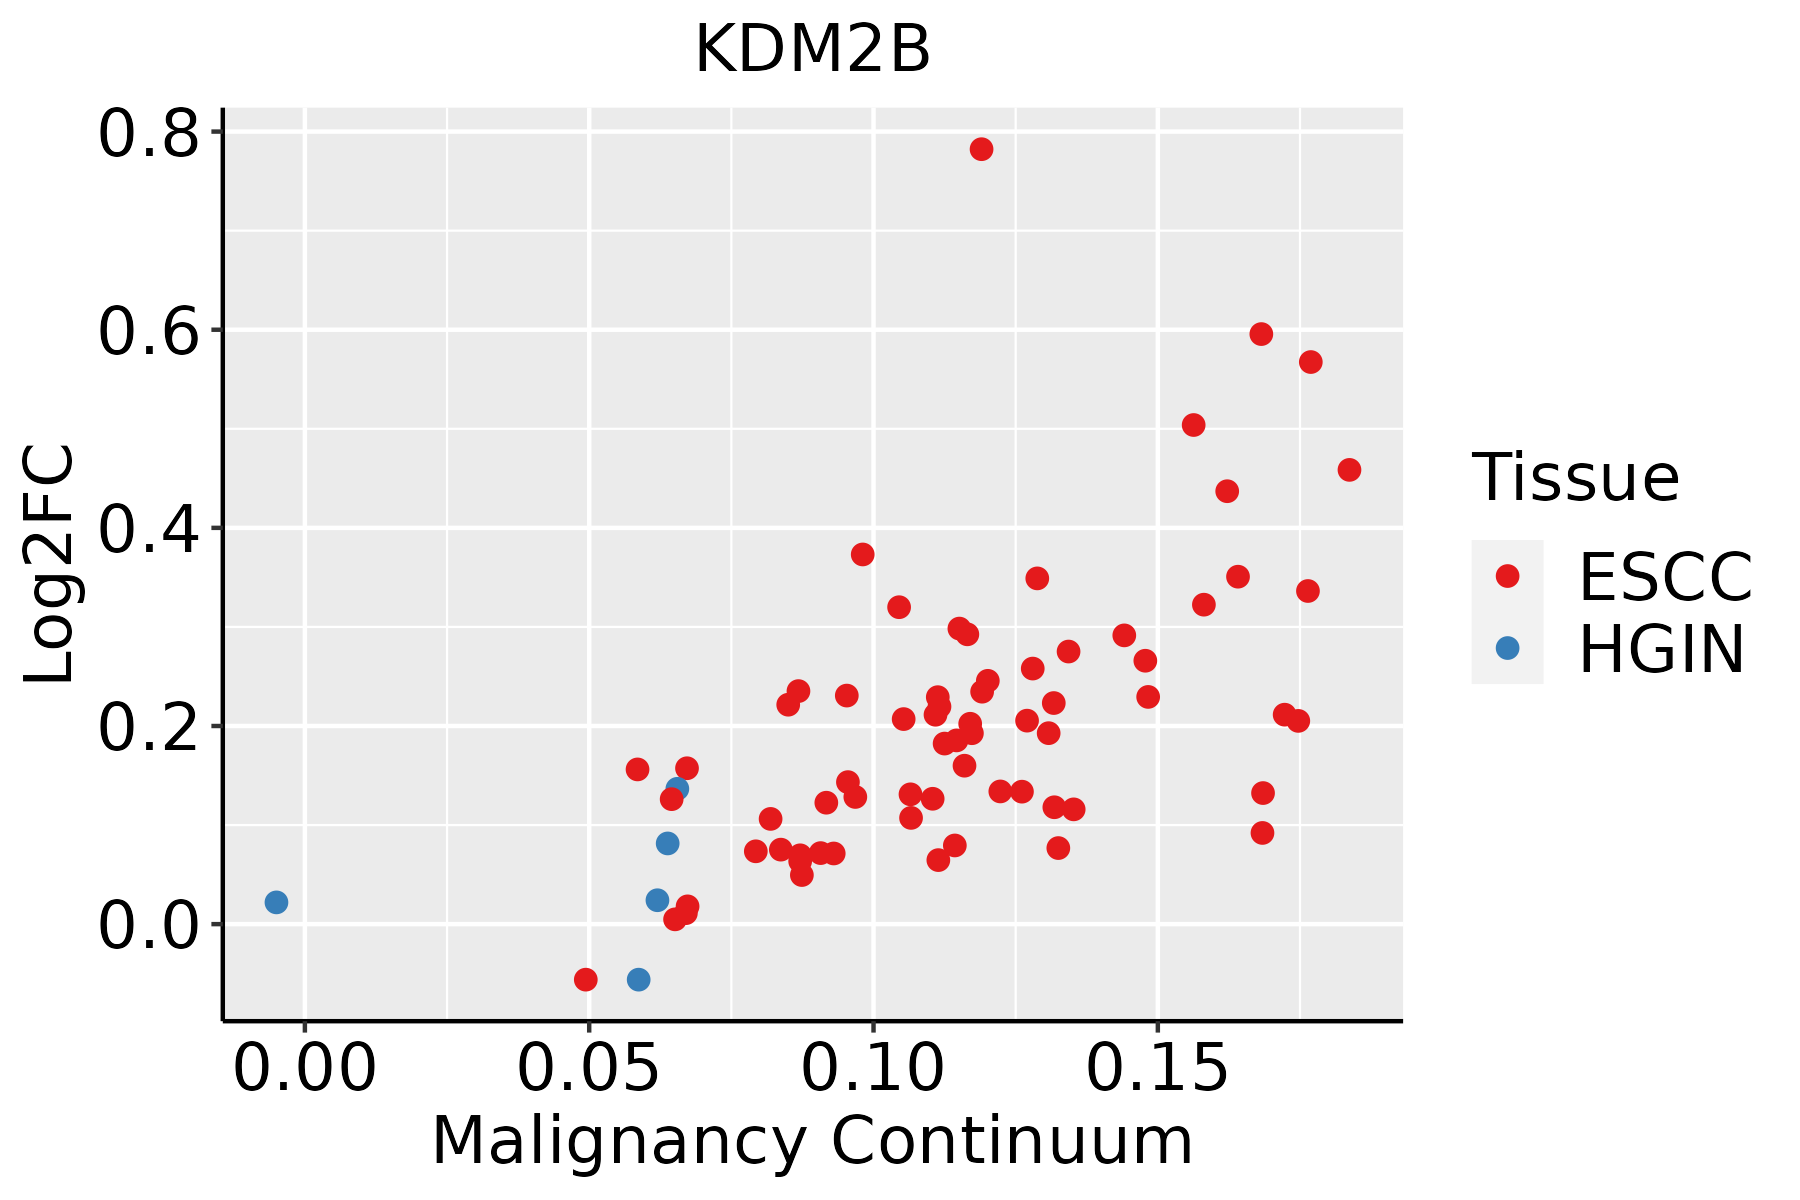 | ESCC: Esophageal squamous cell carcinoma |
| HGIN: High-grade intraepithelial neoplasias | ||
| LGIN: Low-grade intraepithelial neoplasias |
| ∗log2FC in expression of this searched gene in stem-like cells from each diseased tissue sample relative to stem-like cells in normal samples in each tissue plotted against the malignancy continuum. Samples are colored based on if they are from different disease stage. |
Top |
Malignant transformation related pathway analysis |
| Find out the enriched GO biological processes and KEGG pathways involved in transition from healthy to precancer to cancer |
| Tissue | Disease Stage | Enriched GO biological Processes |
| Colorectum | AD |  |
| Colorectum | SER |  |
| Colorectum | MSS |  |
| Colorectum | MSI-H |  |
| Colorectum | FAP |  |
| ∗Top 15 enriched GO BP terms are showed in the bar plot of each disease state in each tissue. Each row represents a significant GO biological process which is colored according to the -log10(p.adjust). |
| Page: 1 2 3 4 5 6 7 8 9 |
| GO ID | Tissue | Disease Stage | Description | Gene Ratio | Bg Ratio | pvalue | p.adjust | Count |
| GO:001657015 | Esophagus | ESCC | histone modification | 323/8552 | 463/18723 | 2.61e-26 | 7.88e-24 | 323 |
| GO:0016049110 | Esophagus | ESCC | cell growth | 289/8552 | 482/18723 | 1.29e-10 | 3.77e-09 | 289 |
| GO:000155819 | Esophagus | ESCC | regulation of cell growth | 248/8552 | 414/18723 | 2.97e-09 | 6.45e-08 | 248 |
| GO:000184115 | Esophagus | ESCC | neural tube formation | 75/8552 | 102/18723 | 9.68e-09 | 1.95e-07 | 75 |
| GO:000184314 | Esophagus | ESCC | neural tube closure | 66/8552 | 88/18723 | 1.98e-08 | 3.82e-07 | 66 |
| GO:00065136 | Esophagus | ESCC | protein monoubiquitination | 53/8552 | 67/18723 | 2.11e-08 | 4.03e-07 | 53 |
| GO:001657414 | Esophagus | ESCC | histone ubiquitination | 40/8552 | 47/18723 | 2.40e-08 | 4.55e-07 | 40 |
| GO:0070997111 | Esophagus | ESCC | neuron death | 216/8552 | 361/18723 | 3.49e-08 | 6.45e-07 | 216 |
| GO:001402014 | Esophagus | ESCC | primary neural tube formation | 69/8552 | 94/18723 | 4.22e-08 | 7.76e-07 | 69 |
| GO:006060614 | Esophagus | ESCC | tube closure | 66/8552 | 89/18723 | 4.24e-08 | 7.76e-07 | 66 |
| GO:00219159 | Esophagus | ESCC | neural tube development | 101/8552 | 152/18723 | 1.78e-07 | 2.79e-06 | 101 |
| GO:00163316 | Esophagus | ESCC | morphogenesis of embryonic epithelium | 98/8552 | 147/18723 | 2.12e-07 | 3.27e-06 | 98 |
| GO:000183814 | Esophagus | ESCC | embryonic epithelial tube formation | 83/8552 | 121/18723 | 2.78e-07 | 4.08e-06 | 83 |
| GO:009872714 | Esophagus | ESCC | maintenance of cell number | 90/8552 | 134/18723 | 3.94e-07 | 5.43e-06 | 90 |
| GO:001982714 | Esophagus | ESCC | stem cell population maintenance | 88/8552 | 131/18723 | 5.23e-07 | 6.97e-06 | 88 |
| GO:003514815 | Esophagus | ESCC | tube formation | 96/8552 | 148/18723 | 1.86e-06 | 2.16e-05 | 96 |
| GO:0051402110 | Esophagus | ESCC | neuron apoptotic process | 148/8552 | 246/18723 | 3.08e-06 | 3.47e-05 | 148 |
| GO:1901214111 | Esophagus | ESCC | regulation of neuron death | 186/8552 | 319/18723 | 3.35e-06 | 3.73e-05 | 186 |
| GO:00721759 | Esophagus | ESCC | epithelial tube formation | 86/8552 | 132/18723 | 4.81e-06 | 5.10e-05 | 86 |
| GO:003352213 | Esophagus | ESCC | histone H2A ubiquitination | 23/8552 | 26/18723 | 6.82e-06 | 6.90e-05 | 23 |
| Page: 1 2 |
| Pathway ID | Tissue | Disease Stage | Description | Gene Ratio | Bg Ratio | pvalue | p.adjust | qvalue | Count |
| Page: 1 |
Top |
Cell-cell communication analysis |
| Identification of potential cell-cell interactions between two cell types and their ligand-receptor pairs for different disease states |
| Ligand | Receptor | LRpair | Pathway | Tissue | Disease Stage |
| Page: 1 |
Top |
Single-cell gene regulatory network inference analysis |
| Find out the significant the regulons (TFs) and the target genes of each regulon across cell types for different disease states |
| TF | Cell Type | Tissue | Disease Stage | Target Gene | RSS | Regulon Activity |
| KDM2B | URO | Prostate | Healthy | AC006329.1,LINC01133,TCEAL4, etc. | 5.53e-02 |  |
| KDM2B | INFIB | Prostate | BPH | GPR157,PDE4A,GPAT3, etc. | 1.68e-01 |  |
| KDM2B | cDC | Thyroid | Healthy | BIRC3,FSCN1,TRIP10, etc. | 1.20e-01 |  |
| ∗The dot plots of a searched regulon are shown for all cell subpopulations in each disease state of each tissue based on the regulon specific score inferred using pySCENIC and by calculating the average expression. |
| Page: 1 |
Top |
Somatic mutation of malignant transformation related genes |
| Annotation of somatic variants for genes involved in malignant transformation |
| Hugo Symbol | Variant Class | Variant Classification | dbSNP RS | HGVSc | HGVSp | HGVSp Short | SWISSPROT | BIOTYPE | SIFT | PolyPhen | Tumor Sample Barcode | Tissue | Histology | Sex | Age | Stage | Therapy Types | Drugs | Outcome |
| KDM2B | SNV | Missense_Mutation | rs781886803 | c.2659C>T | p.Arg887Trp | p.R887W | Q8NHM5 | protein_coding | deleterious_low_confidence(0) | possibly_damaging(0.908) | TCGA-A2-A0YG-01 | Breast | breast invasive carcinoma | Female | <65 | III/IV | Chemotherapy | cytoxan | SD |
| KDM2B | SNV | Missense_Mutation | novel | c.1279N>A | p.Glu427Lys | p.E427K | Q8NHM5 | protein_coding | tolerated(0.15) | benign(0) | TCGA-AC-A3TN-01 | Breast | breast invasive carcinoma | Female | >=65 | I/II | Hormone Therapy | arimidex | SD |
| KDM2B | SNV | Missense_Mutation | rs781886803 | c.2659N>T | p.Arg887Trp | p.R887W | Q8NHM5 | protein_coding | deleterious_low_confidence(0) | possibly_damaging(0.908) | TCGA-AO-A03R-01 | Breast | breast invasive carcinoma | Female | <65 | I/II | Chemotherapy | doxorubicin | SD |
| KDM2B | SNV | Missense_Mutation | novel | c.2157N>G | p.Cys719Trp | p.C719W | Q8NHM5 | protein_coding | deleterious(0) | probably_damaging(0.996) | TCGA-BH-A0DS-01 | Breast | breast invasive carcinoma | Female | >=65 | III/IV | Chemotherapy | cyclophosphamide | SD |
| KDM2B | SNV | Missense_Mutation | rs782101520 | c.2773N>A | p.Glu925Lys | p.E925K | Q8NHM5 | protein_coding | tolerated_low_confidence(0.06) | possibly_damaging(0.491) | TCGA-D8-A27G-01 | Breast | breast invasive carcinoma | Female | >=65 | I/II | Unknown | Unknown | SD |
| KDM2B | insertion | Frame_Shift_Ins | novel | c.791_792insGGAGA | p.Ile264MetfsTer39 | p.I264Mfs*39 | Q8NHM5 | protein_coding | TCGA-A7-A0CJ-01 | Breast | breast invasive carcinoma | Female | <65 | I/II | Chemotherapy | cytoxan | SD | ||
| KDM2B | insertion | Frame_Shift_Ins | novel | c.790_791insGTGAGTTCAGATCTCCTTGCCTCCAGTTCAC | p.Ile264SerfsTer32 | p.I264Sfs*32 | Q8NHM5 | protein_coding | TCGA-A7-A0CJ-01 | Breast | breast invasive carcinoma | Female | <65 | I/II | Chemotherapy | cytoxan | SD | ||
| KDM2B | insertion | Frame_Shift_Ins | novel | c.2660_2661insAGTGTTCTGTCTGGCTGGTGGGC | p.Arg888ValfsTer54 | p.R888Vfs*54 | Q8NHM5 | protein_coding | TCGA-AO-A03R-01 | Breast | breast invasive carcinoma | Female | <65 | I/II | Chemotherapy | doxorubicin | SD | ||
| KDM2B | insertion | Frame_Shift_Ins | novel | c.1531_1532insGCCTCGAGAGACGAACCCCTCCAGCCTTGTCAGGAAGC | p.Glu511GlyfsTer17 | p.E511Gfs*17 | Q8NHM5 | protein_coding | TCGA-AR-A0TY-01 | Breast | breast invasive carcinoma | Female | <65 | I/II | Unspecific | Paclitaxel | PD | ||
| KDM2B | SNV | Missense_Mutation | rs558601418 | c.3310N>T | p.Arg1104Cys | p.R1104C | Q8NHM5 | protein_coding | deleterious(0.05) | benign(0.007) | TCGA-2W-A8YY-01 | Cervix | cervical & endocervical cancer | Female | <65 | I/II | Chemotherapy | cisplatin | CR |
| Page: 1 2 3 4 5 6 7 8 9 10 11 12 13 14 |
Top |
Related drugs of malignant transformation related genes |
| Identification of chemicals and drugs interact with genes involved in malignant transfromation |
| (DGIdb 4.0) |
| Entrez ID | Symbol | Category | Interaction Types | Drug Claim Name | Drug Name | PMIDs |
| Page: 1 |

Copyright 2023-Present -The University of Texas Health Science Center at Houston |