
|
|||||
|
 | |
| |
| |
| |
| |
| |
|
Gene: KDM1B |
Gene summary for KDM1B |
| Gene information | Species | Human | Gene symbol | KDM1B | Gene ID | 221656 |
| Gene name | lysine demethylase 1B | |
| Gene Alias | AOF1 | |
| Cytomap | 6p22.3 | |
| Gene Type | protein-coding | GO ID | GO:0000003 | UniProtAcc | Q8NB78 |
Top |
Malignant transformation analysis |
| Identification of the aberrant gene expression in precancerous and cancerous lesions by comparing the gene expression of stem-like cells in diseased tissues with normal stem cells |
| Entrez ID | Symbol | Replicates | Species | Organ | Tissue | Adj P-value | Log2FC | Malignancy |
| 221656 | KDM1B | LZE7T | Human | Esophagus | ESCC | 9.31e-05 | 2.38e-01 | 0.0667 |
| 221656 | KDM1B | LZE24T | Human | Esophagus | ESCC | 1.20e-09 | 1.56e-01 | 0.0596 |
| 221656 | KDM1B | P1T-E | Human | Esophagus | ESCC | 1.01e-03 | 1.56e-01 | 0.0875 |
| 221656 | KDM1B | P2T-E | Human | Esophagus | ESCC | 1.31e-16 | 2.96e-01 | 0.1177 |
| 221656 | KDM1B | P4T-E | Human | Esophagus | ESCC | 2.50e-12 | 1.74e-01 | 0.1323 |
| 221656 | KDM1B | P5T-E | Human | Esophagus | ESCC | 5.15e-04 | 8.47e-02 | 0.1327 |
| 221656 | KDM1B | P8T-E | Human | Esophagus | ESCC | 6.32e-03 | 3.57e-02 | 0.0889 |
| 221656 | KDM1B | P9T-E | Human | Esophagus | ESCC | 5.15e-05 | 1.47e-01 | 0.1131 |
| 221656 | KDM1B | P10T-E | Human | Esophagus | ESCC | 1.00e-14 | 2.20e-01 | 0.116 |
| 221656 | KDM1B | P11T-E | Human | Esophagus | ESCC | 2.30e-07 | 2.51e-01 | 0.1426 |
| 221656 | KDM1B | P12T-E | Human | Esophagus | ESCC | 3.25e-06 | 1.29e-01 | 0.1122 |
| 221656 | KDM1B | P15T-E | Human | Esophagus | ESCC | 4.13e-10 | 1.91e-01 | 0.1149 |
| 221656 | KDM1B | P16T-E | Human | Esophagus | ESCC | 2.05e-12 | 1.92e-01 | 0.1153 |
| 221656 | KDM1B | P17T-E | Human | Esophagus | ESCC | 1.11e-02 | 1.78e-01 | 0.1278 |
| 221656 | KDM1B | P19T-E | Human | Esophagus | ESCC | 8.28e-04 | 2.85e-01 | 0.1662 |
| 221656 | KDM1B | P20T-E | Human | Esophagus | ESCC | 1.76e-10 | 1.73e-01 | 0.1124 |
| 221656 | KDM1B | P21T-E | Human | Esophagus | ESCC | 1.58e-28 | 5.07e-01 | 0.1617 |
| 221656 | KDM1B | P22T-E | Human | Esophagus | ESCC | 9.70e-13 | 9.48e-02 | 0.1236 |
| 221656 | KDM1B | P23T-E | Human | Esophagus | ESCC | 1.57e-08 | 1.99e-01 | 0.108 |
| 221656 | KDM1B | P24T-E | Human | Esophagus | ESCC | 3.02e-07 | 1.47e-01 | 0.1287 |
| Page: 1 2 3 |
| Tissue | Expression Dynamics | Abbreviation |
| Esophagus | 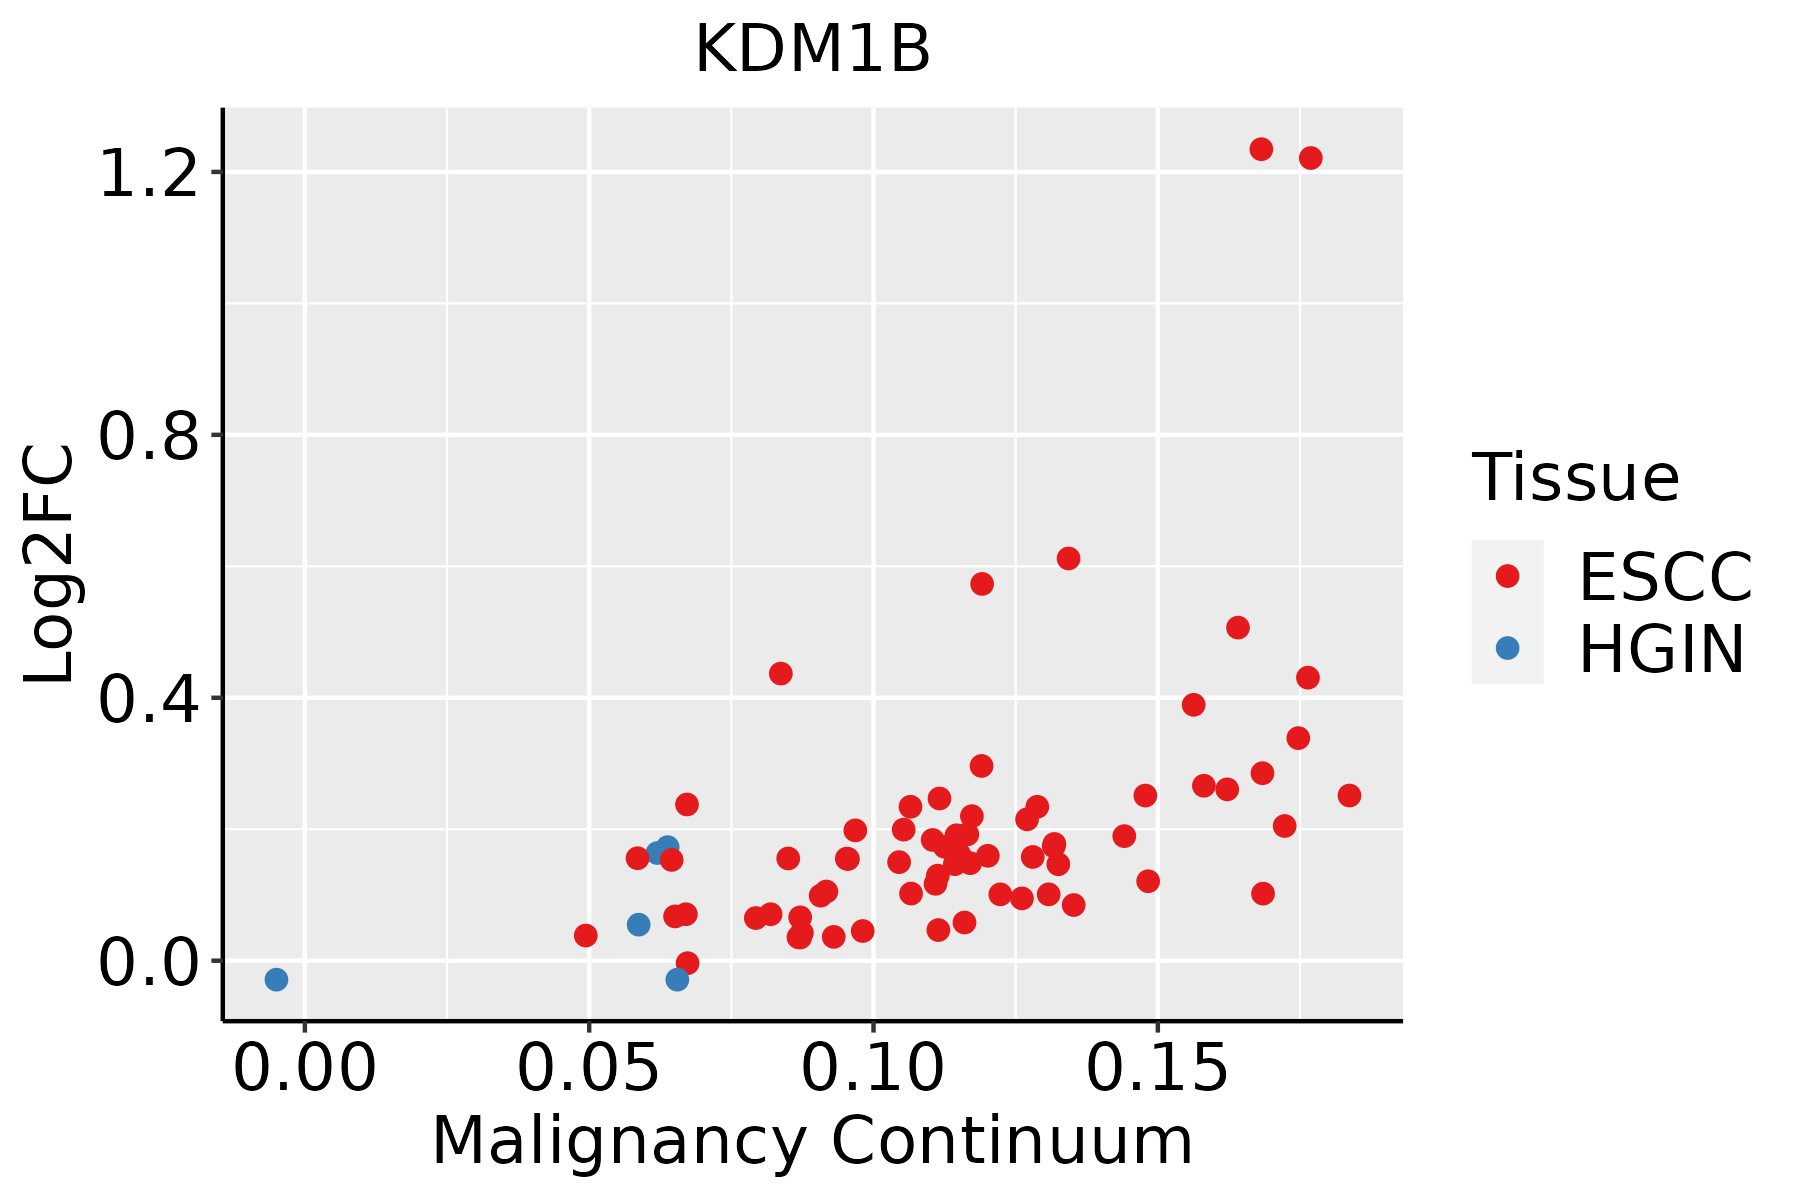 | ESCC: Esophageal squamous cell carcinoma |
| HGIN: High-grade intraepithelial neoplasias | ||
| LGIN: Low-grade intraepithelial neoplasias |
| ∗log2FC in expression of this searched gene in stem-like cells from each diseased tissue sample relative to stem-like cells in normal samples in each tissue plotted against the malignancy continuum. Samples are colored based on if they are from different disease stage. |
Top |
Malignant transformation related pathway analysis |
| Find out the enriched GO biological processes and KEGG pathways involved in transition from healthy to precancer to cancer |
| Tissue | Disease Stage | Enriched GO biological Processes |
| Colorectum | AD |  |
| Colorectum | SER |  |
| Colorectum | MSS |  |
| Colorectum | MSI-H |  |
| Colorectum | FAP |  |
| ∗Top 15 enriched GO BP terms are showed in the bar plot of each disease state in each tissue. Each row represents a significant GO biological process which is colored according to the -log10(p.adjust). |
| Page: 1 2 3 4 5 6 7 8 9 |
| GO ID | Tissue | Disease Stage | Description | Gene Ratio | Bg Ratio | pvalue | p.adjust | Count |
| GO:001657015 | Esophagus | ESCC | histone modification | 323/8552 | 463/18723 | 2.61e-26 | 7.88e-24 | 323 |
| GO:005105215 | Esophagus | ESCC | regulation of DNA metabolic process | 232/8552 | 359/18723 | 2.40e-13 | 1.13e-11 | 232 |
| GO:00434143 | Esophagus | ESCC | macromolecule methylation | 199/8552 | 316/18723 | 3.44e-10 | 9.57e-09 | 199 |
| GO:00322592 | Esophagus | ESCC | methylation | 222/8552 | 364/18723 | 2.26e-09 | 5.09e-08 | 222 |
| GO:00400295 | Esophagus | ESCC | regulation of gene expression, epigenetic | 74/8552 | 105/18723 | 2.24e-07 | 3.42e-06 | 74 |
| GO:00064824 | Esophagus | ESCC | protein demethylation | 24/8552 | 33/18723 | 1.50e-03 | 7.06e-03 | 24 |
| GO:00082144 | Esophagus | ESCC | protein dealkylation | 24/8552 | 33/18723 | 1.50e-03 | 7.06e-03 | 24 |
| GO:00165773 | Esophagus | ESCC | histone demethylation | 22/8552 | 31/18723 | 3.90e-03 | 1.58e-02 | 22 |
| GO:00700763 | Esophagus | ESCC | histone lysine demethylation | 20/8552 | 28/18723 | 5.23e-03 | 1.97e-02 | 20 |
| GO:0006304 | Esophagus | ESCC | DNA modification | 68/8552 | 120/18723 | 9.95e-03 | 3.42e-02 | 68 |
| Page: 1 |
| Pathway ID | Tissue | Disease Stage | Description | Gene Ratio | Bg Ratio | pvalue | p.adjust | qvalue | Count |
| Page: 1 |
Top |
Cell-cell communication analysis |
| Identification of potential cell-cell interactions between two cell types and their ligand-receptor pairs for different disease states |
| Ligand | Receptor | LRpair | Pathway | Tissue | Disease Stage |
| Page: 1 |
Top |
Single-cell gene regulatory network inference analysis |
| Find out the significant the regulons (TFs) and the target genes of each regulon across cell types for different disease states |
| TF | Cell Type | Tissue | Disease Stage | Target Gene | RSS | Regulon Activity |
| ∗The dot plots of a searched regulon are shown for all cell subpopulations in each disease state of each tissue based on the regulon specific score inferred using pySCENIC and by calculating the average expression. |
| Page: 1 |
Top |
Somatic mutation of malignant transformation related genes |
| Annotation of somatic variants for genes involved in malignant transformation |
| Hugo Symbol | Variant Class | Variant Classification | dbSNP RS | HGVSc | HGVSp | HGVSp Short | SWISSPROT | BIOTYPE | SIFT | PolyPhen | Tumor Sample Barcode | Tissue | Histology | Sex | Age | Stage | Therapy Types | Drugs | Outcome |
| KDM1B | SNV | Missense_Mutation | c.1267N>T | p.Gly423Cys | p.G423C | Q8NB78 | protein_coding | deleterious(0) | probably_damaging(1) | TCGA-A2-A25A-01 | Breast | breast invasive carcinoma | Female | <65 | I/II | Unspecific | Cytoxan | SD | |
| KDM1B | SNV | Missense_Mutation | c.142N>G | p.Lys48Glu | p.K48E | Q8NB78 | protein_coding | deleterious(0.01) | probably_damaging(0.911) | TCGA-A8-A09Z-01 | Breast | breast invasive carcinoma | Female | >=65 | I/II | Unknown | Unknown | SD | |
| KDM1B | SNV | Missense_Mutation | novel | c.863G>A | p.Arg288Gln | p.R288Q | Q8NB78 | protein_coding | deleterious_low_confidence(0.01) | probably_damaging(0.992) | TCGA-AN-A046-01 | Breast | breast invasive carcinoma | Female | >=65 | I/II | Unknown | Unknown | SD |
| KDM1B | SNV | Missense_Mutation | c.165N>C | p.Lys55Asn | p.K55N | Q8NB78 | protein_coding | deleterious(0.04) | benign(0.219) | TCGA-BH-A0BP-01 | Breast | breast invasive carcinoma | Female | >=65 | I/II | Unknown | Unknown | SD | |
| KDM1B | insertion | In_Frame_Ins | novel | c.706_707insAAGGCAGAT | p.Ser236delinsLysGlyArgCys | p.S236delinsKGRC | Q8NB78 | protein_coding | TCGA-AR-A0U0-01 | Breast | breast invasive carcinoma | Female | >=65 | I/II | Unknown | Unknown | SD | ||
| KDM1B | insertion | Frame_Shift_Ins | novel | c.1230_1231insGGACTATGTATCTCTTCTTTTTCTCT | p.Leu411GlyfsTer15 | p.L411Gfs*15 | Q8NB78 | protein_coding | TCGA-BH-A0AY-01 | Breast | breast invasive carcinoma | Female | <65 | I/II | Chemotherapy | SD | |||
| KDM1B | deletion | Frame_Shift_Del | novel | c.1768delN | p.Ter591LysfsTer17 | p.*591Kfs*17 | Q8NB78 | protein_coding | TCGA-D8-A27V-01 | Breast | breast invasive carcinoma | Female | <65 | I/II | Hormone Therapy | tamoxiphen | SD | ||
| KDM1B | SNV | Missense_Mutation | rs750152791 | c.709N>A | p.Val237Met | p.V237M | Q8NB78 | protein_coding | deleterious_low_confidence(0.01) | probably_damaging(0.945) | TCGA-EA-A3HS-01 | Cervix | cervical & endocervical cancer | Female | <65 | I/II | Unknown | Unknown | SD |
| KDM1B | SNV | Missense_Mutation | c.1237N>A | p.Glu413Lys | p.E413K | Q8NB78 | protein_coding | tolerated(0.08) | probably_damaging(0.995) | TCGA-EK-A2PL-01 | Cervix | cervical & endocervical cancer | Female | <65 | III/IV | Unknown | Unknown | SD | |
| KDM1B | SNV | Missense_Mutation | c.1480G>A | p.Asp494Asn | p.D494N | Q8NB78 | protein_coding | deleterious(0) | benign(0.393) | TCGA-IR-A3LK-01 | Cervix | cervical & endocervical cancer | Female | >=65 | I/II | Chemotherapy | cisplatin | PD |
| Page: 1 2 3 4 5 6 7 8 |
Top |
Related drugs of malignant transformation related genes |
| Identification of chemicals and drugs interact with genes involved in malignant transfromation |
| (DGIdb 4.0) |
| Entrez ID | Symbol | Category | Interaction Types | Drug Claim Name | Drug Name | PMIDs |
| 221656 | KDM1B | DRUGGABLE GENOME, TRANSCRIPTION FACTOR BINDING, ENZYME | Tarnylcypromine derivative 3 | |||
| 221656 | KDM1B | DRUGGABLE GENOME, TRANSCRIPTION FACTOR BINDING, ENZYME | PMID27019002-Compound-48 | |||
| 221656 | KDM1B | DRUGGABLE GENOME, TRANSCRIPTION FACTOR BINDING, ENZYME | PMID27019002-Compound-47 | |||
| 221656 | KDM1B | DRUGGABLE GENOME, TRANSCRIPTION FACTOR BINDING, ENZYME | PMID27019002-Compound-46 | |||
| 221656 | KDM1B | DRUGGABLE GENOME, TRANSCRIPTION FACTOR BINDING, ENZYME | Tarnylcypromine derivative 2 |
| Page: 1 |

Copyright 2023-Present -The University of Texas Health Science Center at Houston |