| Tissue | Expression Dynamics | Abbreviation |
| Esophagus |  | ESCC: Esophageal squamous cell carcinoma |
| HGIN: High-grade intraepithelial neoplasias |
| LGIN: Low-grade intraepithelial neoplasias |
| Liver | 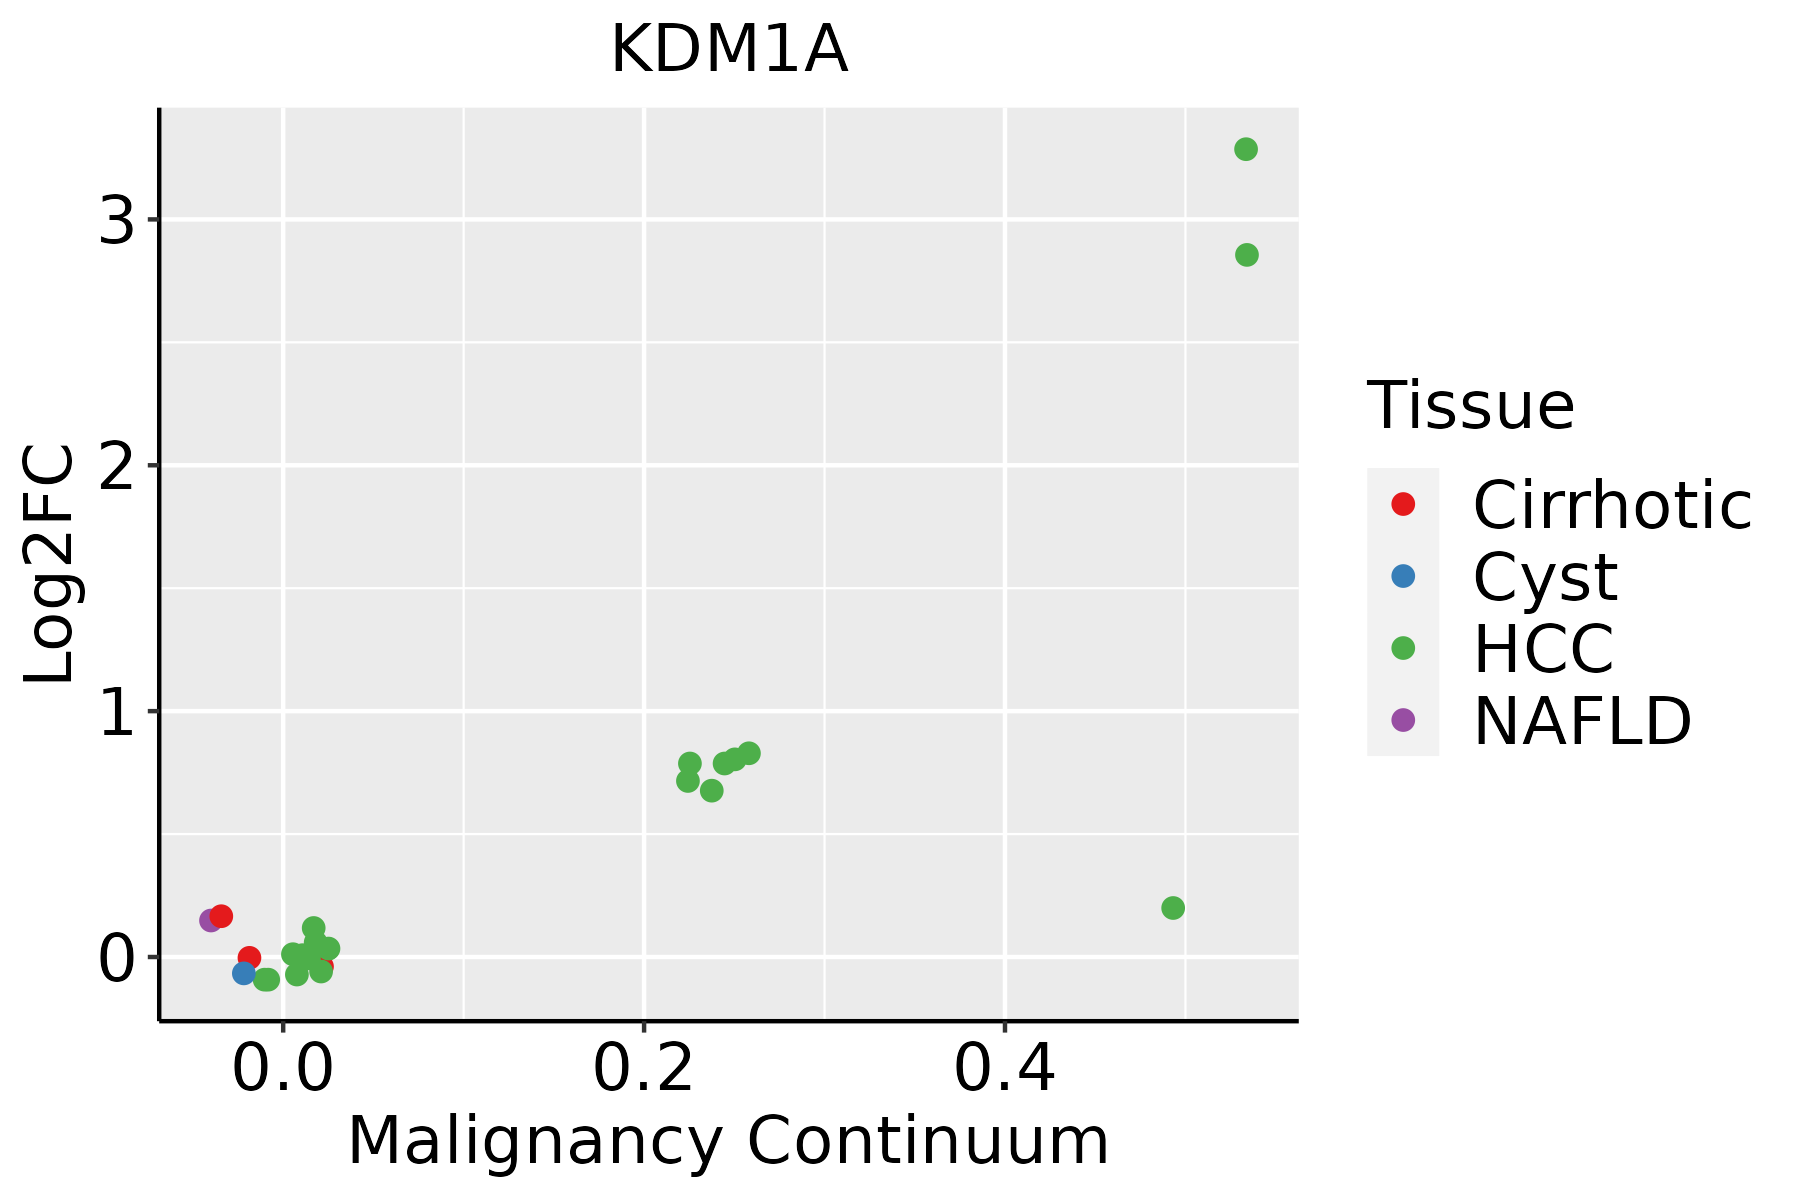 | HCC: Hepatocellular carcinoma |
| NAFLD: Non-alcoholic fatty liver disease |
| Lung | 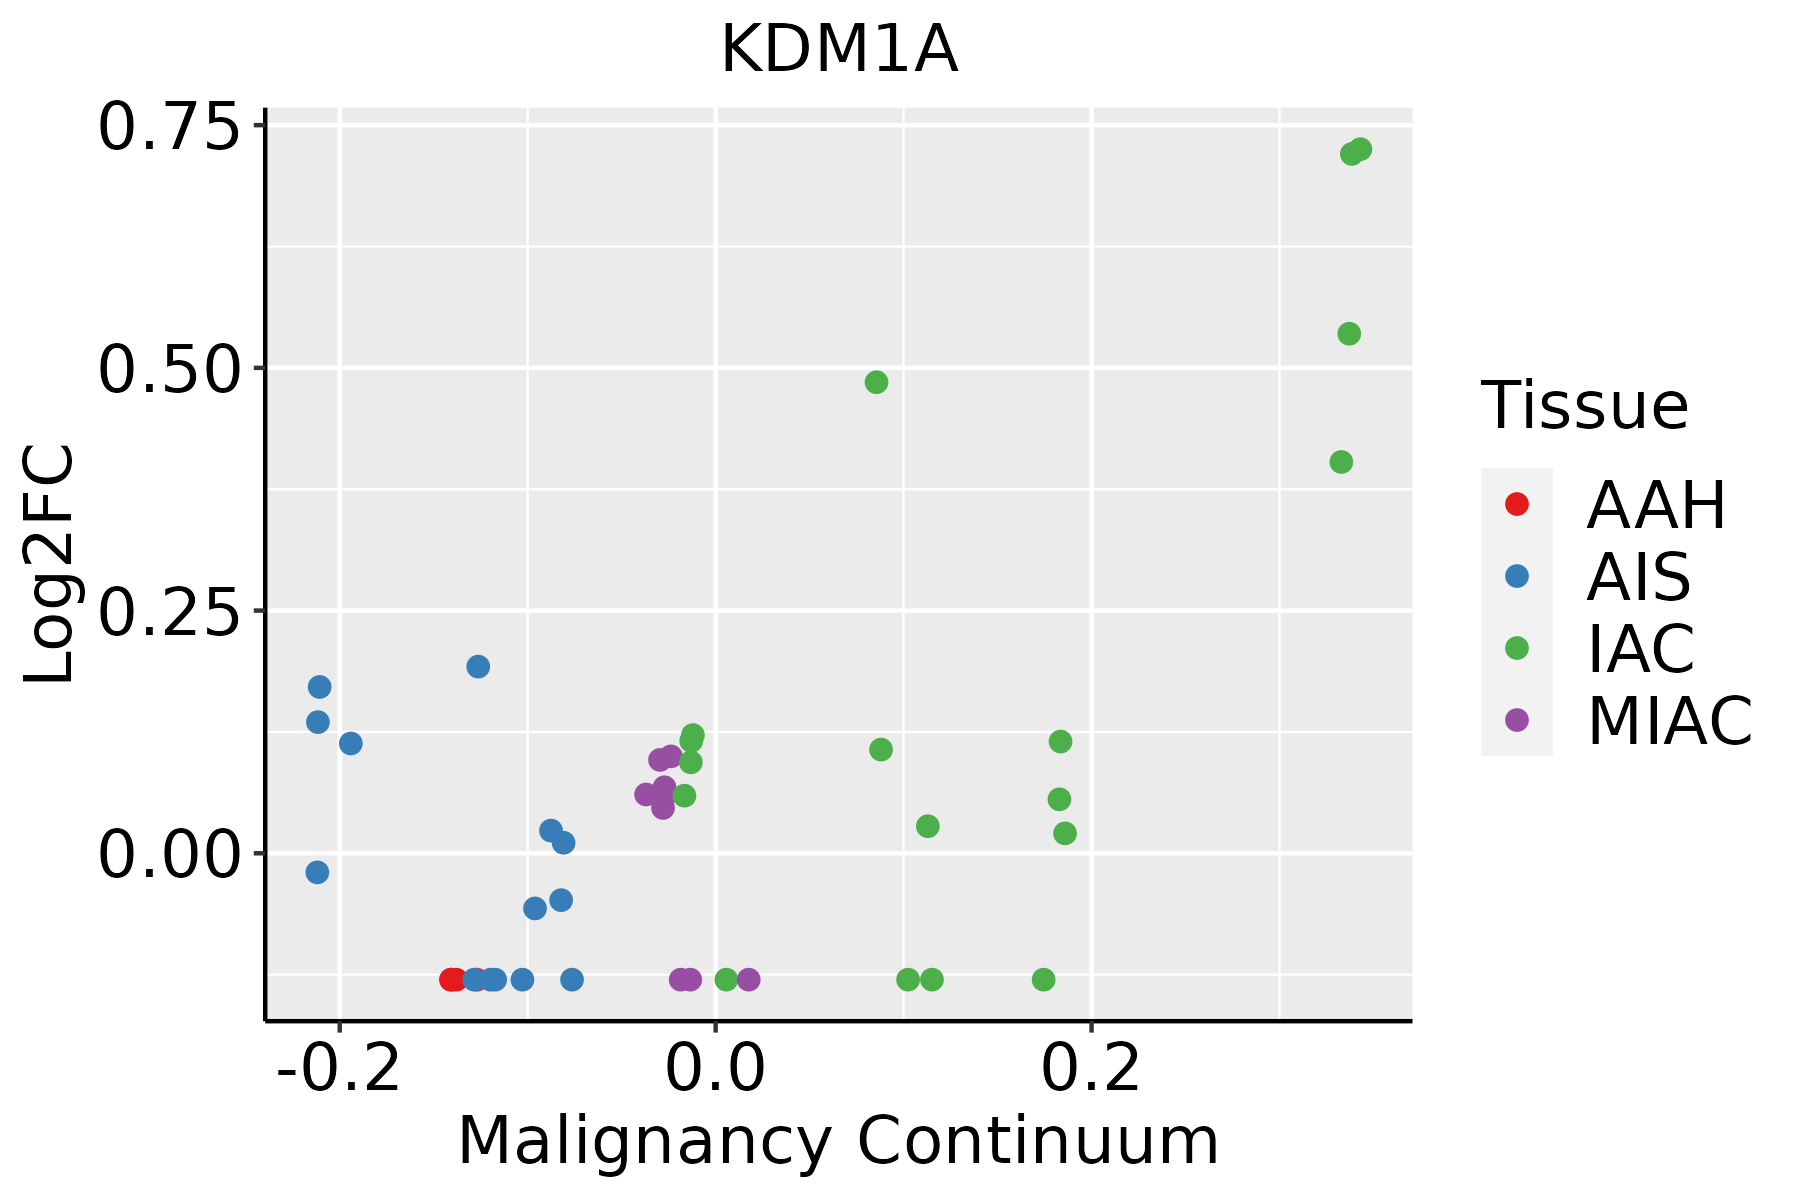 | AAH: Atypical adenomatous hyperplasia |
| AIS: Adenocarcinoma in situ |
| IAC: Invasive lung adenocarcinoma |
| MIA: Minimally invasive adenocarcinoma |
| Oral Cavity |  | EOLP: Erosive Oral lichen planus |
| LP: leukoplakia |
| NEOLP: Non-erosive oral lichen planus |
| OSCC: Oral squamous cell carcinoma |
| Prostate | 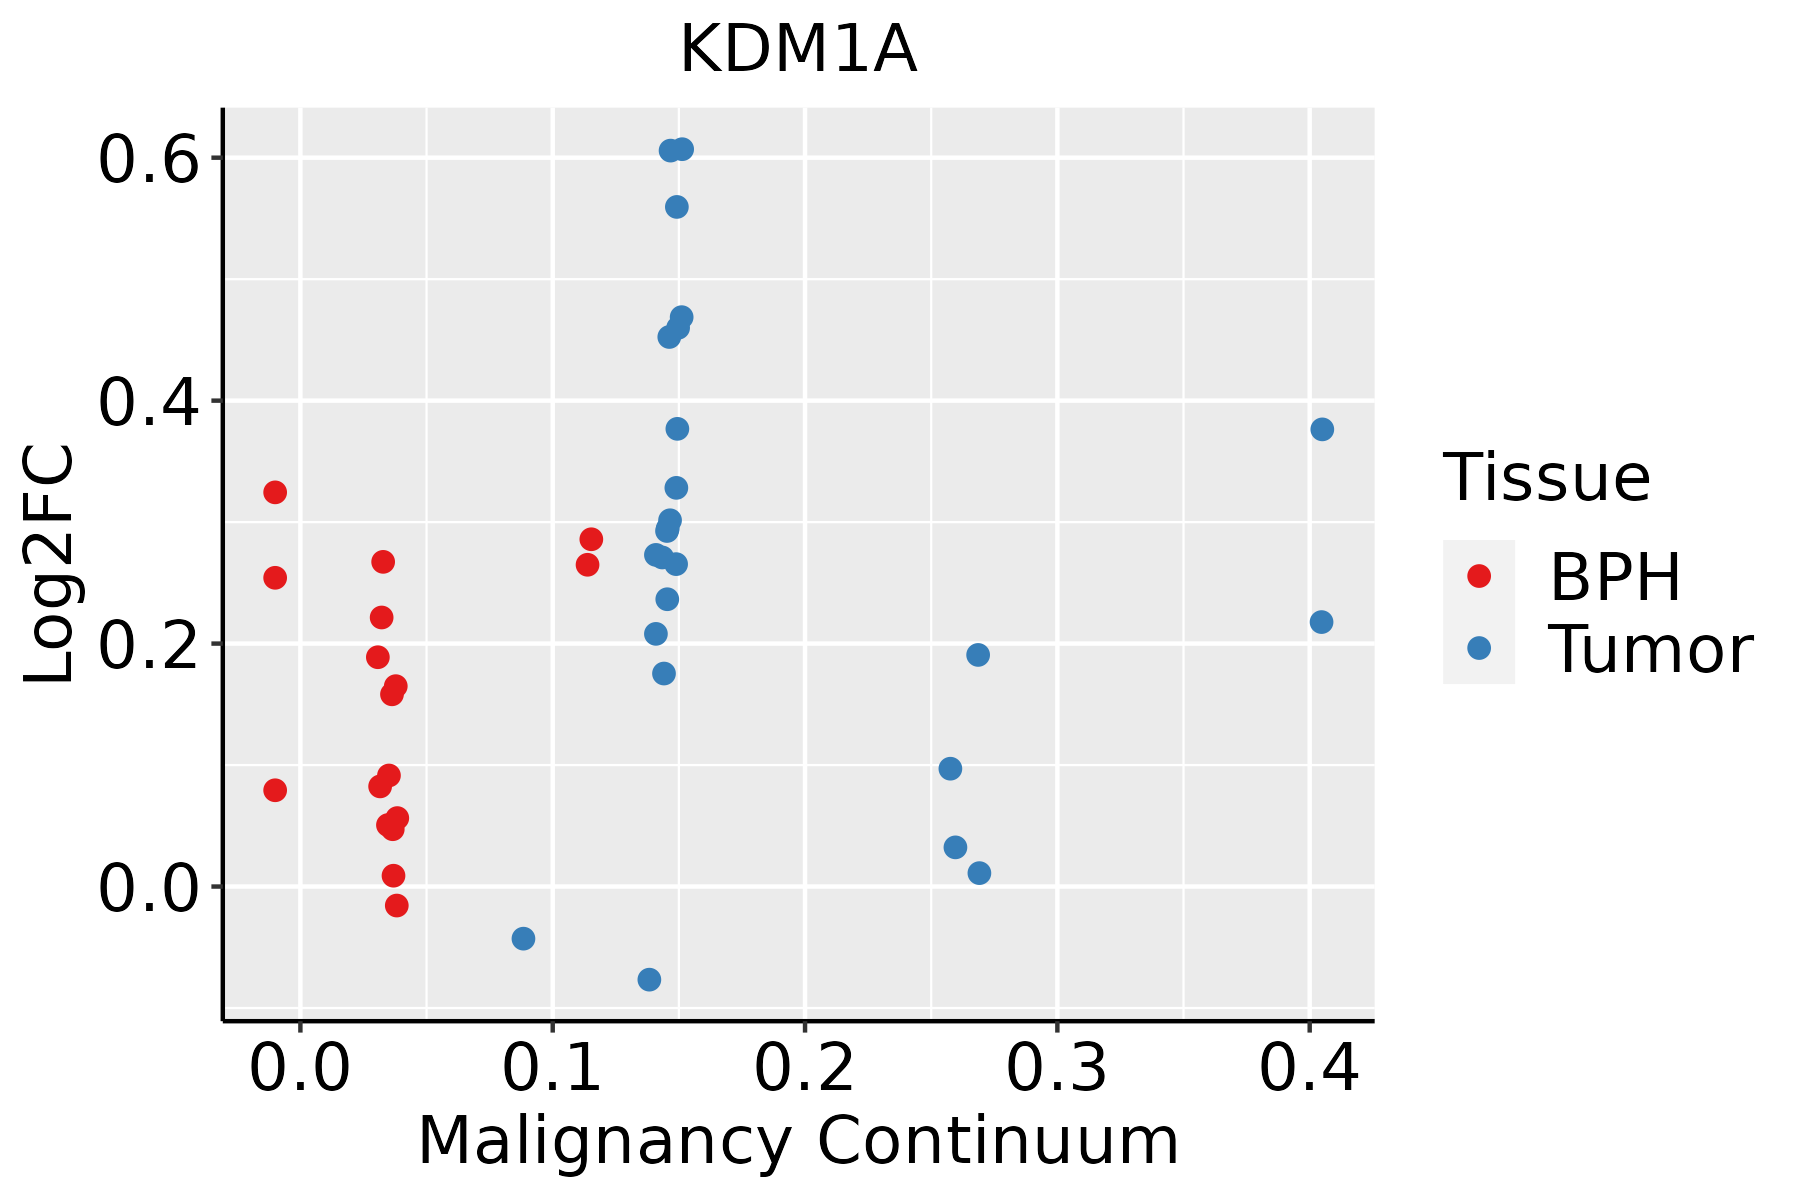 | BPH: Benign Prostatic Hyperplasia |
| Skin | 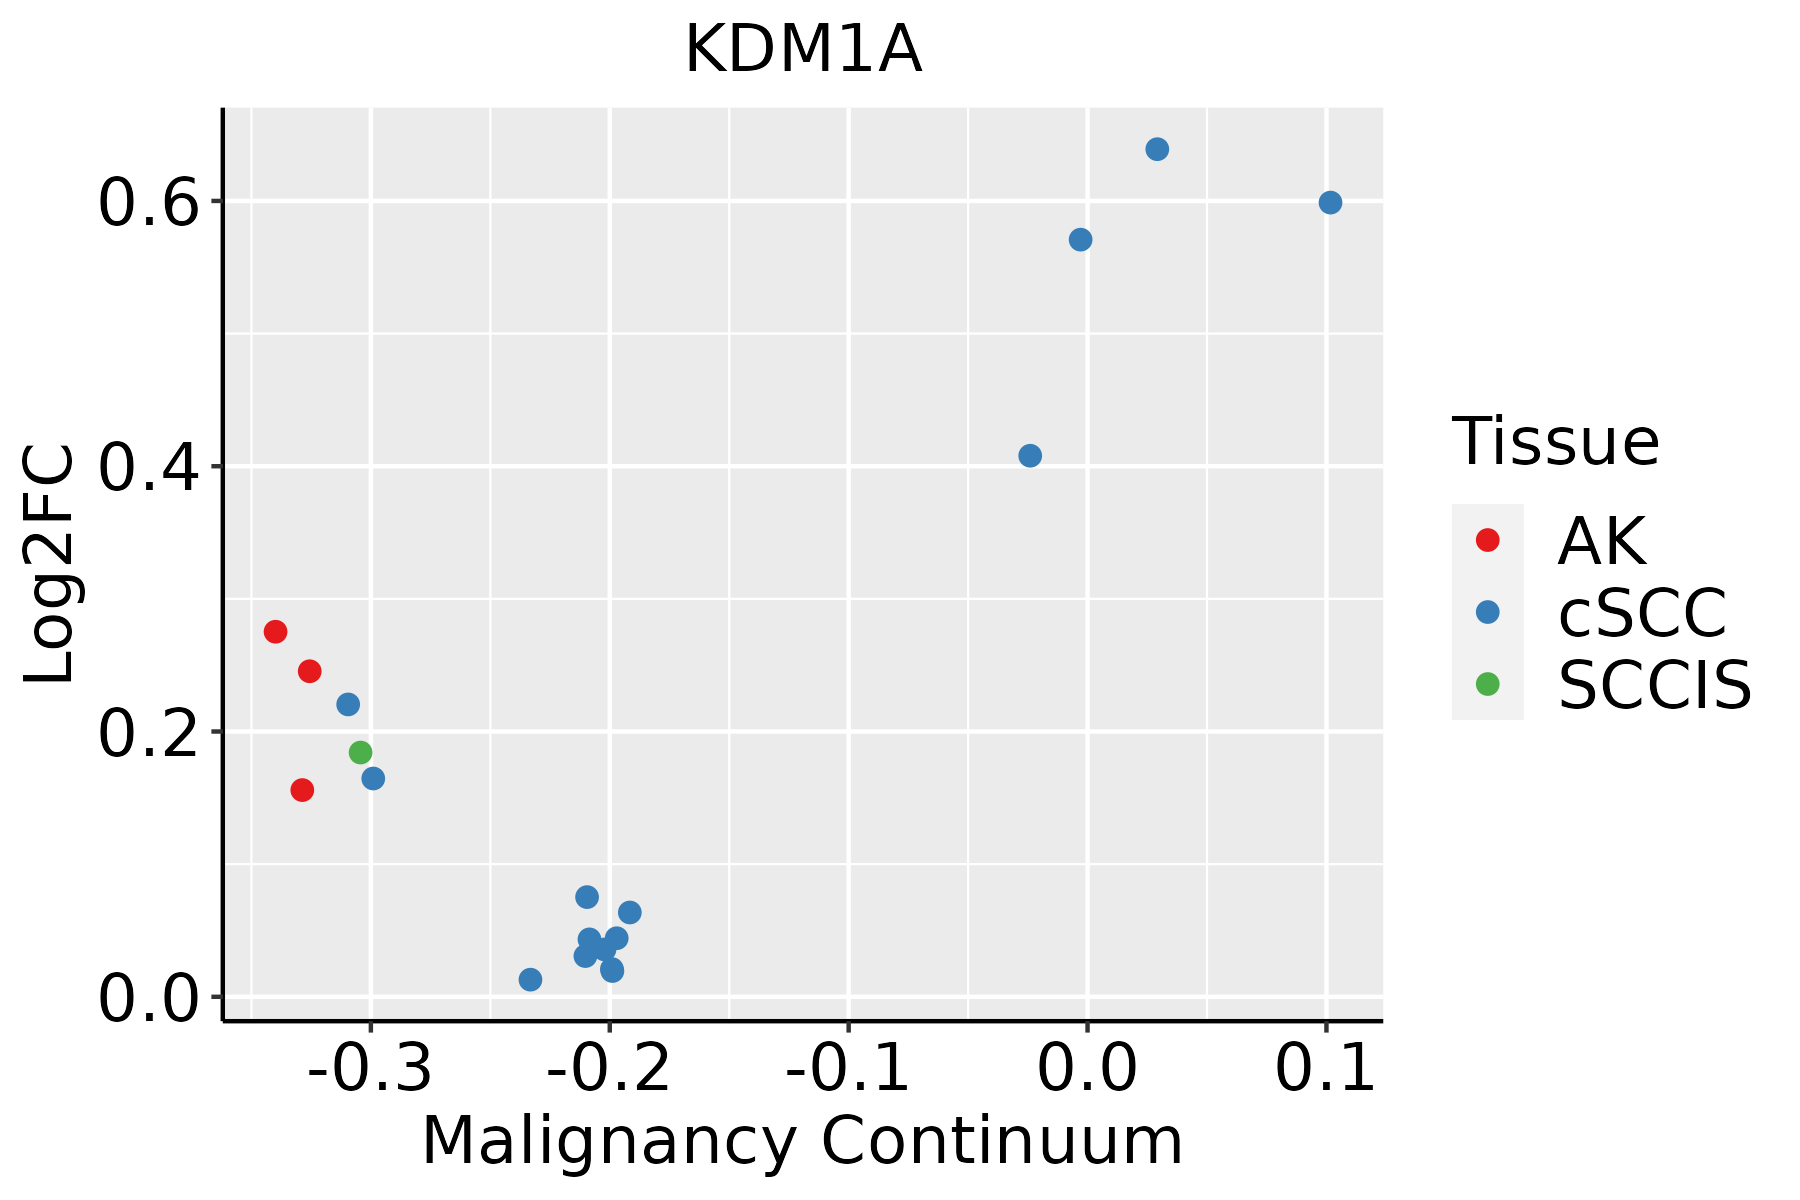 | AK: Actinic keratosis |
| cSCC: Cutaneous squamous cell carcinoma |
| SCCIS:squamous cell carcinoma in situ |
| Thyroid |  | ATC: Anaplastic thyroid cancer |
| HT: Hashimoto's thyroiditis |
| PTC: Papillary thyroid cancer |
| GO ID | Tissue | Disease Stage | Description | Gene Ratio | Bg Ratio | pvalue | p.adjust | Count |
| GO:0008380111 | Esophagus | ESCC | RNA splicing | 336/8552 | 434/18723 | 1.74e-42 | 3.67e-39 | 336 |
| GO:0000375111 | Esophagus | ESCC | RNA splicing, via transesterification reactions | 248/8552 | 324/18723 | 3.05e-30 | 1.49e-27 | 248 |
| GO:0000377111 | Esophagus | ESCC | RNA splicing, via transesterification reactions with bulged adenosine as nucleophile | 244/8552 | 320/18723 | 2.52e-29 | 1.07e-26 | 244 |
| GO:0000398111 | Esophagus | ESCC | mRNA splicing, via spliceosome | 244/8552 | 320/18723 | 2.52e-29 | 1.07e-26 | 244 |
| GO:0097193111 | Esophagus | ESCC | intrinsic apoptotic signaling pathway | 222/8552 | 288/18723 | 5.87e-28 | 2.02e-25 | 222 |
| GO:001657015 | Esophagus | ESCC | histone modification | 323/8552 | 463/18723 | 2.61e-26 | 7.88e-24 | 323 |
| GO:2001233111 | Esophagus | ESCC | regulation of apoptotic signaling pathway | 256/8552 | 356/18723 | 4.11e-24 | 1.04e-21 | 256 |
| GO:1903320111 | Esophagus | ESCC | regulation of protein modification by small protein conjugation or removal | 181/8552 | 242/18723 | 1.80e-20 | 2.60e-18 | 181 |
| GO:001820514 | Esophagus | ESCC | peptidyl-lysine modification | 259/8552 | 376/18723 | 3.90e-20 | 5.26e-18 | 259 |
| GO:0051098111 | Esophagus | ESCC | regulation of binding | 251/8552 | 363/18723 | 6.73e-20 | 8.46e-18 | 251 |
| GO:2001242111 | Esophagus | ESCC | regulation of intrinsic apoptotic signaling pathway | 128/8552 | 164/18723 | 1.75e-17 | 1.50e-15 | 128 |
| GO:0031396111 | Esophagus | ESCC | regulation of protein ubiquitination | 154/8552 | 210/18723 | 2.70e-16 | 2.04e-14 | 154 |
| GO:2001234111 | Esophagus | ESCC | negative regulation of apoptotic signaling pathway | 161/8552 | 224/18723 | 1.24e-15 | 8.09e-14 | 161 |
| GO:000941113 | Esophagus | ESCC | response to UV | 115/8552 | 149/18723 | 3.29e-15 | 1.93e-13 | 115 |
| GO:0072331111 | Esophagus | ESCC | signal transduction by p53 class mediator | 121/8552 | 163/18723 | 9.61e-14 | 4.69e-12 | 121 |
| GO:005105215 | Esophagus | ESCC | regulation of DNA metabolic process | 232/8552 | 359/18723 | 2.40e-13 | 1.13e-11 | 232 |
| GO:001021217 | Esophagus | ESCC | response to ionizing radiation | 110/8552 | 148/18723 | 1.11e-12 | 4.78e-11 | 110 |
| GO:2001243111 | Esophagus | ESCC | negative regulation of intrinsic apoptotic signaling pathway | 78/8552 | 98/18723 | 5.50e-12 | 2.10e-10 | 78 |
| GO:0008630110 | Esophagus | ESCC | intrinsic apoptotic signaling pathway in response to DNA damage | 78/8552 | 99/18723 | 1.43e-11 | 5.08e-10 | 78 |
| GO:0051099111 | Esophagus | ESCC | positive regulation of binding | 122/8552 | 173/18723 | 2.79e-11 | 9.45e-10 | 122 |
| Hugo Symbol | Variant Class | Variant Classification | dbSNP RS | HGVSc | HGVSp | HGVSp Short | SWISSPROT | BIOTYPE | SIFT | PolyPhen | Tumor Sample Barcode | Tissue | Histology | Sex | Age | Stage | Therapy Types | Drugs | Outcome |
| KDM1A | SNV | Missense_Mutation | | c.1189G>C | p.Glu397Gln | p.E397Q | O60341 | protein_coding | tolerated(0.07) | possibly_damaging(0.552) | TCGA-AC-A23H-01 | Breast | breast invasive carcinoma | Female | >=65 | I/II | Unknown | Unknown | PD |
| KDM1A | SNV | Missense_Mutation | | c.812G>A | p.Arg271Gln | p.R271Q | O60341 | protein_coding | deleterious(0.04) | probably_damaging(0.941) | TCGA-AN-A046-01 | Breast | breast invasive carcinoma | Female | >=65 | I/II | Unknown | Unknown | SD |
| KDM1A | SNV | Missense_Mutation | | c.2426N>G | p.Ser809Trp | p.S809W | O60341 | protein_coding | deleterious(0) | possibly_damaging(0.803) | TCGA-GM-A2D9-01 | Breast | breast invasive carcinoma | Female | >=65 | I/II | Hormone Therapy | arimidex | SD |
| KDM1A | SNV | Missense_Mutation | | c.1189N>A | p.Glu397Lys | p.E397K | O60341 | protein_coding | deleterious(0.01) | benign(0.413) | TCGA-W8-A86G-01 | Breast | breast invasive carcinoma | Female | >=65 | I/II | Hormone Therapy | arimidex | SD |
| KDM1A | insertion | Nonsense_Mutation | novel | c.677_678insATAGAGATGGAGAAGAATATTATTCCAAGCATACATTAATGT | p.Thr226_Gln227insTer | p.T226_Q227ins* | O60341 | protein_coding | | | TCGA-A2-A0CQ-01 | Breast | breast invasive carcinoma | Female | <65 | I/II | Chemotherapy | adriamycin | SD |
| KDM1A | insertion | Nonsense_Mutation | novel | c.1919_1920insGATGACAGTTGAGGATTCTGAAGTTGAC | p.Tyr640Ter | p.Y640* | O60341 | protein_coding | | | TCGA-A8-A0A4-01 | Breast | breast invasive carcinoma | Female | >=65 | I/II | Hormone Therapy | tamoxiphen | CR |
| KDM1A | insertion | Frame_Shift_Ins | novel | c.1816_1817insGAGCGTGGTGGCTCATGCCTGTAATACCAGCACTT | p.Leu606ArgfsTer13 | p.L606Rfs*13 | O60341 | protein_coding | | | TCGA-B6-A0IK-01 | Breast | breast invasive carcinoma | Female | <65 | III/IV | Unknown | Unknown | PD |
| KDM1A | SNV | Missense_Mutation | | c.817C>A | p.His273Asn | p.H273N | O60341 | protein_coding | deleterious(0) | probably_damaging(0.996) | TCGA-EA-A1QS-01 | Cervix | cervical & endocervical cancer | Female | <65 | I/II | Unknown | Unknown | SD |
| KDM1A | SNV | Missense_Mutation | novel | c.358T>C | p.Tyr120His | p.Y120H | O60341 | protein_coding | deleterious_low_confidence(0.03) | probably_damaging(0.991) | TCGA-EA-A3HU-01 | Cervix | cervical & endocervical cancer | Female | <65 | I/II | Unknown | Unknown | SD |
| KDM1A | SNV | Missense_Mutation | novel | c.1844G>T | p.Arg615Leu | p.R615L | O60341 | protein_coding | deleterious(0.02) | possibly_damaging(0.69) | TCGA-EK-A2IP-01 | Cervix | cervical & endocervical cancer | Female | <65 | I/II | Unknown | Unknown | SD |
| Entrez ID | Symbol | Category | Interaction Types | Drug Claim Name | Drug Name | PMIDs |
| 23028 | KDM1A | DRUGGABLE GENOME, ENZYME, CELL SURFACE, TRANSCRIPTION FACTOR COMPLEX, TRANSCRIPTION FACTOR BINDING | inhibitor | 178103603 | | |
| 23028 | KDM1A | DRUGGABLE GENOME, ENZYME, CELL SURFACE, TRANSCRIPTION FACTOR COMPLEX, TRANSCRIPTION FACTOR BINDING | inhibitor | 310264760 | | |
| 23028 | KDM1A | DRUGGABLE GENOME, ENZYME, CELL SURFACE, TRANSCRIPTION FACTOR COMPLEX, TRANSCRIPTION FACTOR BINDING | | TRANYLCYPROMINE HYDROCHLORIDE | TRANYLCYPROMINE HYDROCHLORIDE | |
| 23028 | KDM1A | DRUGGABLE GENOME, ENZYME, CELL SURFACE, TRANSCRIPTION FACTOR COMPLEX, TRANSCRIPTION FACTOR BINDING | | 2-[N-(PHTHALIMIDO)]ETHYL CARBAMIMIDOTHIOATE HCL | CHEMBL2182009 | 22876979 |
| 23028 | KDM1A | DRUGGABLE GENOME, ENZYME, CELL SURFACE, TRANSCRIPTION FACTOR COMPLEX, TRANSCRIPTION FACTOR BINDING | inhibitor | 249565921 | | |
| 23028 | KDM1A | DRUGGABLE GENOME, ENZYME, CELL SURFACE, TRANSCRIPTION FACTOR COMPLEX, TRANSCRIPTION FACTOR BINDING | activator | 252166601 | | |
| 23028 | KDM1A | DRUGGABLE GENOME, ENZYME, CELL SURFACE, TRANSCRIPTION FACTOR COMPLEX, TRANSCRIPTION FACTOR BINDING | inhibitor | 178103602 | | |
| 23028 | KDM1A | DRUGGABLE GENOME, ENZYME, CELL SURFACE, TRANSCRIPTION FACTOR COMPLEX, TRANSCRIPTION FACTOR BINDING | inhibitor | 178101964 | TRANYLCYPROMINE | |
| 23028 | KDM1A | DRUGGABLE GENOME, ENZYME, CELL SURFACE, TRANSCRIPTION FACTOR COMPLEX, TRANSCRIPTION FACTOR BINDING | | PARNATE | PARNATE | 21382717 |
| 23028 | KDM1A | DRUGGABLE GENOME, ENZYME, CELL SURFACE, TRANSCRIPTION FACTOR COMPLEX, TRANSCRIPTION FACTOR BINDING | | NAMOLINE | NAMOLINE | 24007511 |


