
|
|||||
|
 | |
| |
| |
| |
| |
| |
|
Gene: KDF1 |
Gene summary for KDF1 |
| Gene information | Species | Human | Gene symbol | KDF1 | Gene ID | 126695 |
| Gene name | keratinocyte differentiation factor 1 | |
| Gene Alias | C1orf172 | |
| Cytomap | 1p36.11 | |
| Gene Type | protein-coding | GO ID | GO:0002009 | UniProtAcc | Q8NAX2 |
Top |
Malignant transformation analysis |
| Identification of the aberrant gene expression in precancerous and cancerous lesions by comparing the gene expression of stem-like cells in diseased tissues with normal stem cells |
| Entrez ID | Symbol | Replicates | Species | Organ | Tissue | Adj P-value | Log2FC | Malignancy |
| 126695 | KDF1 | HTA11_347_2000001011 | Human | Colorectum | AD | 3.05e-08 | 2.43e-01 | -0.1954 |
| 126695 | KDF1 | HTA11_696_2000001011 | Human | Colorectum | AD | 2.14e-08 | 2.58e-01 | -0.1464 |
| 126695 | KDF1 | HTA11_866_2000001011 | Human | Colorectum | AD | 3.21e-02 | 1.41e-01 | -0.1001 |
| 126695 | KDF1 | HTA11_1391_2000001011 | Human | Colorectum | AD | 1.62e-06 | 3.22e-01 | -0.059 |
| 126695 | KDF1 | HTA11_866_3004761011 | Human | Colorectum | AD | 5.12e-09 | 3.42e-01 | 0.096 |
| 126695 | KDF1 | HTA11_7696_3000711011 | Human | Colorectum | AD | 5.53e-05 | 1.90e-01 | 0.0674 |
| 126695 | KDF1 | HTA11_99999970781_79442 | Human | Colorectum | MSS | 1.02e-06 | 2.58e-01 | 0.294 |
| 126695 | KDF1 | HTA11_99999971662_82457 | Human | Colorectum | MSS | 8.73e-09 | 2.85e-01 | 0.3859 |
| 126695 | KDF1 | LZE4T | Human | Esophagus | ESCC | 8.98e-11 | 1.21e-01 | 0.0811 |
| 126695 | KDF1 | LZE7T | Human | Esophagus | ESCC | 3.03e-05 | 2.73e-01 | 0.0667 |
| 126695 | KDF1 | LZE8T | Human | Esophagus | ESCC | 2.46e-03 | 7.18e-02 | 0.067 |
| 126695 | KDF1 | LZE20T | Human | Esophagus | ESCC | 1.34e-06 | 2.20e-01 | 0.0662 |
| 126695 | KDF1 | LZE22T | Human | Esophagus | ESCC | 2.88e-05 | 2.75e-01 | 0.068 |
| 126695 | KDF1 | LZE24T | Human | Esophagus | ESCC | 8.39e-30 | 5.37e-01 | 0.0596 |
| 126695 | KDF1 | P1T-E | Human | Esophagus | ESCC | 2.29e-05 | 2.16e-01 | 0.0875 |
| 126695 | KDF1 | P2T-E | Human | Esophagus | ESCC | 2.18e-22 | 3.67e-01 | 0.1177 |
| 126695 | KDF1 | P4T-E | Human | Esophagus | ESCC | 2.26e-17 | 2.24e-01 | 0.1323 |
| 126695 | KDF1 | P5T-E | Human | Esophagus | ESCC | 2.46e-07 | 1.79e-01 | 0.1327 |
| 126695 | KDF1 | P8T-E | Human | Esophagus | ESCC | 5.68e-17 | 2.70e-01 | 0.0889 |
| 126695 | KDF1 | P9T-E | Human | Esophagus | ESCC | 2.30e-13 | 2.11e-01 | 0.1131 |
| Page: 1 2 3 4 5 |
| Tissue | Expression Dynamics | Abbreviation |
| Colorectum (GSE201348) |  | FAP: Familial adenomatous polyposis |
| CRC: Colorectal cancer | ||
| Colorectum (HTA11) |  | AD: Adenomas |
| SER: Sessile serrated lesions | ||
| MSI-H: Microsatellite-high colorectal cancer | ||
| MSS: Microsatellite stable colorectal cancer | ||
| Esophagus | 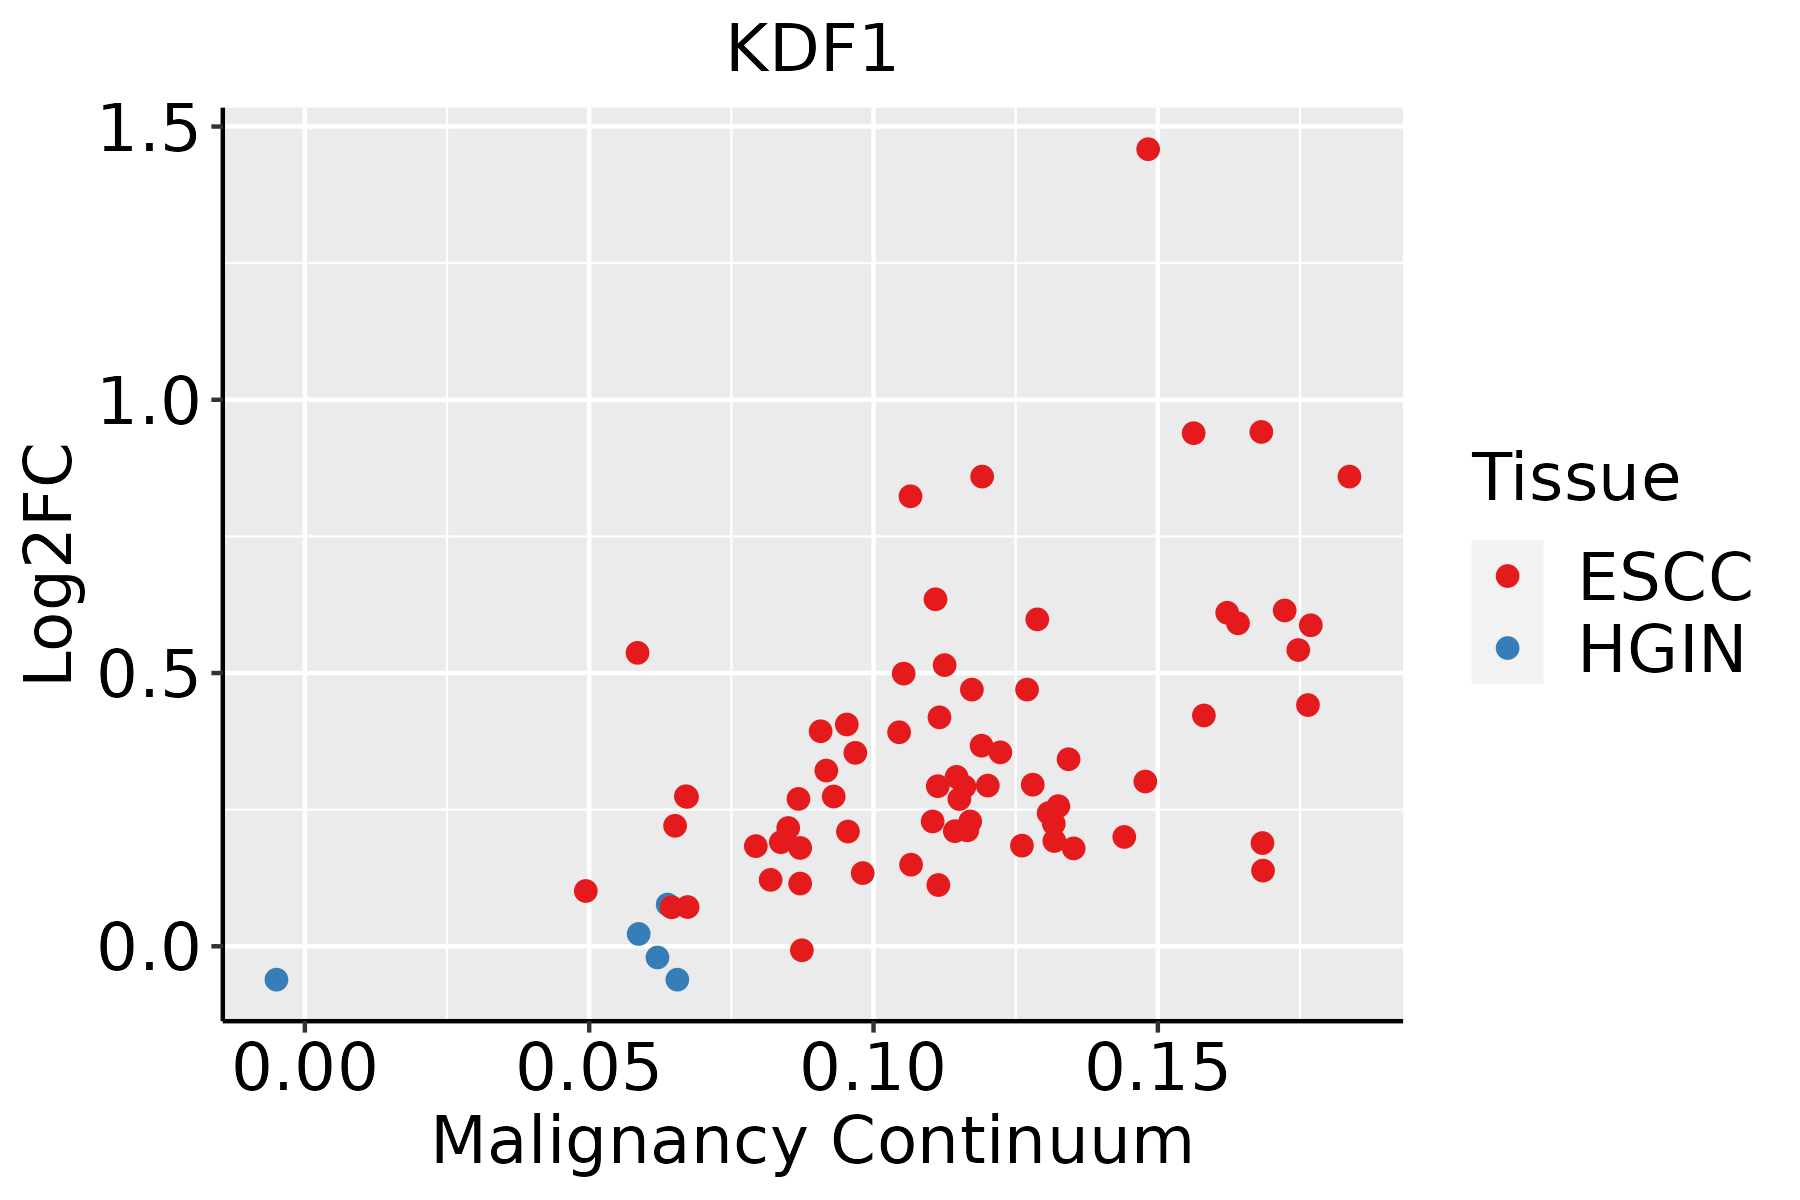 | ESCC: Esophageal squamous cell carcinoma |
| HGIN: High-grade intraepithelial neoplasias | ||
| LGIN: Low-grade intraepithelial neoplasias | ||
| Oral Cavity | 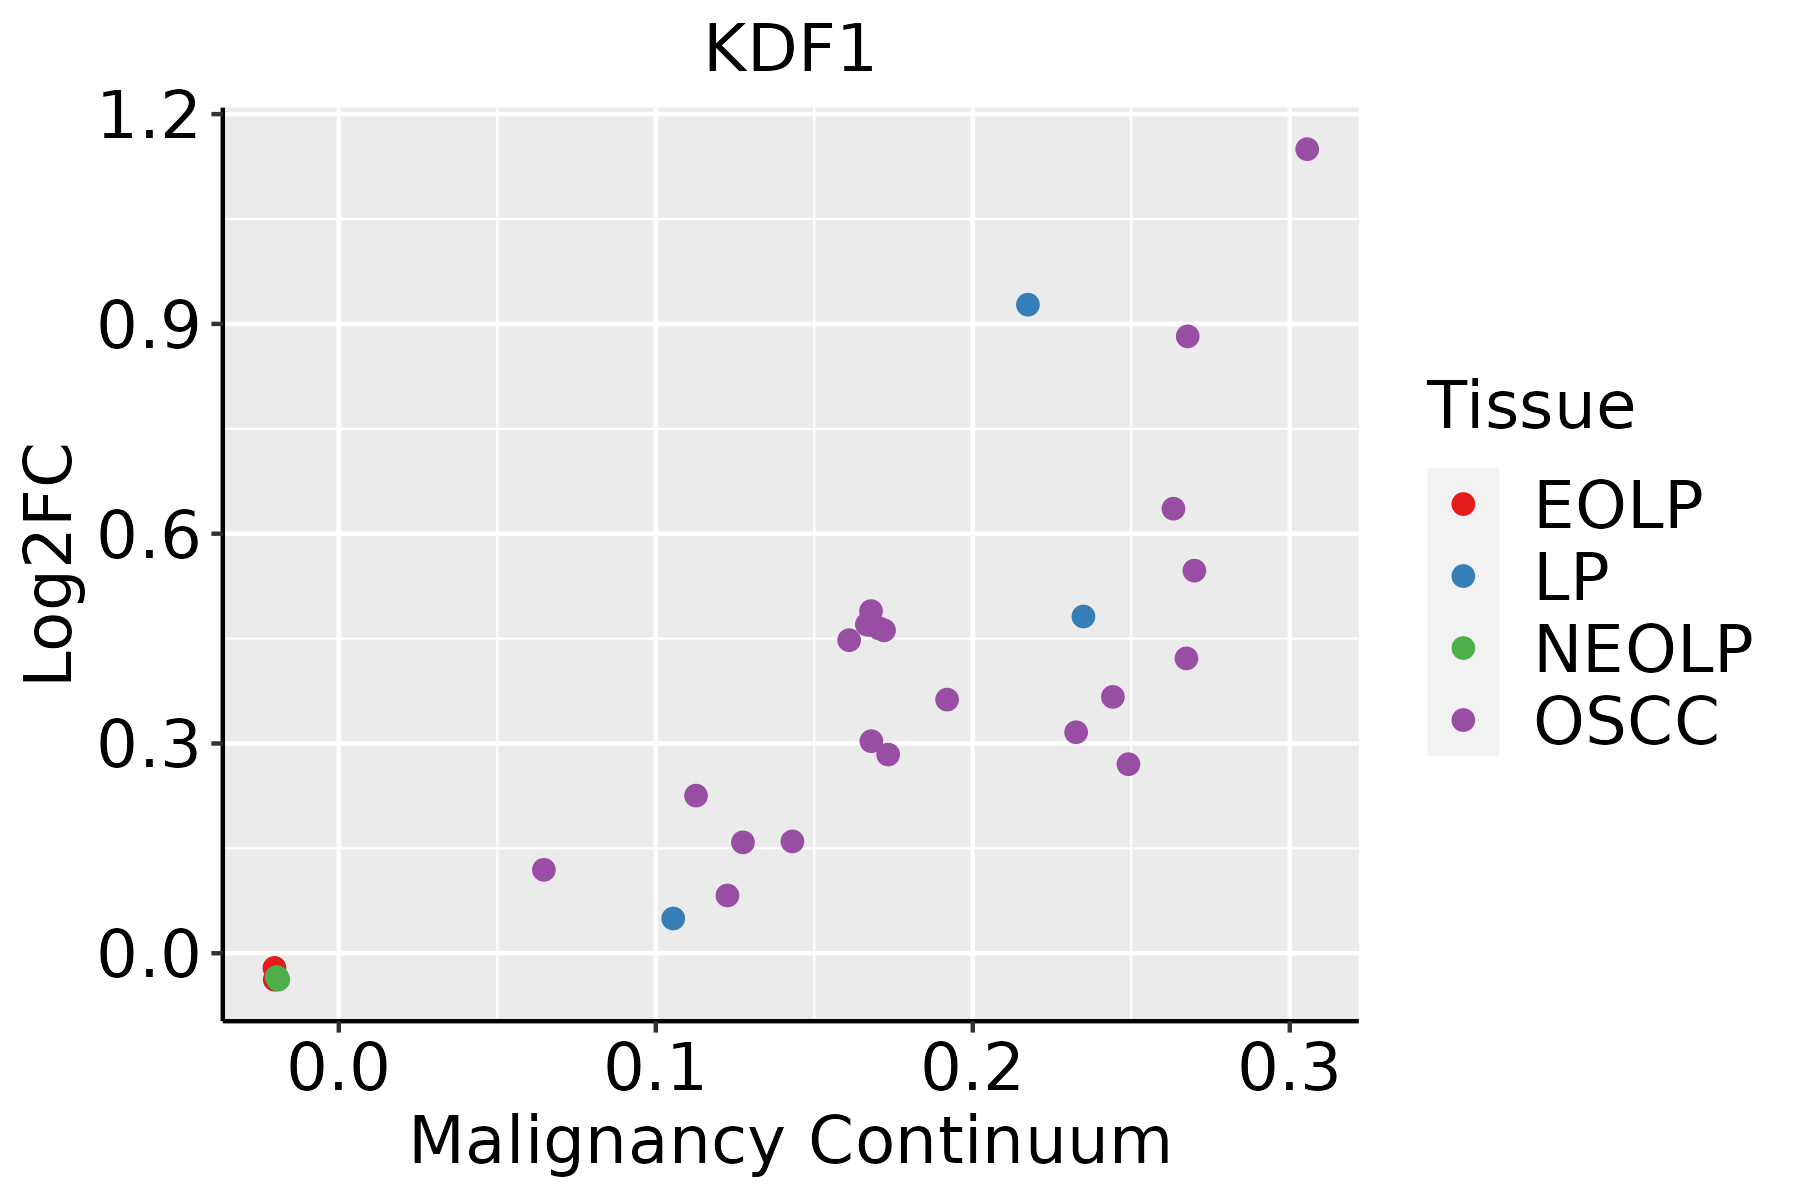 | EOLP: Erosive Oral lichen planus |
| LP: leukoplakia | ||
| NEOLP: Non-erosive oral lichen planus | ||
| OSCC: Oral squamous cell carcinoma |
| ∗log2FC in expression of this searched gene in stem-like cells from each diseased tissue sample relative to stem-like cells in normal samples in each tissue plotted against the malignancy continuum. Samples are colored based on if they are from different disease stage. |
Top |
Malignant transformation related pathway analysis |
| Find out the enriched GO biological processes and KEGG pathways involved in transition from healthy to precancer to cancer |
| Tissue | Disease Stage | Enriched GO biological Processes |
| Colorectum | AD |  |
| Colorectum | SER |  |
| Colorectum | MSS |  |
| Colorectum | MSI-H |  |
| Colorectum | FAP |  |
| ∗Top 15 enriched GO BP terms are showed in the bar plot of each disease state in each tissue. Each row represents a significant GO biological process which is colored according to the -log10(p.adjust). |
| Page: 1 2 3 4 5 6 7 8 9 |
| GO ID | Tissue | Disease Stage | Description | Gene Ratio | Bg Ratio | pvalue | p.adjust | Count |
| GO:0002064 | Colorectum | AD | epithelial cell development | 89/3918 | 220/18723 | 2.98e-11 | 3.52e-09 | 89 |
| GO:0050878 | Colorectum | AD | regulation of body fluid levels | 108/3918 | 379/18723 | 2.54e-04 | 3.20e-03 | 108 |
| GO:0050673 | Colorectum | AD | epithelial cell proliferation | 119/3918 | 437/18723 | 8.75e-04 | 8.51e-03 | 119 |
| GO:0043616 | Colorectum | AD | keratinocyte proliferation | 19/3918 | 46/18723 | 1.36e-03 | 1.19e-02 | 19 |
| GO:0010837 | Colorectum | AD | regulation of keratinocyte proliferation | 15/3918 | 35/18723 | 2.78e-03 | 2.09e-02 | 15 |
| GO:0048736 | Colorectum | AD | appendage development | 51/3918 | 172/18723 | 4.20e-03 | 2.89e-02 | 51 |
| GO:0060173 | Colorectum | AD | limb development | 51/3918 | 172/18723 | 4.20e-03 | 2.89e-02 | 51 |
| GO:0009913 | Colorectum | AD | epidermal cell differentiation | 58/3918 | 202/18723 | 5.16e-03 | 3.42e-02 | 58 |
| GO:0008544 | Colorectum | AD | epidermis development | 87/3918 | 324/18723 | 5.99e-03 | 3.76e-02 | 87 |
| GO:00020642 | Colorectum | MSS | epithelial cell development | 81/3467 | 220/18723 | 1.02e-10 | 1.06e-08 | 81 |
| GO:00436161 | Colorectum | MSS | keratinocyte proliferation | 20/3467 | 46/18723 | 8.26e-05 | 1.35e-03 | 20 |
| GO:00508782 | Colorectum | MSS | regulation of body fluid levels | 99/3467 | 379/18723 | 1.40e-04 | 2.07e-03 | 99 |
| GO:00108371 | Colorectum | MSS | regulation of keratinocyte proliferation | 16/3467 | 35/18723 | 2.07e-04 | 2.89e-03 | 16 |
| GO:00506731 | Colorectum | MSS | epithelial cell proliferation | 108/3467 | 437/18723 | 6.76e-04 | 7.30e-03 | 108 |
| GO:00487362 | Colorectum | MSS | appendage development | 48/3467 | 172/18723 | 1.61e-03 | 1.46e-02 | 48 |
| GO:00601732 | Colorectum | MSS | limb development | 48/3467 | 172/18723 | 1.61e-03 | 1.46e-02 | 48 |
| GO:00099131 | Colorectum | MSS | epidermal cell differentiation | 52/3467 | 202/18723 | 6.59e-03 | 4.38e-02 | 52 |
| GO:0050678 | Colorectum | MSS | regulation of epithelial cell proliferation | 90/3467 | 381/18723 | 6.92e-03 | 4.45e-02 | 90 |
| GO:00435888 | Esophagus | ESCC | skin development | 163/8552 | 263/18723 | 6.48e-08 | 1.14e-06 | 163 |
| GO:00163316 | Esophagus | ESCC | morphogenesis of embryonic epithelium | 98/8552 | 147/18723 | 2.12e-07 | 3.27e-06 | 98 |
| Page: 1 2 3 |
| Pathway ID | Tissue | Disease Stage | Description | Gene Ratio | Bg Ratio | pvalue | p.adjust | qvalue | Count |
| Page: 1 |
Top |
Cell-cell communication analysis |
| Identification of potential cell-cell interactions between two cell types and their ligand-receptor pairs for different disease states |
| Ligand | Receptor | LRpair | Pathway | Tissue | Disease Stage |
| Page: 1 |
Top |
Single-cell gene regulatory network inference analysis |
| Find out the significant the regulons (TFs) and the target genes of each regulon across cell types for different disease states |
| TF | Cell Type | Tissue | Disease Stage | Target Gene | RSS | Regulon Activity |
| ∗The dot plots of a searched regulon are shown for all cell subpopulations in each disease state of each tissue based on the regulon specific score inferred using pySCENIC and by calculating the average expression. |
| Page: 1 |
Top |
Somatic mutation of malignant transformation related genes |
| Annotation of somatic variants for genes involved in malignant transformation |
| Hugo Symbol | Variant Class | Variant Classification | dbSNP RS | HGVSc | HGVSp | HGVSp Short | SWISSPROT | BIOTYPE | SIFT | PolyPhen | Tumor Sample Barcode | Tissue | Histology | Sex | Age | Stage | Therapy Types | Drugs | Outcome |
| KDF1 | SNV | Missense_Mutation | novel | c.370N>A | p.Glu124Lys | p.E124K | Q8NAX2 | protein_coding | tolerated(0.56) | benign(0.01) | TCGA-A2-A0EY-01 | Breast | breast invasive carcinoma | Female | <65 | I/II | Chemotherapy | adriamycin | SD |
| KDF1 | SNV | Missense_Mutation | rs762329870 | c.898G>A | p.Gly300Ser | p.G300S | Q8NAX2 | protein_coding | deleterious(0) | probably_damaging(0.997) | TCGA-A6-2686-01 | Colorectum | colon adenocarcinoma | Female | >=65 | I/II | Unknown | Unknown | SD |
| KDF1 | SNV | Missense_Mutation | c.4N>T | p.Pro2Ser | p.P2S | Q8NAX2 | protein_coding | deleterious_low_confidence(0) | possibly_damaging(0.886) | TCGA-AZ-6598-01 | Colorectum | colon adenocarcinoma | Female | >=65 | I/II | Unknown | Unknown | SD | |
| KDF1 | SNV | Missense_Mutation | c.1079C>T | p.Ala360Val | p.A360V | Q8NAX2 | protein_coding | tolerated(1) | benign(0.086) | TCGA-AZ-6601-01 | Colorectum | colon adenocarcinoma | Male | >=65 | I/II | Unknown | Unknown | PD | |
| KDF1 | SNV | Missense_Mutation | c.64N>T | p.Pro22Ser | p.P22S | Q8NAX2 | protein_coding | tolerated_low_confidence(0.09) | benign(0.23) | TCGA-G4-6588-01 | Colorectum | colon adenocarcinoma | Female | <65 | I/II | Unknown | Unknown | SD | |
| KDF1 | SNV | Missense_Mutation | c.680C>T | p.Pro227Leu | p.P227L | Q8NAX2 | protein_coding | tolerated(0.18) | possibly_damaging(0.823) | TCGA-WS-AB45-01 | Colorectum | colon adenocarcinoma | Female | <65 | I/II | Unknown | Unknown | SD | |
| KDF1 | insertion | Frame_Shift_Ins | rs752617278 | c.408dupC | p.Ser137GlnfsTer3 | p.S137Qfs*3 | Q8NAX2 | protein_coding | TCGA-A6-2686-01 | Colorectum | colon adenocarcinoma | Female | >=65 | I/II | Unknown | Unknown | SD | ||
| KDF1 | SNV | Missense_Mutation | rs771599585 | c.640N>A | p.Glu214Lys | p.E214K | Q8NAX2 | protein_coding | tolerated(0.09) | possibly_damaging(0.885) | TCGA-A5-A0G2-01 | Endometrium | uterine corpus endometrioid carcinoma | Female | <65 | III/IV | Unknown | Unknown | SD |
| KDF1 | SNV | Missense_Mutation | rs770558931 | c.121C>T | p.Arg41Cys | p.R41C | Q8NAX2 | protein_coding | deleterious(0.02) | possibly_damaging(0.528) | TCGA-A5-A0GH-01 | Endometrium | uterine corpus endometrioid carcinoma | Female | <65 | I/II | Unknown | Unknown | SD |
| KDF1 | SNV | Missense_Mutation | rs371743170 | c.704N>T | p.Ser235Leu | p.S235L | Q8NAX2 | protein_coding | deleterious(0) | benign(0.361) | TCGA-A5-A0VP-01 | Endometrium | uterine corpus endometrioid carcinoma | Female | >=65 | I/II | Unknown | Unknown | SD |
| Page: 1 2 3 4 |
Top |
Related drugs of malignant transformation related genes |
| Identification of chemicals and drugs interact with genes involved in malignant transfromation |
| (DGIdb 4.0) |
| Entrez ID | Symbol | Category | Interaction Types | Drug Claim Name | Drug Name | PMIDs |
| Page: 1 |

Copyright 2023-Present -The University of Texas Health Science Center at Houston |