
|
|||||
|
 | |
| |
| |
| |
| |
| |
|
Gene: KDELR3 |
Gene summary for KDELR3 |
| Gene information | Species | Human | Gene symbol | KDELR3 | Gene ID | 11015 |
| Gene name | KDEL endoplasmic reticulum protein retention receptor 3 | |
| Gene Alias | ERD2L3 | |
| Cytomap | 22q13.1 | |
| Gene Type | protein-coding | GO ID | GO:0006621 | UniProtAcc | A0A024R1R0 |
Top |
Malignant transformation analysis |
| Identification of the aberrant gene expression in precancerous and cancerous lesions by comparing the gene expression of stem-like cells in diseased tissues with normal stem cells |
| Entrez ID | Symbol | Replicates | Species | Organ | Tissue | Adj P-value | Log2FC | Malignancy |
| 11015 | KDELR3 | LZE4T | Human | Esophagus | ESCC | 9.20e-04 | 2.10e-01 | 0.0811 |
| 11015 | KDELR3 | LZE6T | Human | Esophagus | ESCC | 8.24e-07 | 3.65e-01 | 0.0845 |
| 11015 | KDELR3 | P2T-E | Human | Esophagus | ESCC | 4.65e-12 | 9.26e-02 | 0.1177 |
| 11015 | KDELR3 | P4T-E | Human | Esophagus | ESCC | 1.28e-19 | 5.73e-01 | 0.1323 |
| 11015 | KDELR3 | P5T-E | Human | Esophagus | ESCC | 9.94e-08 | 3.14e-01 | 0.1327 |
| 11015 | KDELR3 | P8T-E | Human | Esophagus | ESCC | 7.13e-07 | 1.63e-01 | 0.0889 |
| 11015 | KDELR3 | P9T-E | Human | Esophagus | ESCC | 1.47e-09 | 4.26e-01 | 0.1131 |
| 11015 | KDELR3 | P10T-E | Human | Esophagus | ESCC | 1.99e-27 | 5.87e-01 | 0.116 |
| 11015 | KDELR3 | P11T-E | Human | Esophagus | ESCC | 2.96e-11 | 5.30e-01 | 0.1426 |
| 11015 | KDELR3 | P12T-E | Human | Esophagus | ESCC | 2.51e-15 | 3.13e-01 | 0.1122 |
| 11015 | KDELR3 | P15T-E | Human | Esophagus | ESCC | 1.06e-06 | 2.99e-01 | 0.1149 |
| 11015 | KDELR3 | P16T-E | Human | Esophagus | ESCC | 3.30e-19 | 4.77e-01 | 0.1153 |
| 11015 | KDELR3 | P17T-E | Human | Esophagus | ESCC | 1.96e-04 | 3.70e-01 | 0.1278 |
| 11015 | KDELR3 | P19T-E | Human | Esophagus | ESCC | 1.34e-05 | 8.88e-01 | 0.1662 |
| 11015 | KDELR3 | P20T-E | Human | Esophagus | ESCC | 4.35e-05 | 1.71e-01 | 0.1124 |
| 11015 | KDELR3 | P21T-E | Human | Esophagus | ESCC | 1.45e-59 | 1.24e+00 | 0.1617 |
| 11015 | KDELR3 | P22T-E | Human | Esophagus | ESCC | 2.12e-19 | 4.70e-01 | 0.1236 |
| 11015 | KDELR3 | P23T-E | Human | Esophagus | ESCC | 1.11e-18 | 5.34e-01 | 0.108 |
| 11015 | KDELR3 | P24T-E | Human | Esophagus | ESCC | 4.60e-10 | 4.07e-01 | 0.1287 |
| 11015 | KDELR3 | P26T-E | Human | Esophagus | ESCC | 9.79e-13 | 3.45e-01 | 0.1276 |
| Page: 1 2 3 4 5 |
| Tissue | Expression Dynamics | Abbreviation |
| Esophagus |  | ESCC: Esophageal squamous cell carcinoma |
| HGIN: High-grade intraepithelial neoplasias | ||
| LGIN: Low-grade intraepithelial neoplasias | ||
| Liver | 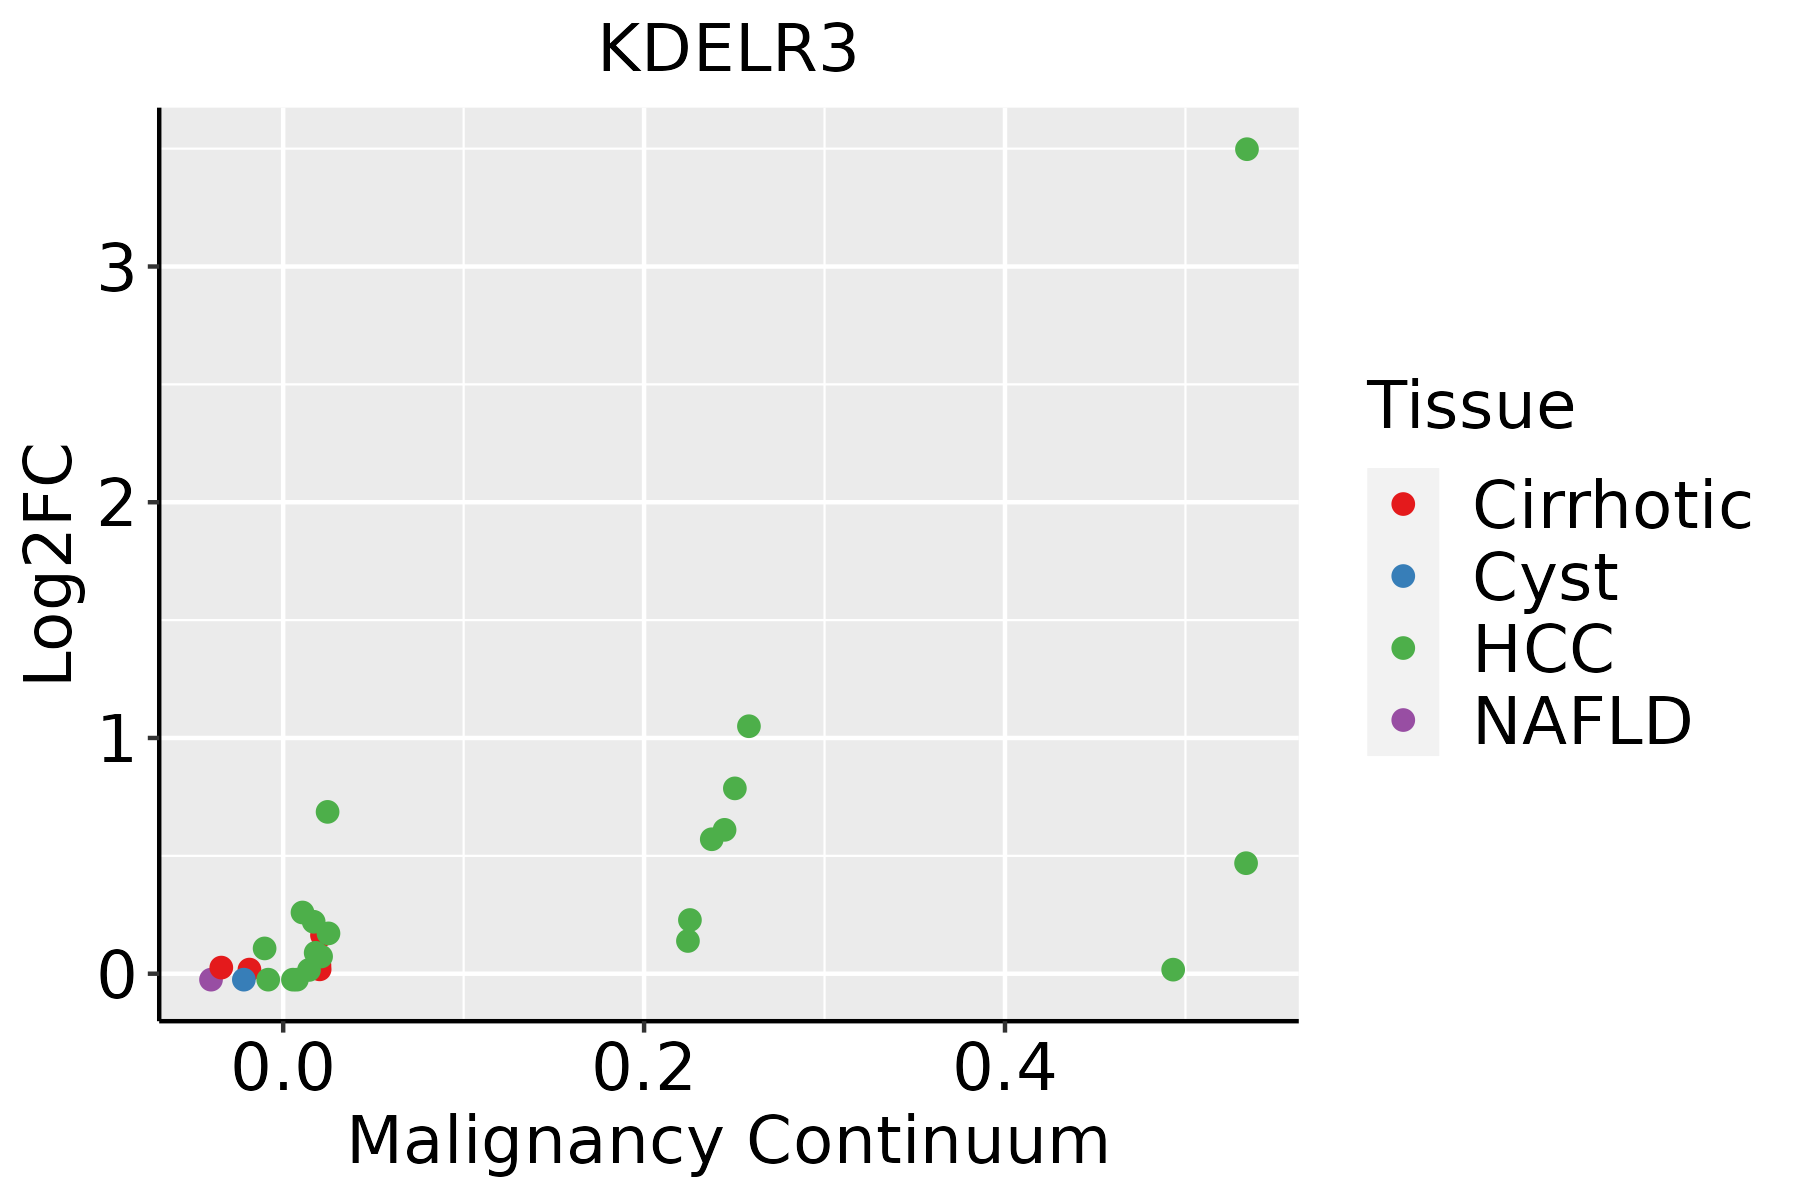 | HCC: Hepatocellular carcinoma |
| NAFLD: Non-alcoholic fatty liver disease | ||
| Oral Cavity |  | EOLP: Erosive Oral lichen planus |
| LP: leukoplakia | ||
| NEOLP: Non-erosive oral lichen planus | ||
| OSCC: Oral squamous cell carcinoma | ||
| Thyroid | 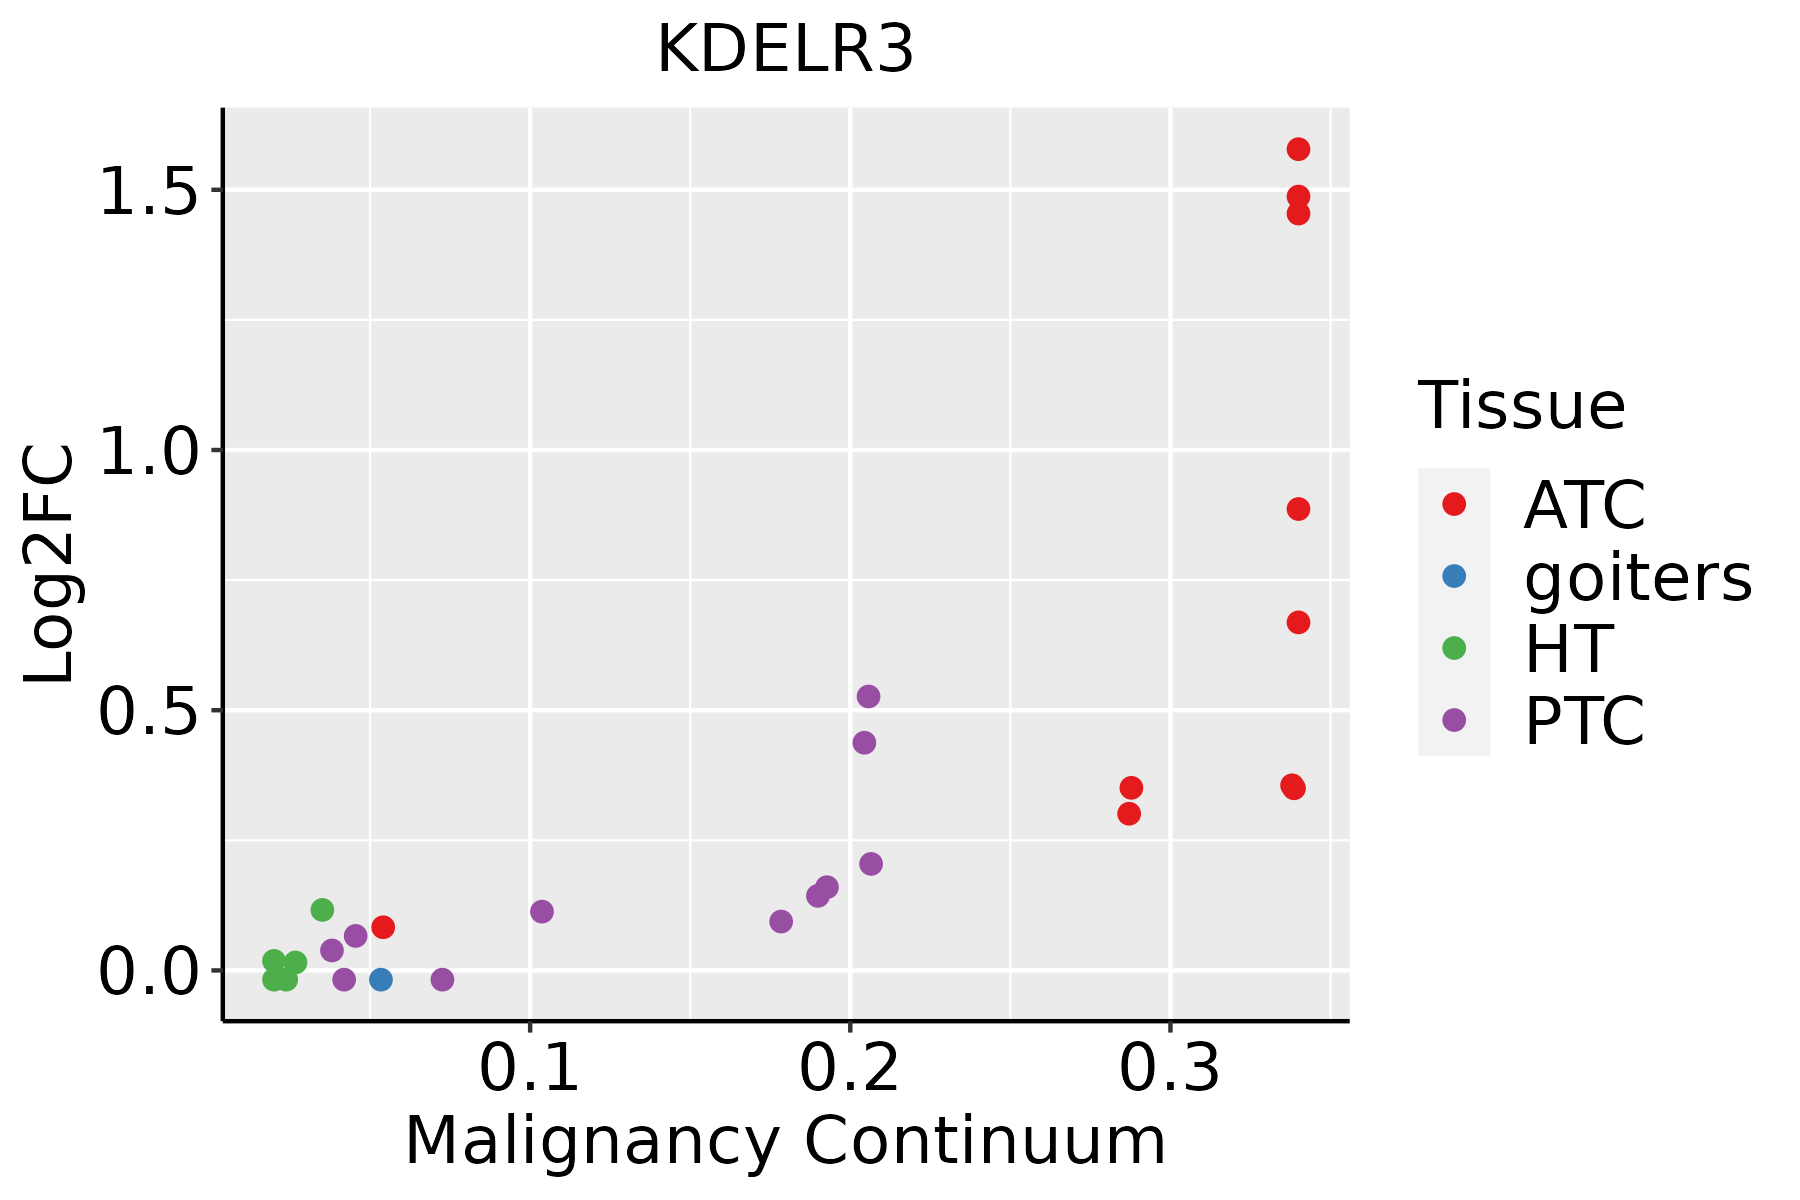 | ATC: Anaplastic thyroid cancer |
| HT: Hashimoto's thyroiditis | ||
| PTC: Papillary thyroid cancer |
| ∗log2FC in expression of this searched gene in stem-like cells from each diseased tissue sample relative to stem-like cells in normal samples in each tissue plotted against the malignancy continuum. Samples are colored based on if they are from different disease stage. |
Top |
Malignant transformation related pathway analysis |
| Find out the enriched GO biological processes and KEGG pathways involved in transition from healthy to precancer to cancer |
| Tissue | Disease Stage | Enriched GO biological Processes |
| Colorectum | AD |  |
| Colorectum | SER |  |
| Colorectum | MSS |  |
| Colorectum | MSI-H |  |
| Colorectum | FAP |  |
| ∗Top 15 enriched GO BP terms are showed in the bar plot of each disease state in each tissue. Each row represents a significant GO biological process which is colored according to the -log10(p.adjust). |
| Page: 1 2 3 4 5 6 7 8 9 |
| GO ID | Tissue | Disease Stage | Description | Gene Ratio | Bg Ratio | pvalue | p.adjust | Count |
| GO:004819318 | Esophagus | ESCC | Golgi vesicle transport | 231/8552 | 296/18723 | 1.82e-30 | 9.63e-28 | 231 |
| GO:000688815 | Esophagus | ESCC | endoplasmic reticulum to Golgi vesicle-mediated transport | 102/8552 | 130/18723 | 1.73e-14 | 9.22e-13 | 102 |
| GO:000689017 | Esophagus | ESCC | retrograde vesicle-mediated transport, Golgi to endoplasmic reticulum | 46/8552 | 52/18723 | 1.23e-10 | 3.66e-09 | 46 |
| GO:0045185111 | Esophagus | ESCC | maintenance of protein location | 71/8552 | 94/18723 | 3.41e-09 | 7.24e-08 | 71 |
| GO:0051235110 | Esophagus | ESCC | maintenance of location | 200/8552 | 327/18723 | 1.01e-08 | 2.02e-07 | 200 |
| GO:0032507110 | Esophagus | ESCC | maintenance of protein location in cell | 52/8552 | 65/18723 | 1.41e-08 | 2.77e-07 | 52 |
| GO:007259517 | Esophagus | ESCC | maintenance of protein localization in organelle | 36/8552 | 42/18723 | 8.46e-08 | 1.44e-06 | 36 |
| GO:007097218 | Esophagus | ESCC | protein localization to endoplasmic reticulum | 52/8552 | 74/18723 | 1.58e-05 | 1.42e-04 | 52 |
| GO:0051651111 | Esophagus | ESCC | maintenance of location in cell | 126/8552 | 214/18723 | 6.57e-05 | 5.00e-04 | 126 |
| GO:00354377 | Esophagus | ESCC | maintenance of protein localization in endoplasmic reticulum | 11/8552 | 14/18723 | 1.30e-02 | 4.27e-02 | 11 |
| GO:004819311 | Liver | Cirrhotic | Golgi vesicle transport | 153/4634 | 296/18723 | 1.02e-23 | 6.43e-21 | 153 |
| GO:000688811 | Liver | Cirrhotic | endoplasmic reticulum to Golgi vesicle-mediated transport | 77/4634 | 130/18723 | 5.78e-17 | 7.56e-15 | 77 |
| GO:00709724 | Liver | Cirrhotic | protein localization to endoplasmic reticulum | 45/4634 | 74/18723 | 4.79e-11 | 2.73e-09 | 45 |
| GO:00451857 | Liver | Cirrhotic | maintenance of protein location | 46/4634 | 94/18723 | 3.31e-07 | 7.90e-06 | 46 |
| GO:00325074 | Liver | Cirrhotic | maintenance of protein location in cell | 35/4634 | 65/18723 | 4.60e-07 | 1.05e-05 | 35 |
| GO:00068905 | Liver | Cirrhotic | retrograde vesicle-mediated transport, Golgi to endoplasmic reticulum | 29/4634 | 52/18723 | 1.69e-06 | 3.22e-05 | 29 |
| GO:005123511 | Liver | Cirrhotic | maintenance of location | 117/4634 | 327/18723 | 4.78e-06 | 7.86e-05 | 117 |
| GO:00516517 | Liver | Cirrhotic | maintenance of location in cell | 76/4634 | 214/18723 | 2.66e-04 | 2.37e-03 | 76 |
| GO:00725953 | Liver | Cirrhotic | maintenance of protein localization in organelle | 21/4634 | 42/18723 | 3.57e-04 | 3.03e-03 | 21 |
| GO:0035437 | Liver | Cirrhotic | maintenance of protein localization in endoplasmic reticulum | 9/4634 | 14/18723 | 1.99e-03 | 1.23e-02 | 9 |
| Page: 1 2 3 4 |
| Pathway ID | Tissue | Disease Stage | Description | Gene Ratio | Bg Ratio | pvalue | p.adjust | qvalue | Count |
| hsa0511028 | Esophagus | ESCC | Vibrio cholerae infection | 34/4205 | 50/8465 | 6.62e-03 | 1.62e-02 | 8.30e-03 | 34 |
| hsa05110112 | Esophagus | ESCC | Vibrio cholerae infection | 34/4205 | 50/8465 | 6.62e-03 | 1.62e-02 | 8.30e-03 | 34 |
| hsa0511021 | Liver | HCC | Vibrio cholerae infection | 35/4020 | 50/8465 | 1.04e-03 | 3.87e-03 | 2.15e-03 | 35 |
| hsa0511031 | Liver | HCC | Vibrio cholerae infection | 35/4020 | 50/8465 | 1.04e-03 | 3.87e-03 | 2.15e-03 | 35 |
| hsa0511026 | Oral cavity | OSCC | Vibrio cholerae infection | 32/3704 | 50/8465 | 3.05e-03 | 7.74e-03 | 3.94e-03 | 32 |
| hsa05110111 | Oral cavity | OSCC | Vibrio cholerae infection | 32/3704 | 50/8465 | 3.05e-03 | 7.74e-03 | 3.94e-03 | 32 |
| hsa0511027 | Oral cavity | LP | Vibrio cholerae infection | 25/2418 | 50/8465 | 1.07e-03 | 4.90e-03 | 3.16e-03 | 25 |
| hsa0511036 | Oral cavity | LP | Vibrio cholerae infection | 25/2418 | 50/8465 | 1.07e-03 | 4.90e-03 | 3.16e-03 | 25 |
| Page: 1 |
Top |
Cell-cell communication analysis |
| Identification of potential cell-cell interactions between two cell types and their ligand-receptor pairs for different disease states |
| Ligand | Receptor | LRpair | Pathway | Tissue | Disease Stage |
| Page: 1 |
Top |
Single-cell gene regulatory network inference analysis |
| Find out the significant the regulons (TFs) and the target genes of each regulon across cell types for different disease states |
| TF | Cell Type | Tissue | Disease Stage | Target Gene | RSS | Regulon Activity |
| ∗The dot plots of a searched regulon are shown for all cell subpopulations in each disease state of each tissue based on the regulon specific score inferred using pySCENIC and by calculating the average expression. |
| Page: 1 |
Top |
Somatic mutation of malignant transformation related genes |
| Annotation of somatic variants for genes involved in malignant transformation |
| Hugo Symbol | Variant Class | Variant Classification | dbSNP RS | HGVSc | HGVSp | HGVSp Short | SWISSPROT | BIOTYPE | SIFT | PolyPhen | Tumor Sample Barcode | Tissue | Histology | Sex | Age | Stage | Therapy Types | Drugs | Outcome |
| KDELR3 | SNV | Missense_Mutation | c.295N>G | p.Leu99Val | p.L99V | O43731 | protein_coding | tolerated(0.86) | benign(0.018) | TCGA-A1-A0SH-01 | Breast | breast invasive carcinoma | Female | <65 | I/II | Chemotherapy | tc | SD | |
| KDELR3 | SNV | Missense_Mutation | novel | c.349G>C | p.Glu117Gln | p.E117Q | O43731 | protein_coding | tolerated(0.06) | possibly_damaging(0.596) | TCGA-D8-A27V-01 | Breast | breast invasive carcinoma | Female | <65 | I/II | Hormone Therapy | tamoxiphen | SD |
| KDELR3 | SNV | Missense_Mutation | c.517N>A | p.Glu173Lys | p.E173K | O43731 | protein_coding | deleterious(0.01) | possibly_damaging(0.593) | TCGA-C5-A2LZ-01 | Cervix | cervical & endocervical cancer | Female | >=65 | III/IV | Unknown | Unknown | PD | |
| KDELR3 | SNV | Missense_Mutation | c.202N>G | p.Leu68Val | p.L68V | O43731 | protein_coding | deleterious(0.02) | benign(0.121) | TCGA-Q1-A73O-01 | Cervix | cervical & endocervical cancer | Female | <65 | I/II | Chemotherapy | cisplatin | CR | |
| KDELR3 | SNV | Missense_Mutation | c.265N>A | p.Glu89Lys | p.E89K | O43731 | protein_coding | tolerated(0.17) | benign(0.01) | TCGA-VS-A8Q8-01 | Cervix | cervical & endocervical cancer | Female | <65 | I/II | Unknown | Unknown | PD | |
| KDELR3 | SNV | Missense_Mutation | c.6N>A | p.Asn2Lys | p.N2K | O43731 | protein_coding | deleterious(0) | probably_damaging(0.979) | TCGA-DC-4745-01 | Colorectum | rectum adenocarcinoma | Female | <65 | III/IV | Chemotherapy | 5-fluorouracil | SD | |
| KDELR3 | SNV | Missense_Mutation | c.48N>T | p.Met16Ile | p.M16I | O43731 | protein_coding | tolerated(1) | benign(0) | TCGA-F5-6814-01 | Colorectum | rectum adenocarcinoma | Male | <65 | I/II | Unknown | Unknown | SD | |
| KDELR3 | SNV | Missense_Mutation | novel | c.251N>C | p.Lys84Thr | p.K84T | O43731 | protein_coding | tolerated(0.34) | benign(0.059) | TCGA-F5-6814-01 | Colorectum | rectum adenocarcinoma | Male | <65 | I/II | Unknown | Unknown | SD |
| KDELR3 | deletion | Frame_Shift_Del | rs567165767 | c.332_333delNN | p.Tyr111Ter | p.Y111* | O43731 | protein_coding | TCGA-A6-2686-01 | Colorectum | colon adenocarcinoma | Female | >=65 | I/II | Unknown | Unknown | SD | ||
| KDELR3 | SNV | Missense_Mutation | c.563N>T | p.Thr188Ile | p.T188I | O43731 | protein_coding | deleterious(0) | possibly_damaging(0.82) | TCGA-AP-A051-01 | Endometrium | uterine corpus endometrioid carcinoma | Female | >=65 | I/II | Unknown | Unknown | SD |
| Page: 1 2 3 |
Top |
Related drugs of malignant transformation related genes |
| Identification of chemicals and drugs interact with genes involved in malignant transfromation |
| (DGIdb 4.0) |
| Entrez ID | Symbol | Category | Interaction Types | Drug Claim Name | Drug Name | PMIDs |
| Page: 1 |

Copyright 2023-Present -The University of Texas Health Science Center at Houston |